Query Results & Settings
After you run a query, the results panel lets you explore raw data in a grid, build quick charts, review the executed SQL, and export results. This page also covers SQL Editor settings like query limits and connection resets.
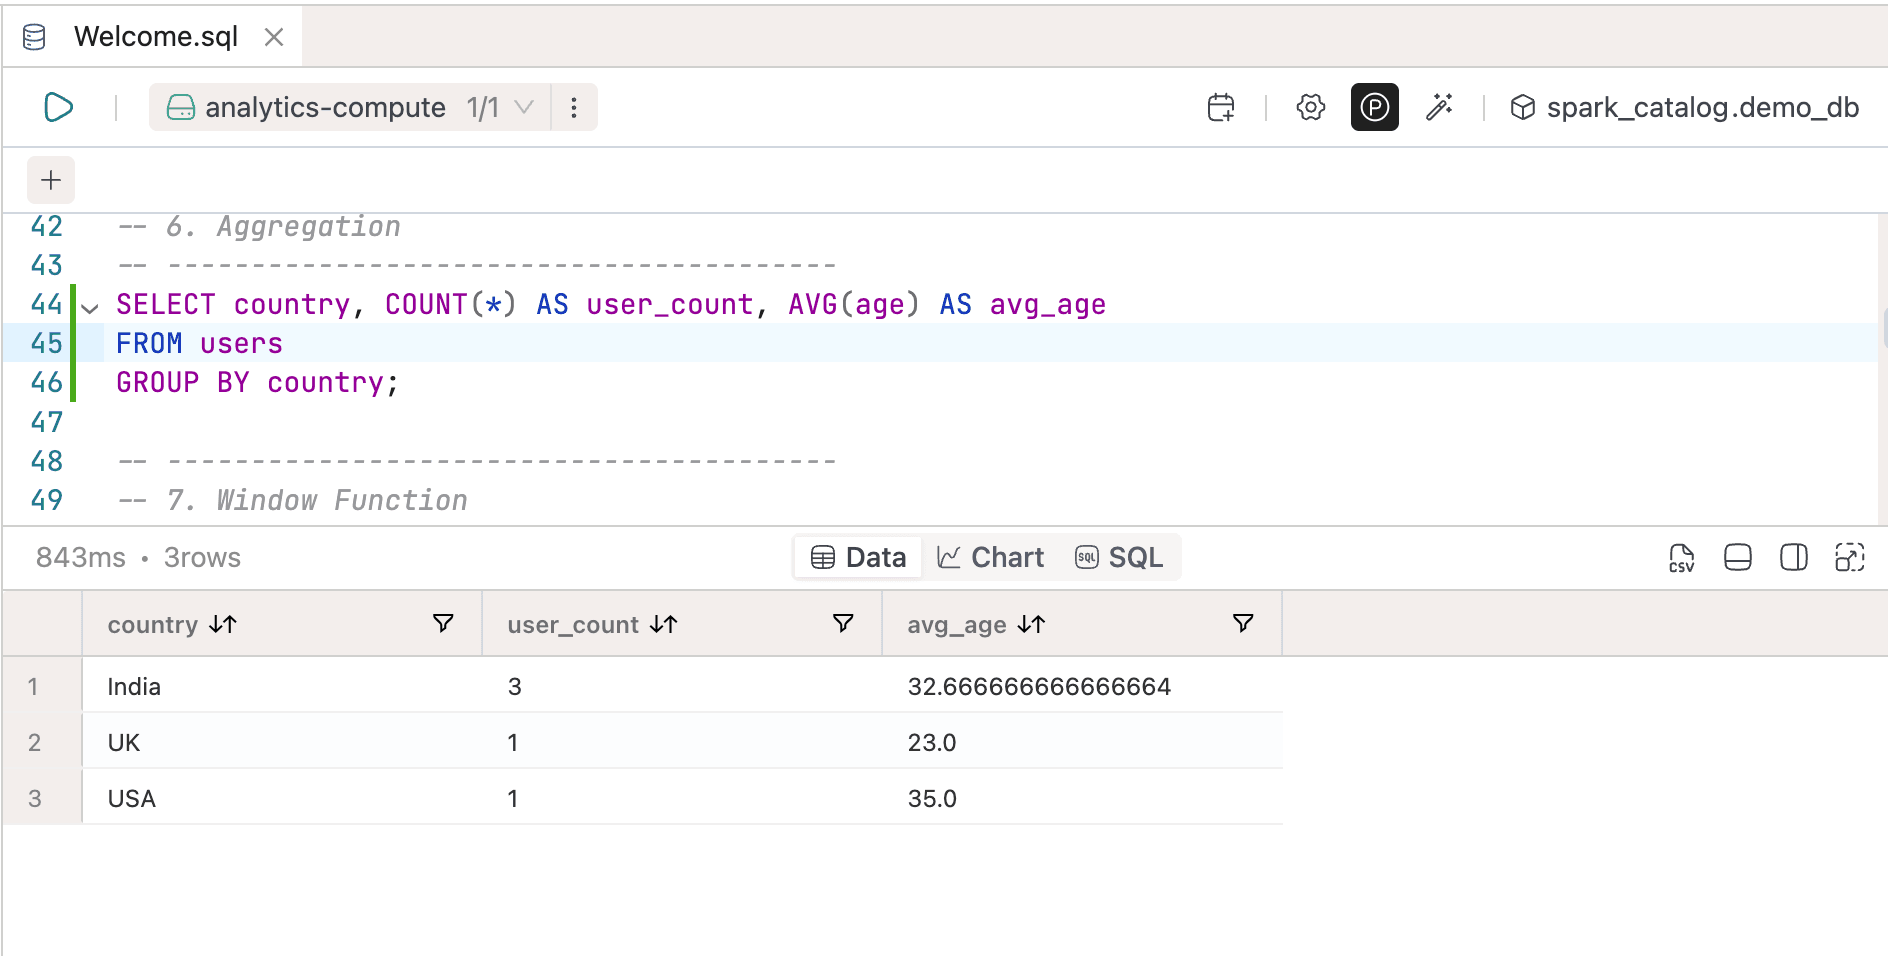
Viewing Query Results
Data View
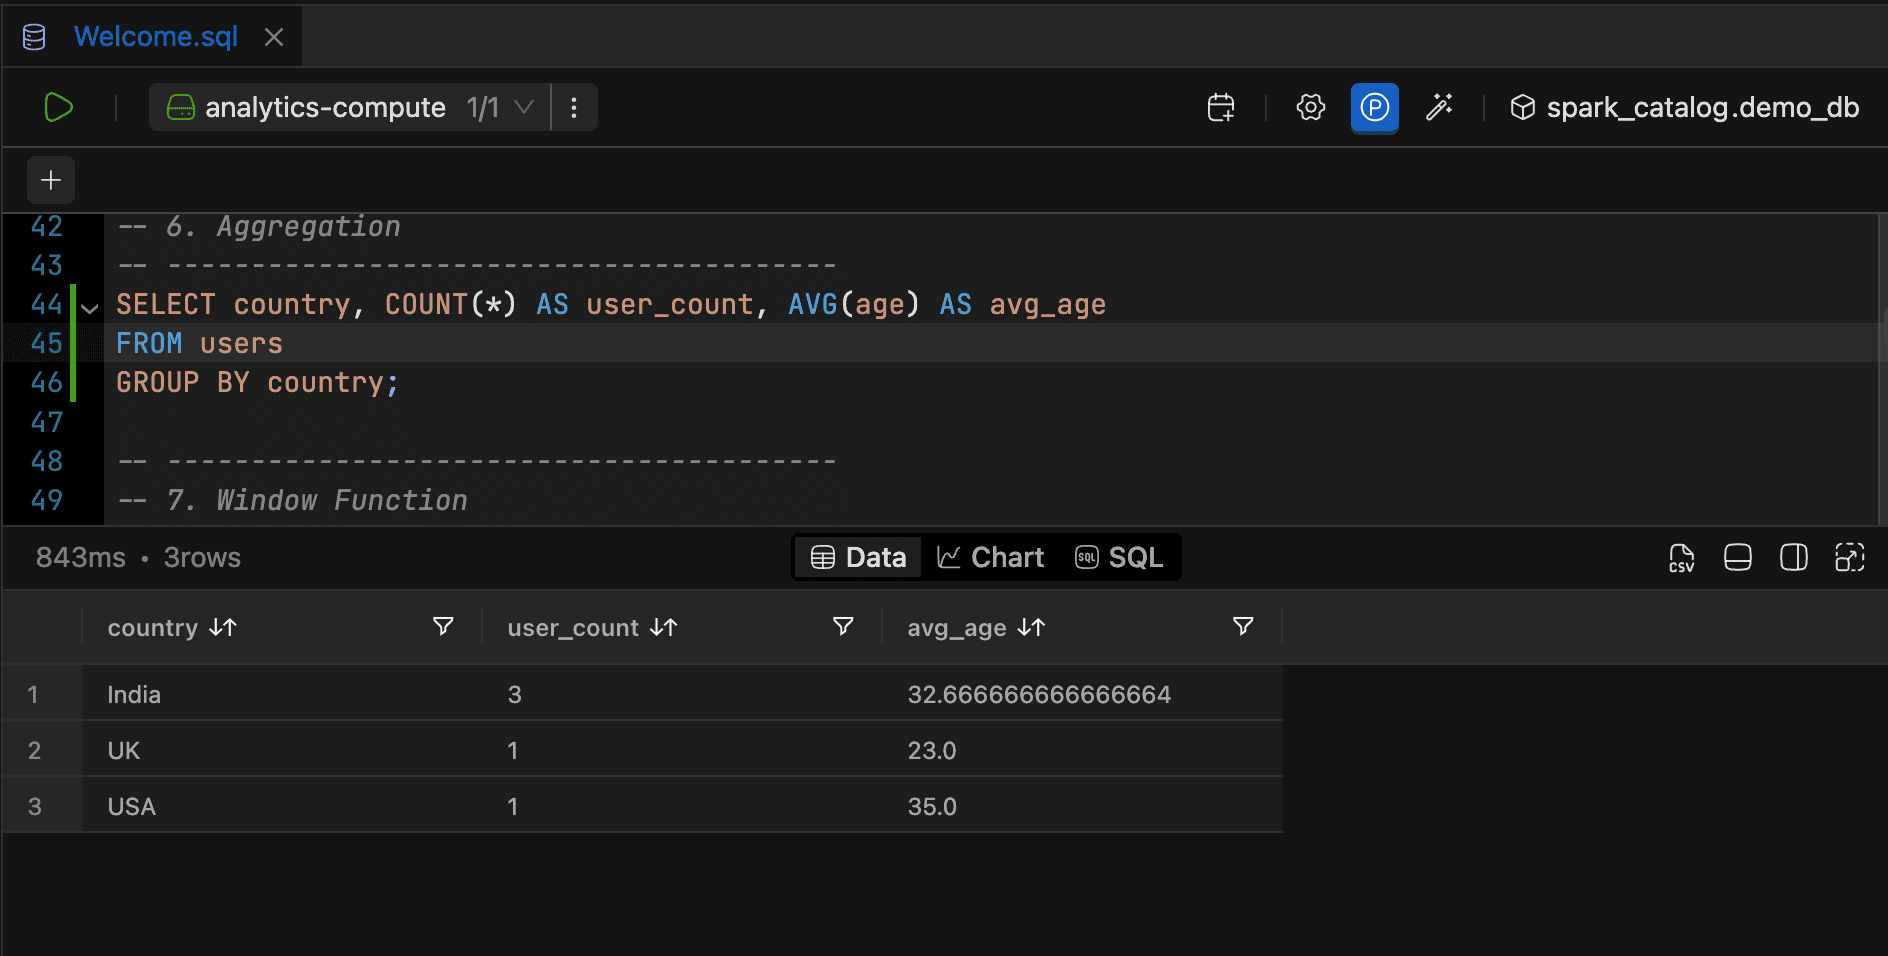
Results load into a sortable, filterable data grid. Hover over any column header to reveal the filter icon, then click it to filter by "contains," "equals," or other conditions.
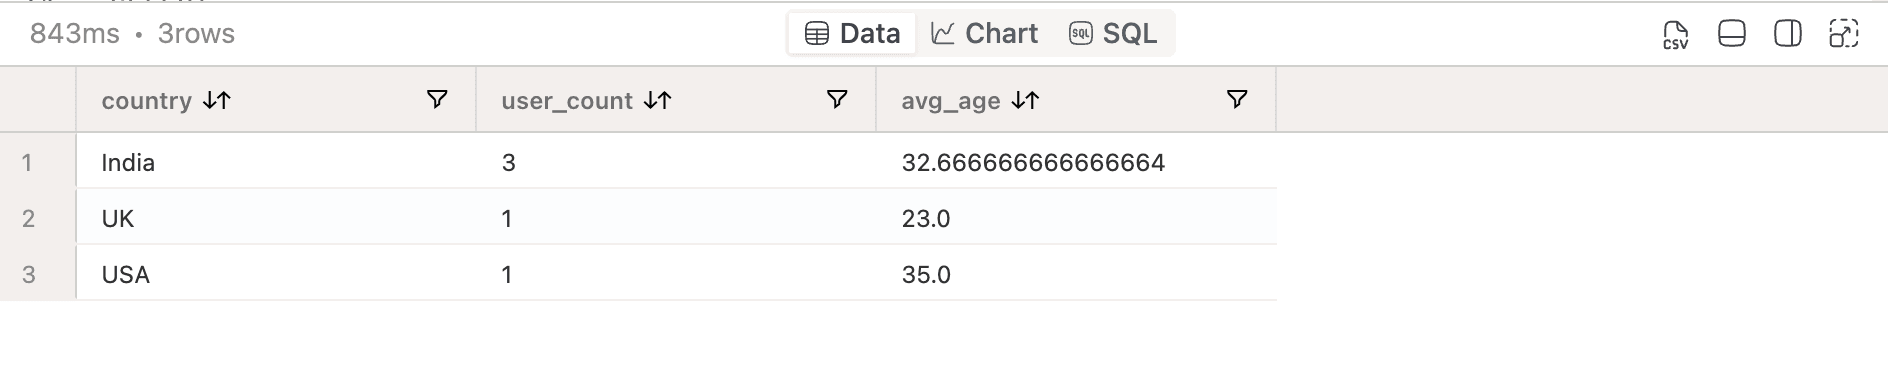

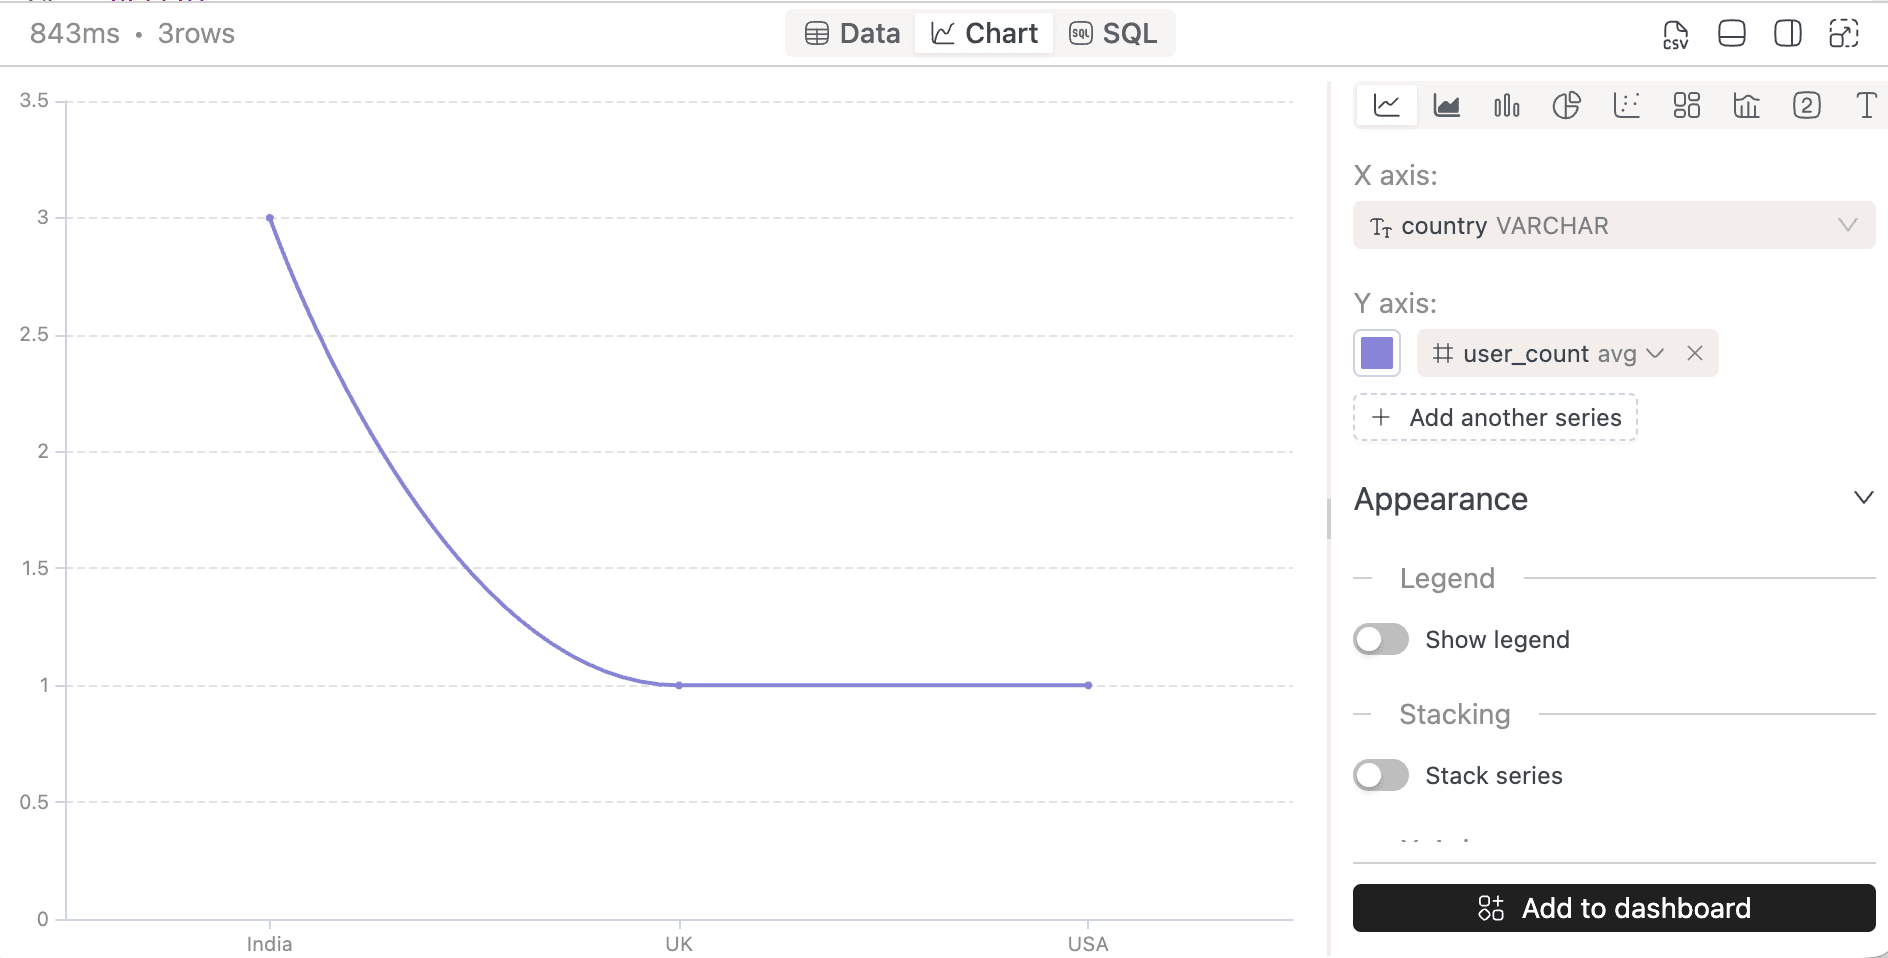
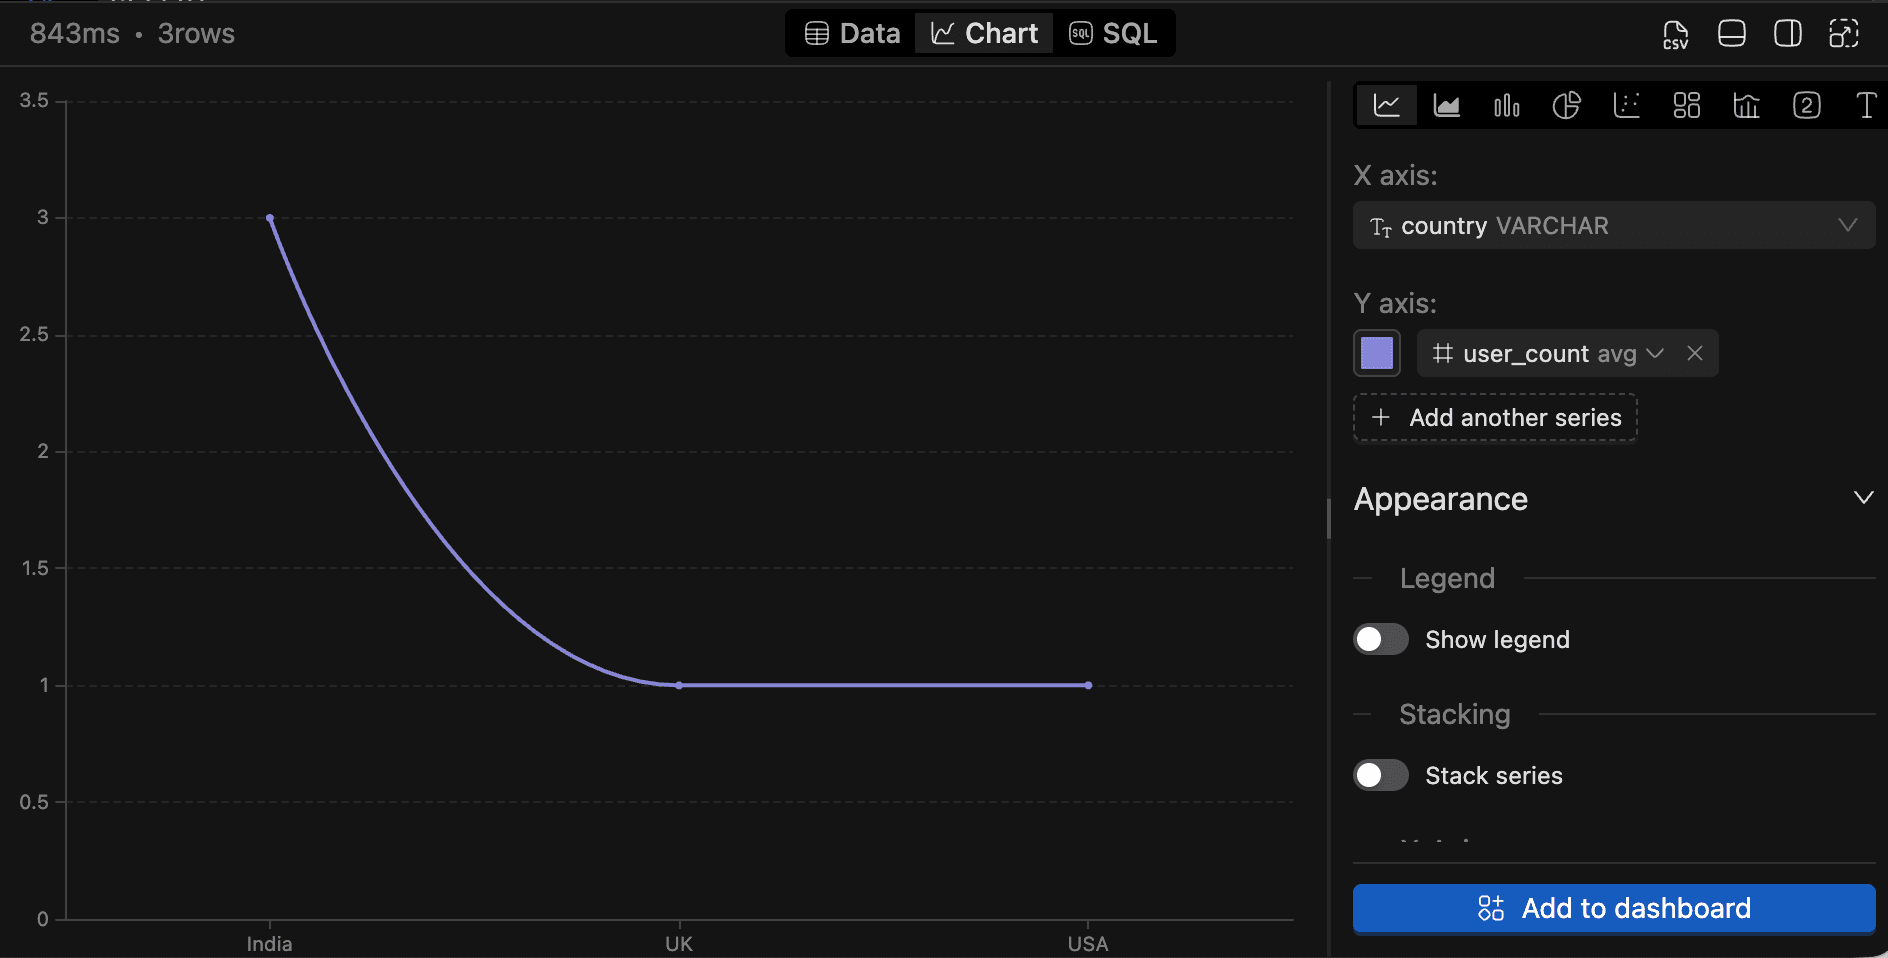
Chart View
To visualize your results, click the Chart tab. Choose from Bar (default), Line, Area, Pie/donut, Scatter, Treemap, Composed (multiple series types on one chart), Big Number, or Text.
The configuration panel on the right lets you customize:
- Dimension (X-axis) and Measure (Y-axis) with aggregation (
count,sum,avg,min,max,value) - Legend visibility and position
- Axis settings (show/hide labels, label rotation)
- Stacking for applicable chart types
- Series/Segment colors per series or segment
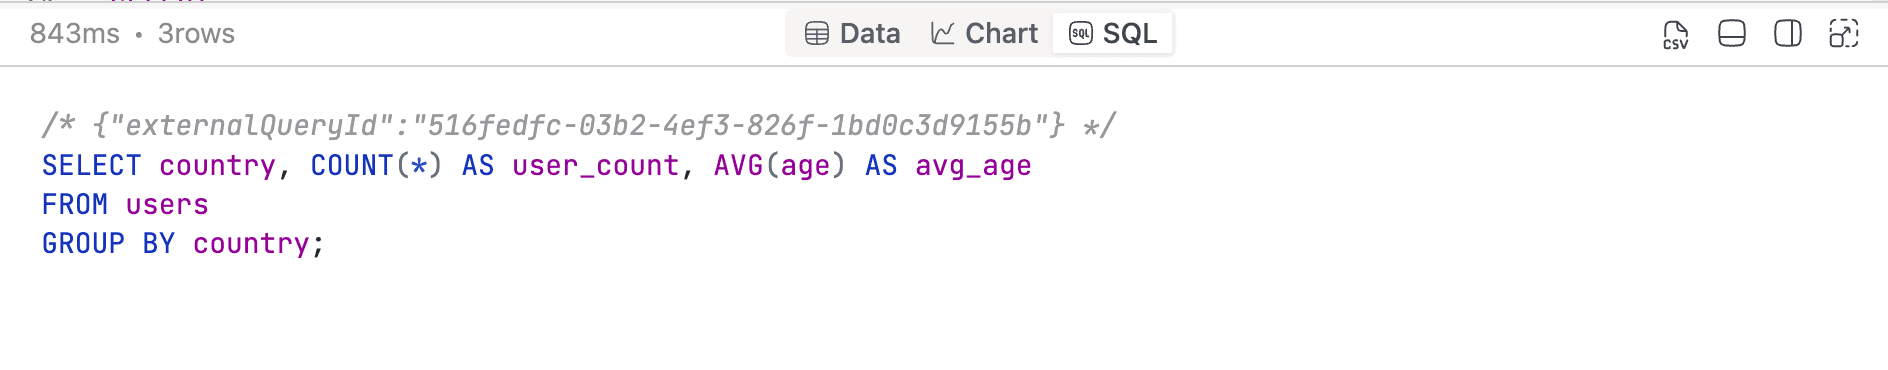
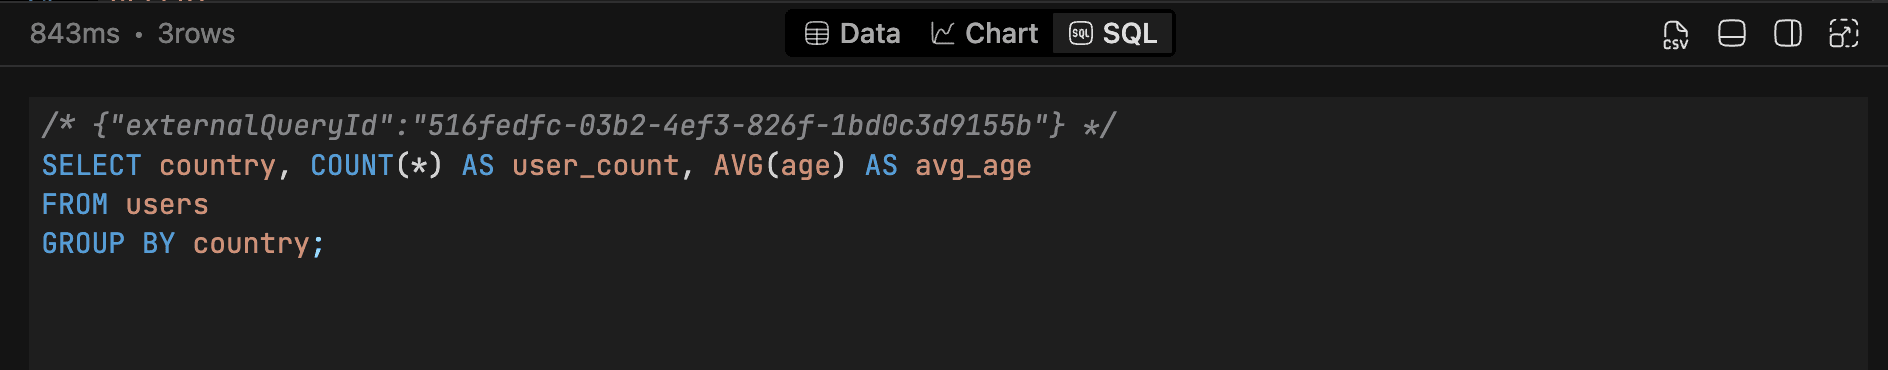
SQL View
This tab displays the exact SQL that executed, with all query variables resolved to their runtime values. Handy for verifying that substitutions worked as expected.
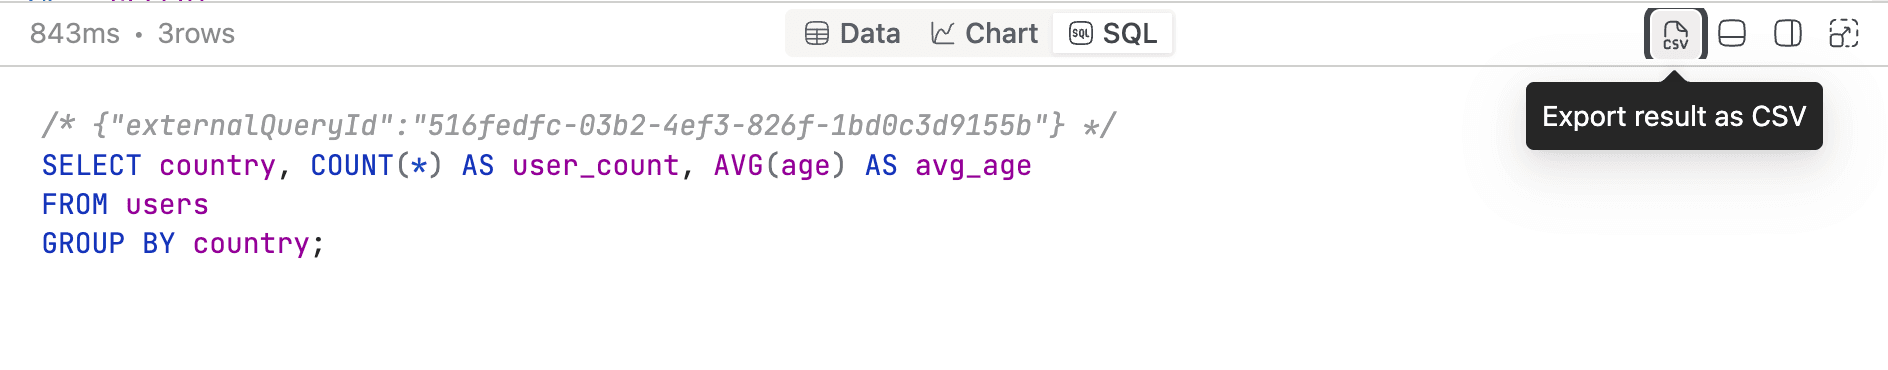
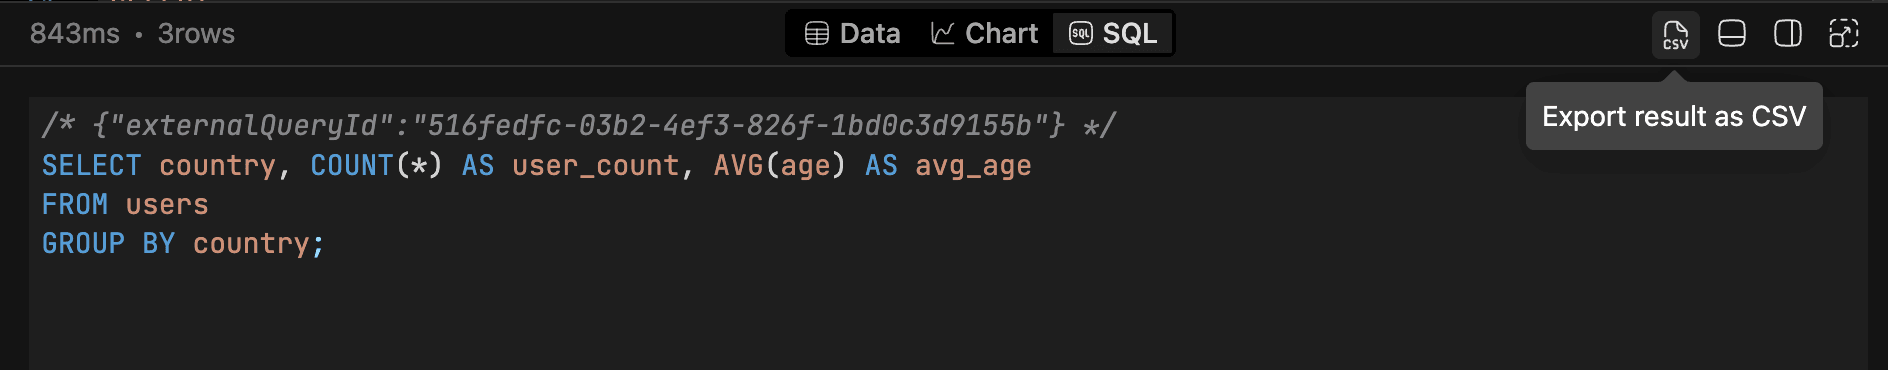
Exporting Results as CSV
Click the CSV icon in the results header to download your results as data.csv. This requires both the sql_editor.export permission and the downloadQueryResults module. If either is missing, the button is disabled and its tooltip explains why.
Results Header
The results header gives you a quick summary: query duration, row count (e.g., "42 rows"), and a status badge that stays visible until the query completes. The CSV export button sits at the far right.
SQL Editor Settings
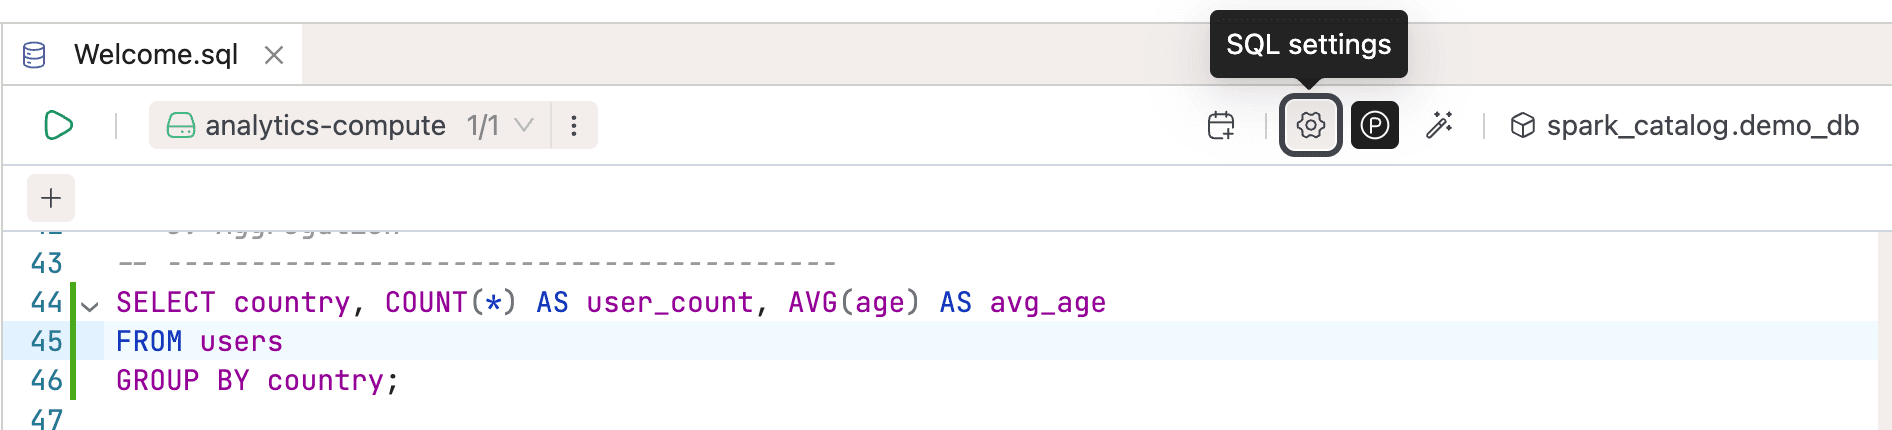
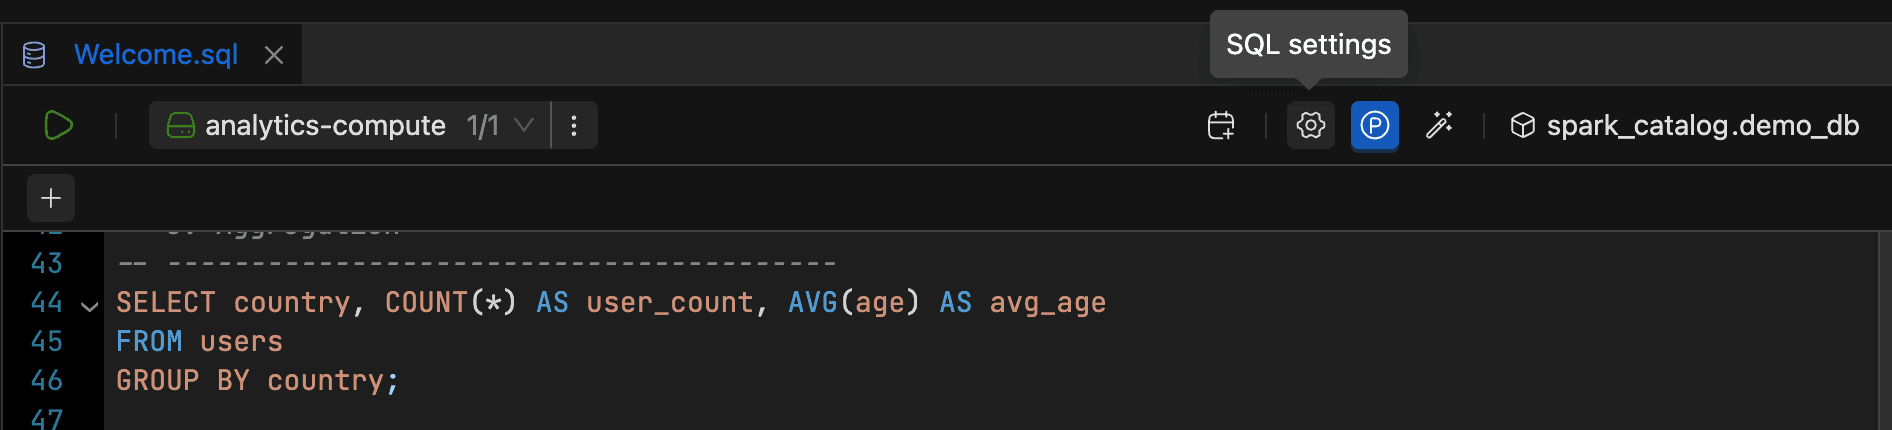
When you need to tweak query limits or recover from a stuck session, open the settings drawer. Click the SQL Settings button (gear icon) in the toolbar.
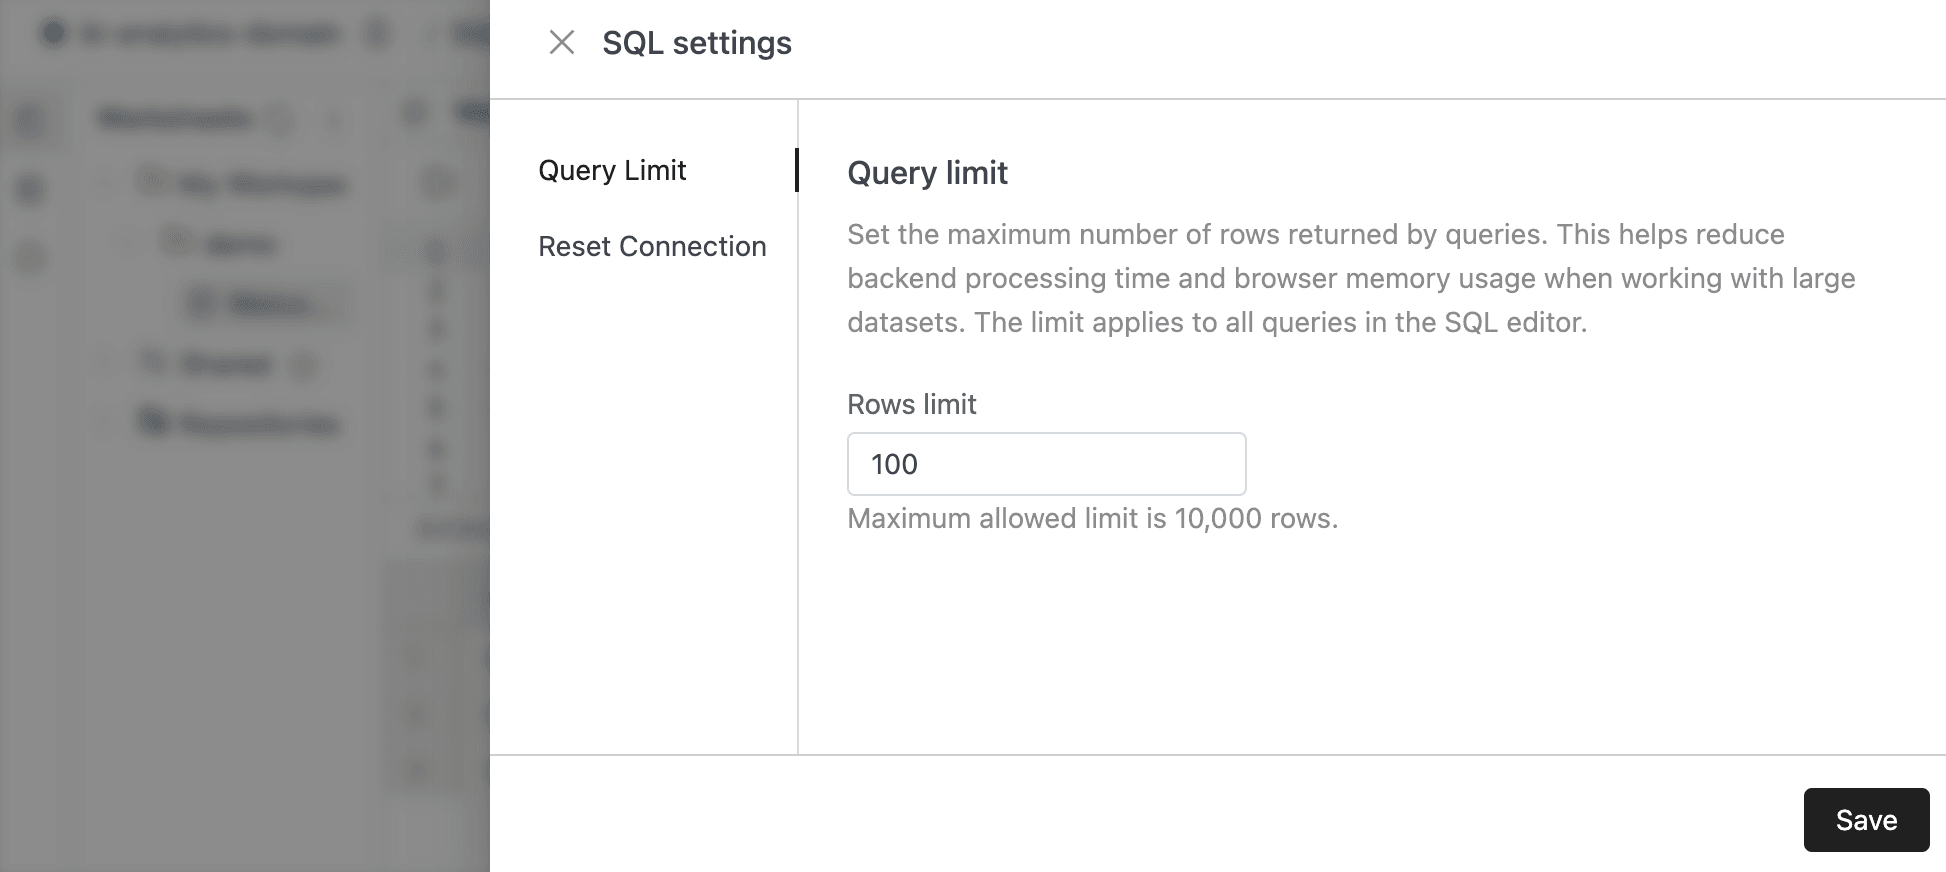
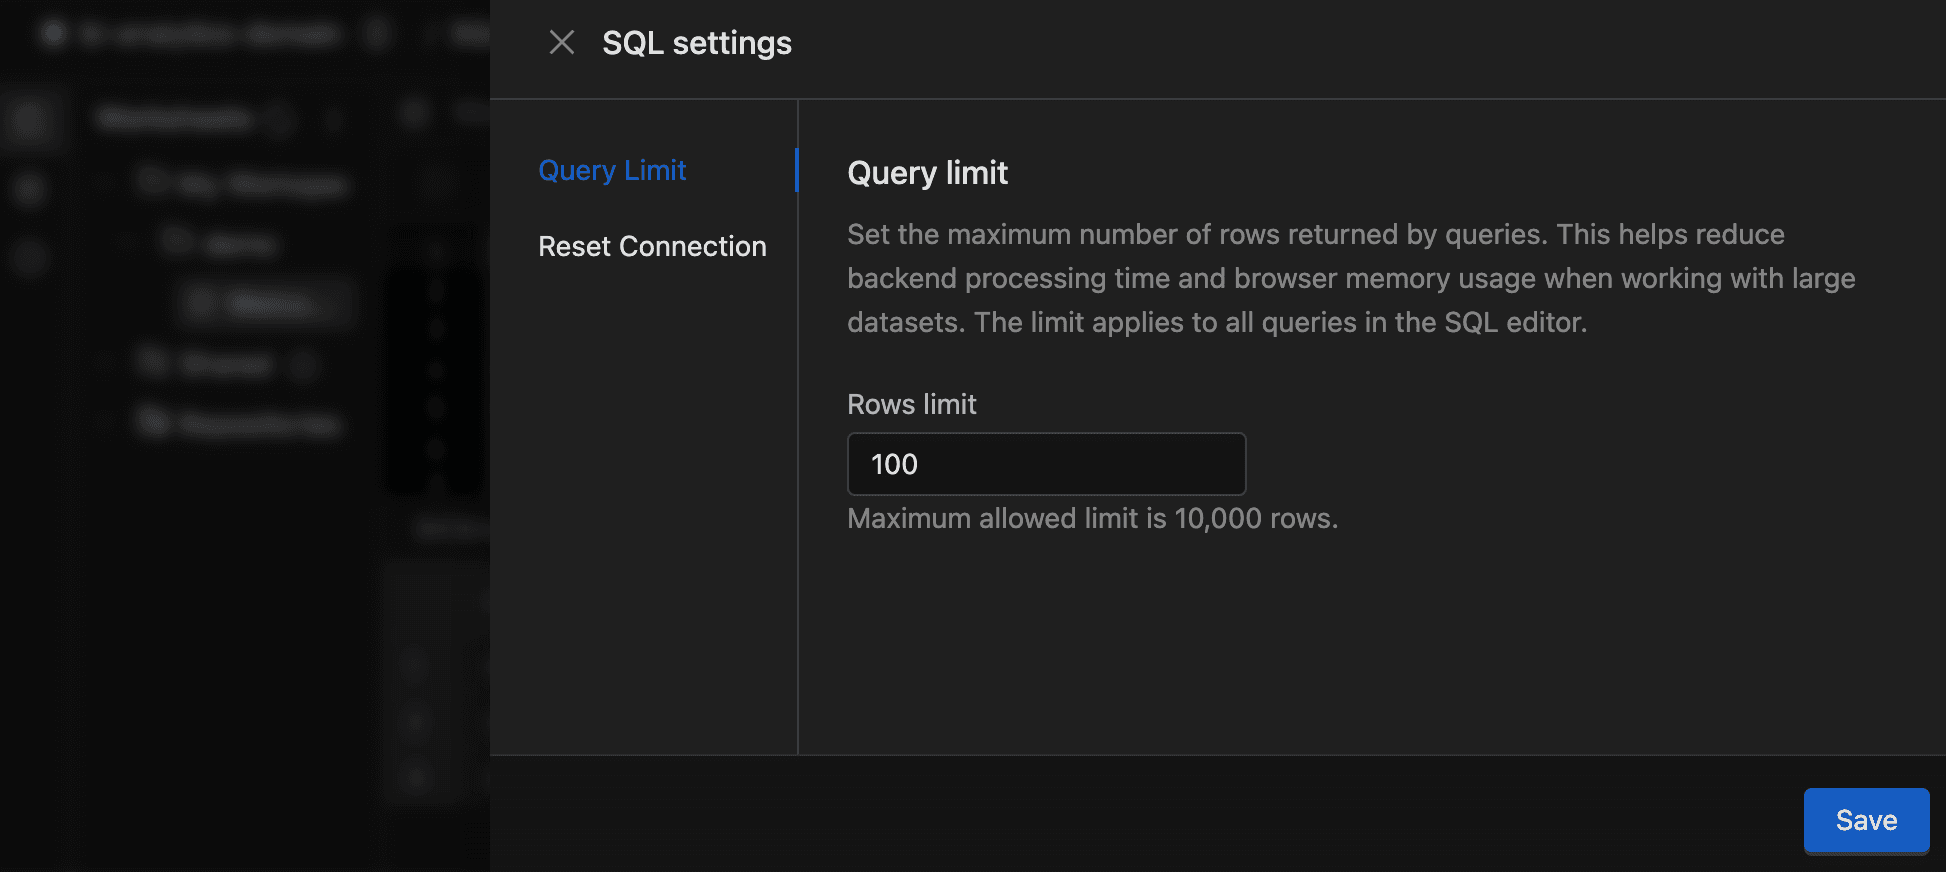
Query Limit
By default, queries return up to 100 rows. To change this, set the Rows limit (1 to 10,000) and click Save. The limit is stored in your browser and applies to all queries you run from it.
Resetting the Connection
If your database session enters an unexpected state (for example, a hung transaction), you can reset it:
- Open SQL Settings (gear icon).
- Switch to the Reset Connection tab.
- Click the red Reset connection button.
A notification confirms the reset.
Formatting SQL
Click Format SQL (beautify icon) in the toolbar to auto-format your SQL. This button is disabled for read-only worksheets (Git or shared).