Managing Clusters
Once a cluster is created, you can manage it from its detail page: check status, run lifecycle actions, and grab connection strings for external tools. Click any cluster name in the list to open it.
The page title reads Compute: {name}, and the breadcrumb shows Compute > {name}. The header contains state-aware action buttons (see Lifecycle Actions) plus two monitoring links:
- Spark Metrics UI: opens the Spark metrics dashboard. Always available.
- Spark UI: opens the live Spark web interface. Active only when the driver is
ACTIVE.
If another user deletes the cluster while you're viewing it, a yellow banner appears: This compute has been deleted.
Detail Page Tabs
Details Tab
The Details tab shows the cluster's current state and configuration.
The Compute section lists the cluster's ID, Name, Driver state badge, driver and executor node types, executor counts, Volume, and Auto scaling timeout. If the state is FAILED, a tooltip explains the failure reason. Single-node clusters hide executor-related fields.
The Metadata section shows the Namespace, Created by user and timestamp, Tags, and Description.


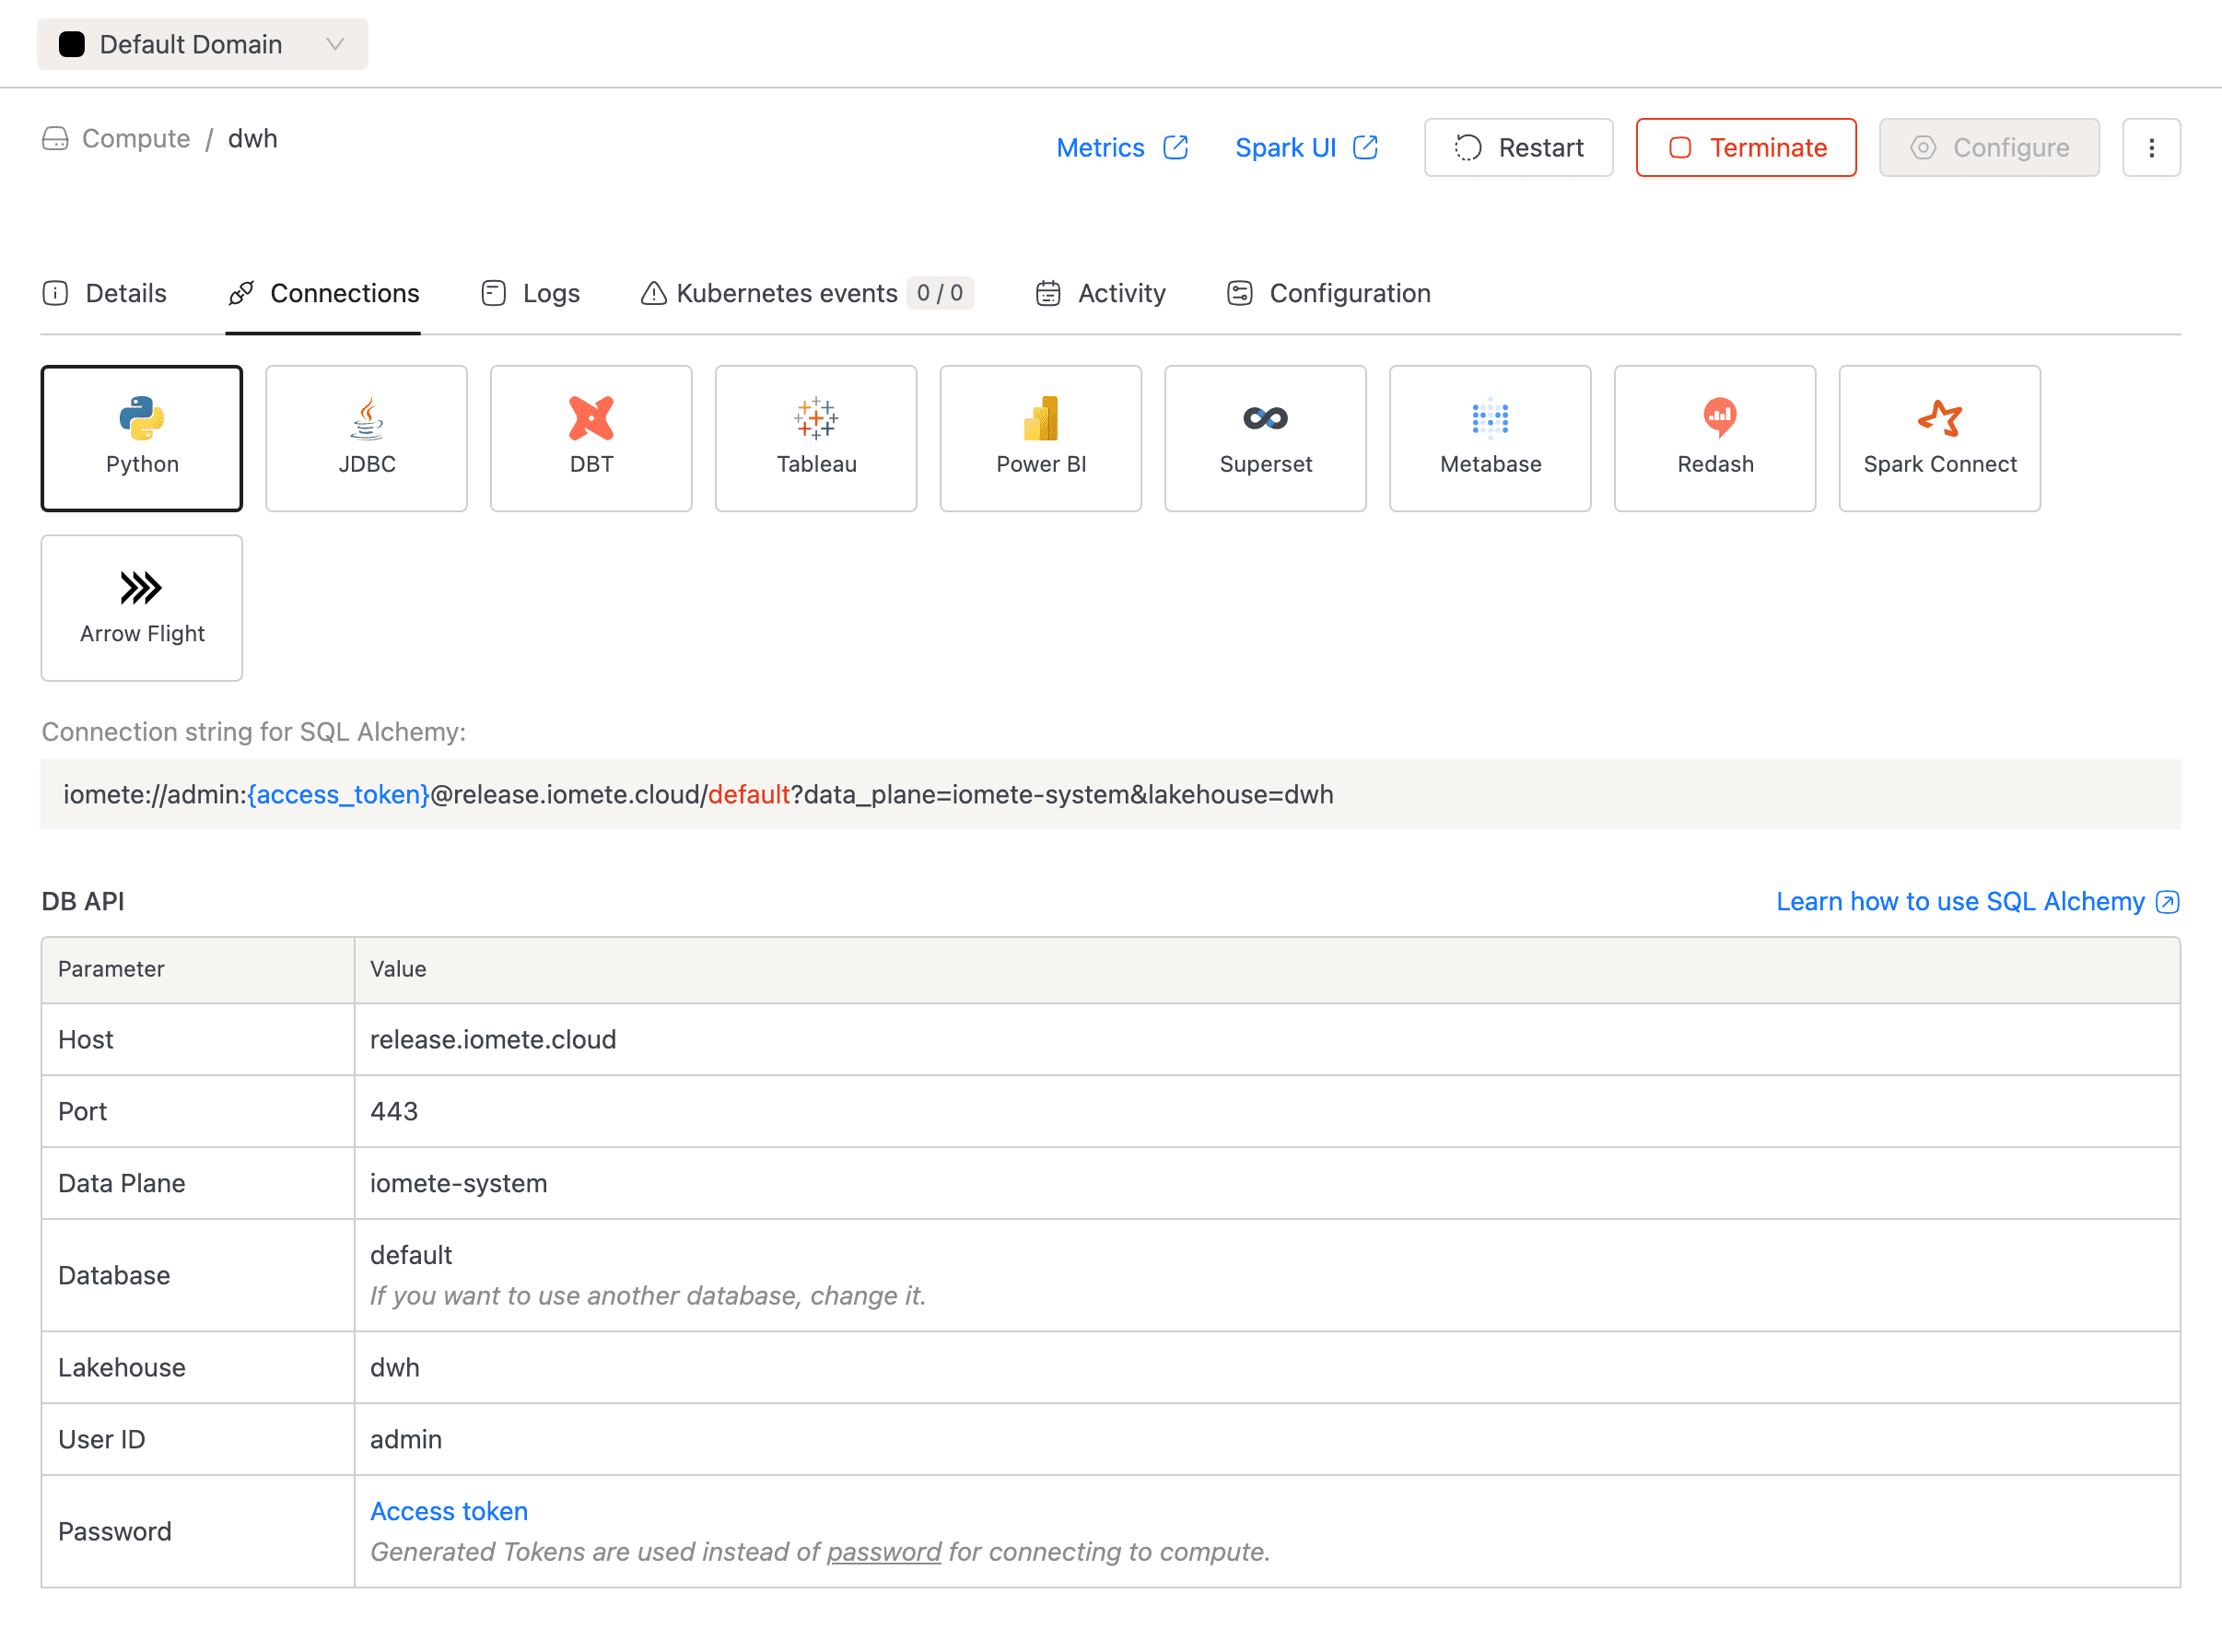
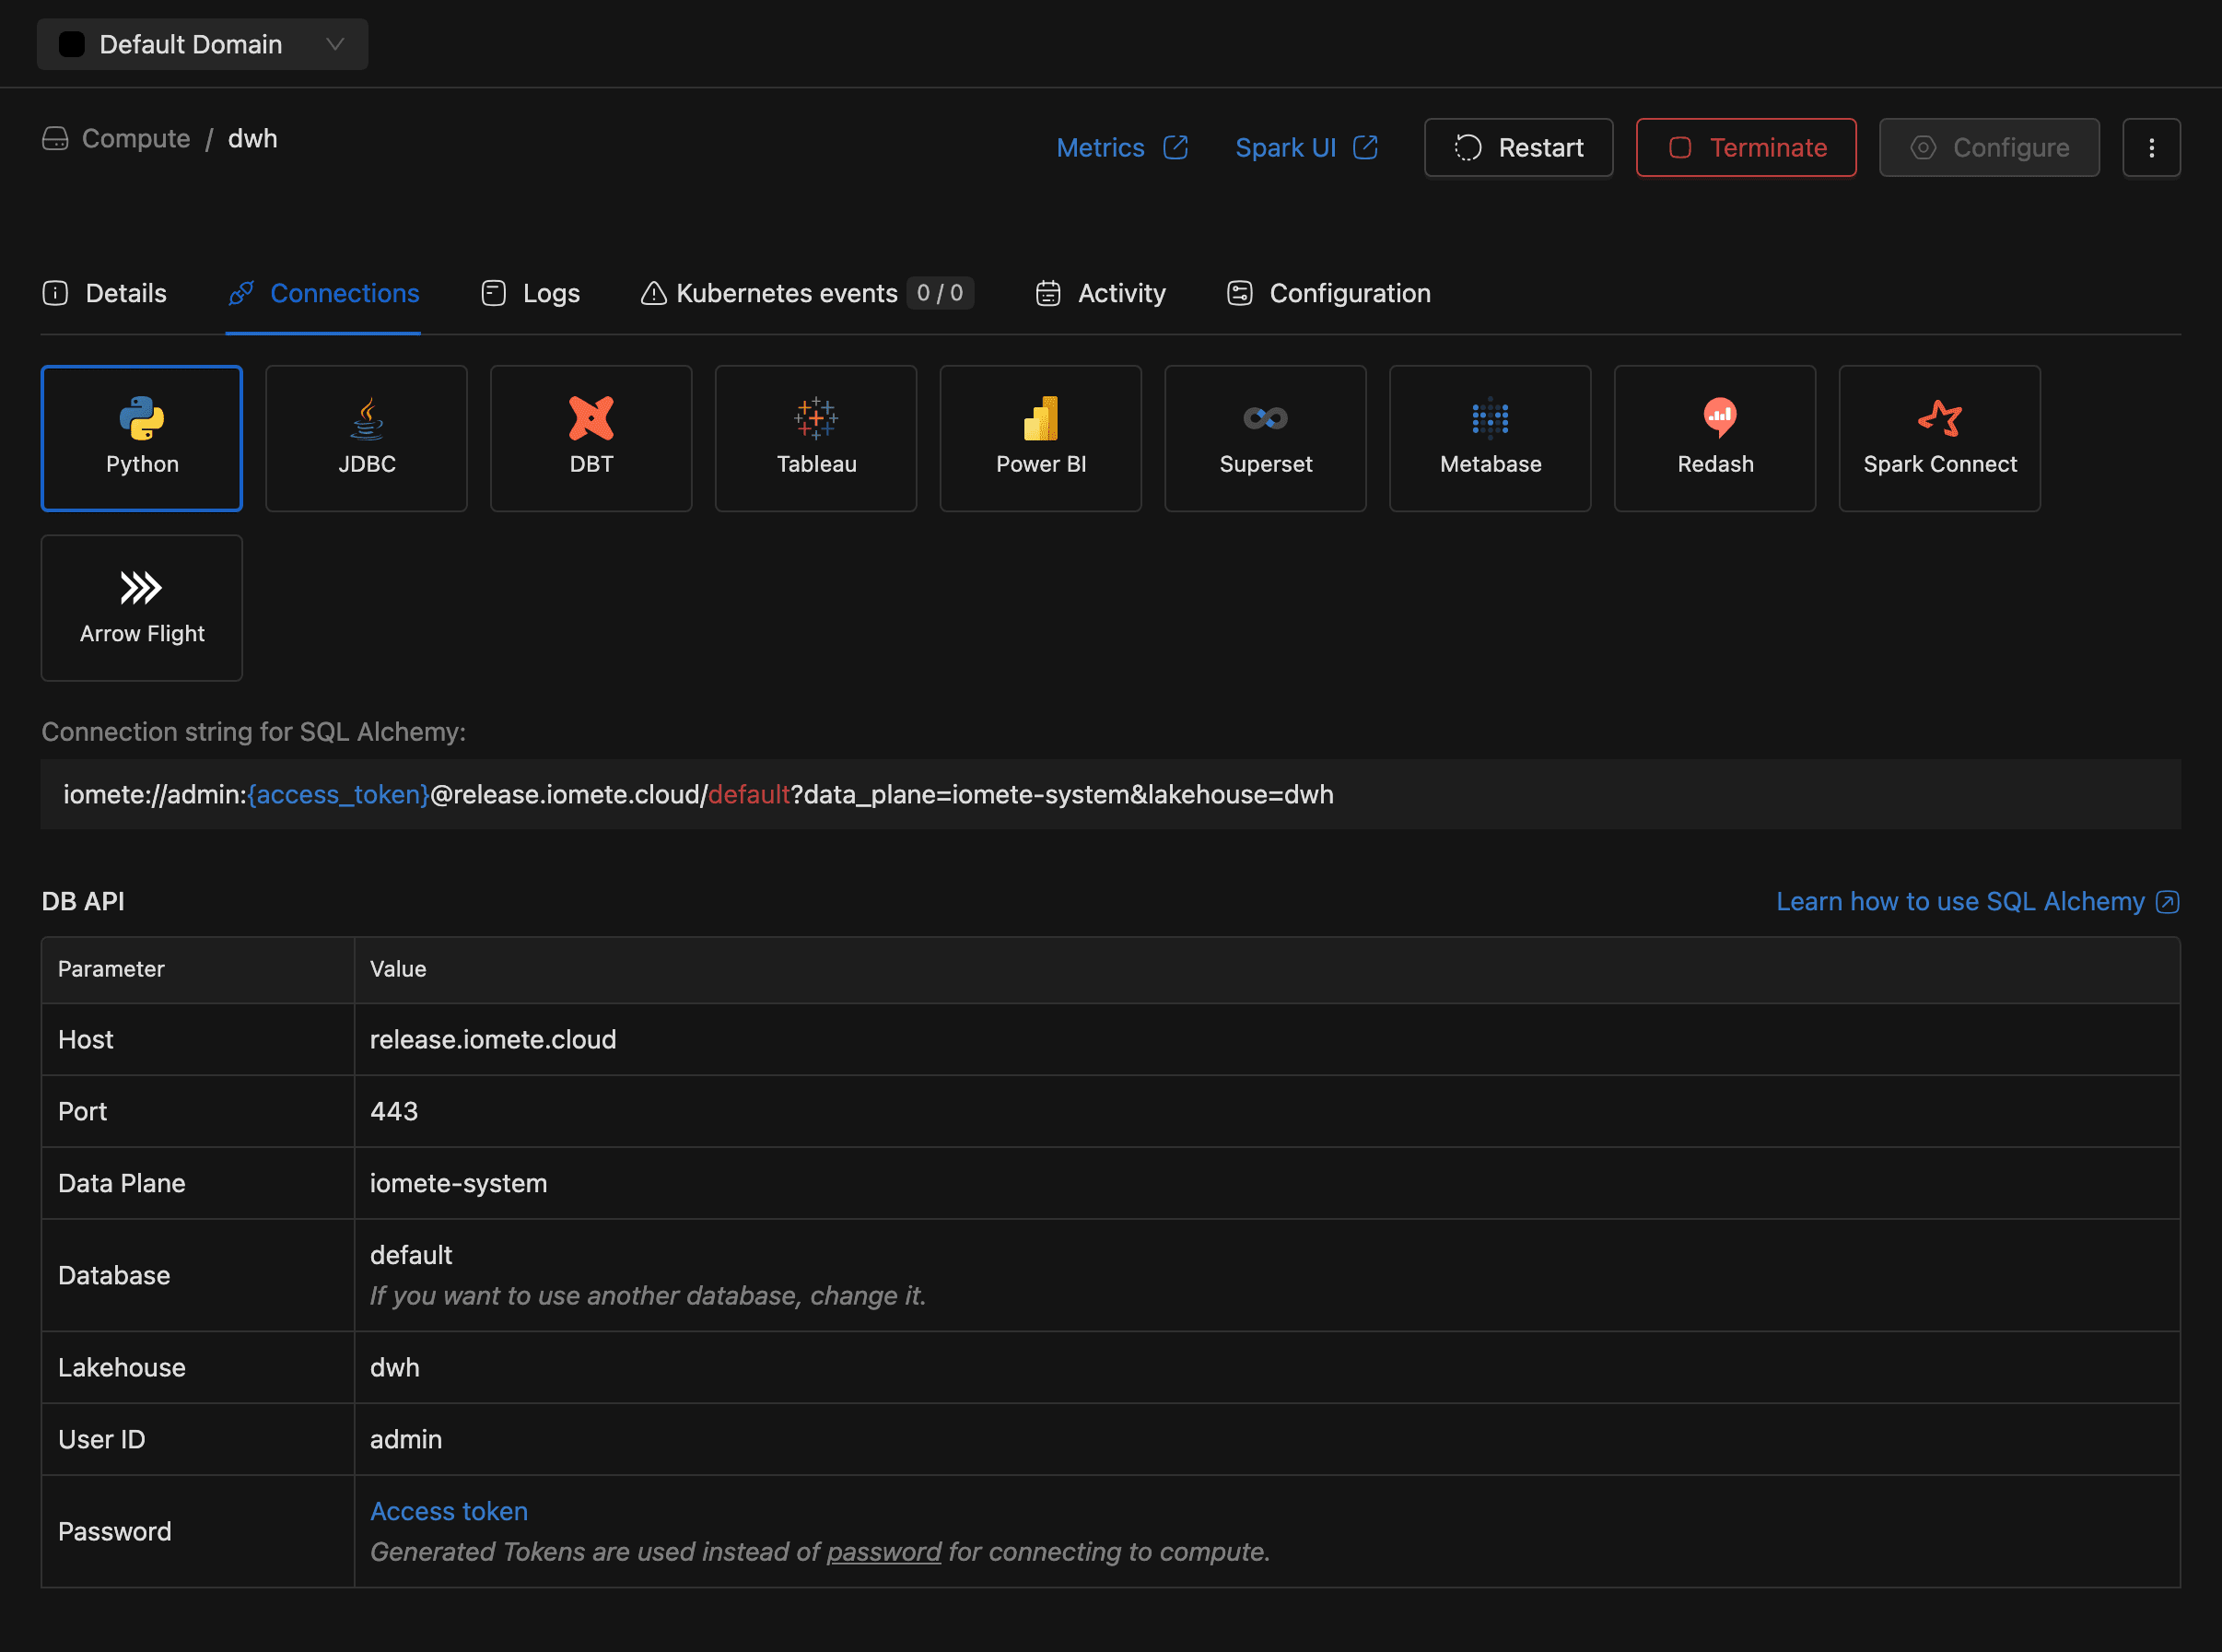
Connections Tab
Need to hook up a BI tool or application? The Connections tab provides ready-to-use snippets. Click a connection type card to see its configuration.
Available types include Python, JDBC, DBT, Tableau, Power BI, Superset, Metabase, Redash, and Spark Connect. If the Arrow Flight module is enabled, Arrow Flight appears as well.
Logs Tab
The Logs tab streams Spark driver logs in real time. Narrow the window with the time range selector, or click Download to save logs as spark-driver-logs.txt.
If per-executor logging is enabled, an Instance dropdown appears above the viewer so you can inspect individual pod logs.


Kubernetes Events Tab
The Kubernetes events tab lists pod-level events and highlights warnings. A badge on the tab shows warning and total counts (for example, 2 / 15), so problems stand out immediately. Kubernetes retains events for one hour by default.


Activity Tab
Every start and terminate event is recorded here. Each row shows the Action, Time, and User who triggered it. Results paginate at 20 rows per page.


Configuration Tab
This read-only tab lists every active Spark key-value pair, both your custom values and IOMETE system defaults.


Cluster States
Knowing which state a cluster is in tells you whether you're being billed, what actions are available, and where to look if something goes wrong.
Driver States
The driver cycles through four states. The page refreshes automatically when the state changes.
| State | Meaning | Available actions | Billing |
|---|---|---|---|
STARTING | Driver pod is booting (1 to 2 min, or 10 to 15 s with a hot pool). | Terminate, Restart | Not billed |
ACTIVE | Driver is running and accepting connections. Spark UI link becomes active. | Terminate, Restart | Billed |
STOPPED | Driver is offline. No connections accepted. | Start, Configure | Not billed |
FAILED | Driver crashed or didn't start. Check the Details tab tooltip for the error. | Terminate, Restart, Configure | Not billed |
A newly created cluster enters STARTING automatically, then moves to ACTIVE once the driver is ready or to FAILED if a deployment error occurs.
Executor States (Multi-Node Only)
The Details tab and the Executor list column both show executor state. These fields are hidden for single-node clusters.
| State display | Meaning |
|---|---|
| No running executors | All executors scaled to zero (auto-suspend). They scale up when a query arrives. |
Running N/M | N executors active out of M configured. |
Scaling N/M | N executors pending, waiting for Kubernetes resources. |
Running N/M + Scaling P/M | Mix of active and pending executors; load is increasing. |
You're only billed for executors in the Running state. Executors scaled to zero don't incur compute charges.
Lifecycle Actions
Day-to-day lifecycle actions (start, stop, restart, configure, delete) are available from two places: the detail page header and the ellipsis menu on each list row.


Configuring a Cluster
You can only reconfigure a cluster when the driver is STOPPED or FAILED. While it's running, the Configure button displays a tooltip asking you to terminate first.


Configure opens the same six-tab form used during creation, pre-populated with current values. Name and Bundle are read-only. After making changes, review them on the Review & Save tab and click Save.
After saving, the cluster may show an amber Restart required label in the list. Starting or restarting applies the new settings and clears the label.
Starting a Cluster
Click Start in the header or the list row ellipsis menu. There's no confirmation dialog: the driver moves straight from STOPPED to STARTING, then to ACTIVE. Start is enabled only when the driver is STOPPED with no other operation pending.
Restarting a Cluster
Click Restart in the header or the list row ellipsis menu, then confirm with Yes, restart it. The driver cycles through STOPPED then STARTING then ACTIVE. Available when the driver is ACTIVE, STARTING, or FAILED.


If the start phase fails after a successful terminate, the cluster stays STOPPED. Check the Logs and Kubernetes events tabs to diagnose the failure.
Terminating a Cluster
Click Terminate in the header or the list row ellipsis menu, then confirm with Yes, terminate it. The driver moves to STOPPED, all active connections drop, and executor state clears. Available when the driver is ACTIVE, STARTING, or FAILED.
Unlike restart, termination leaves the cluster stopped. Start it again manually when you're ready.


Deleting a Cluster
Deletion permanently removes the cluster and its configuration. Data in object storage isn't affected.
- Select Delete from the detail page or list row ellipsis menu.
- Type the exact cluster name in the confirmation modal.
- Click Delete. The button stays disabled until the name matches.
You can't undo this action. IOMETE permanently removes the cluster configuration and drops any active connections.

