Troubleshooting OOM kills on the Lakehouse driver pod
Troubleshooting OOM kills on the Lakehouse driver pod
Depending on the workload, it’s possible that the Spark driver for a configured Lakehouse may experience Out-Of-Memory (OOM) exceptions. If the driver fails, all in-flight jobs will be lost. Below is an overview of settings that can help troubleshoot and prevent these issues in your Lakehouse.
Verifying Driver Memory Settings
The following settings should be considered when configuring driver memory:
spark.driver.memoryspark.driver.memoryOverheadFactorspark.driver.memoryOverheadspark.driver.maxResultSizespark.sql.autoBroadcastJoinThreshold
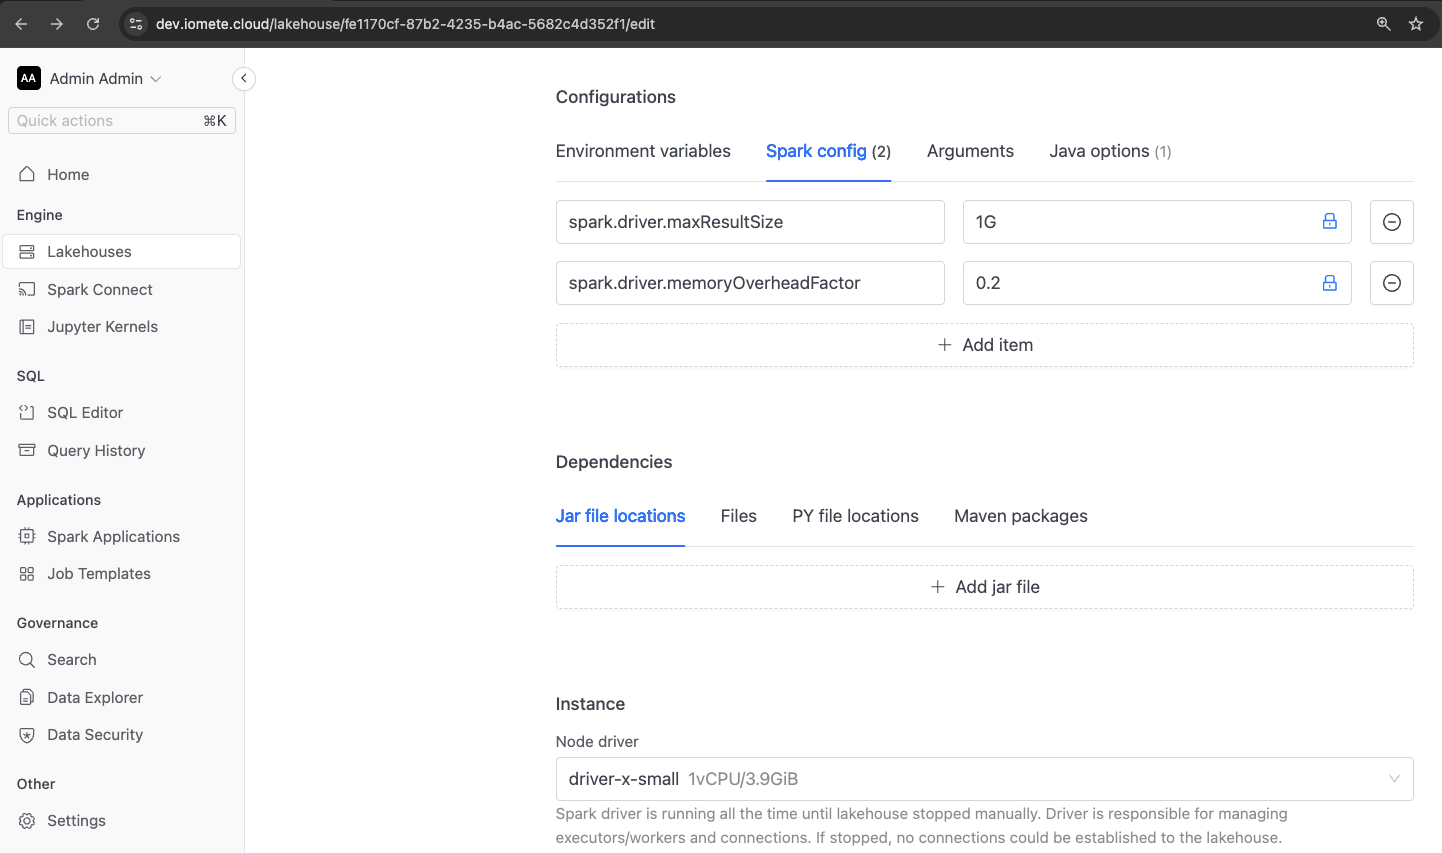
By default, IOMETE reserves 10% of the pod memory for the container OS. The remaining memory is allocated to spark.driver.memory. Within the driver, a certain percentage is reserved for JVM overhead, which is controlled by the spark.driver.memoryOverheadFactor property (default is 0.1 if not explicitly specified).
If you prefer to set an absolute value instead of a percentage, you can directly specify the spark.driver.memoryOverhead property with the desired value.
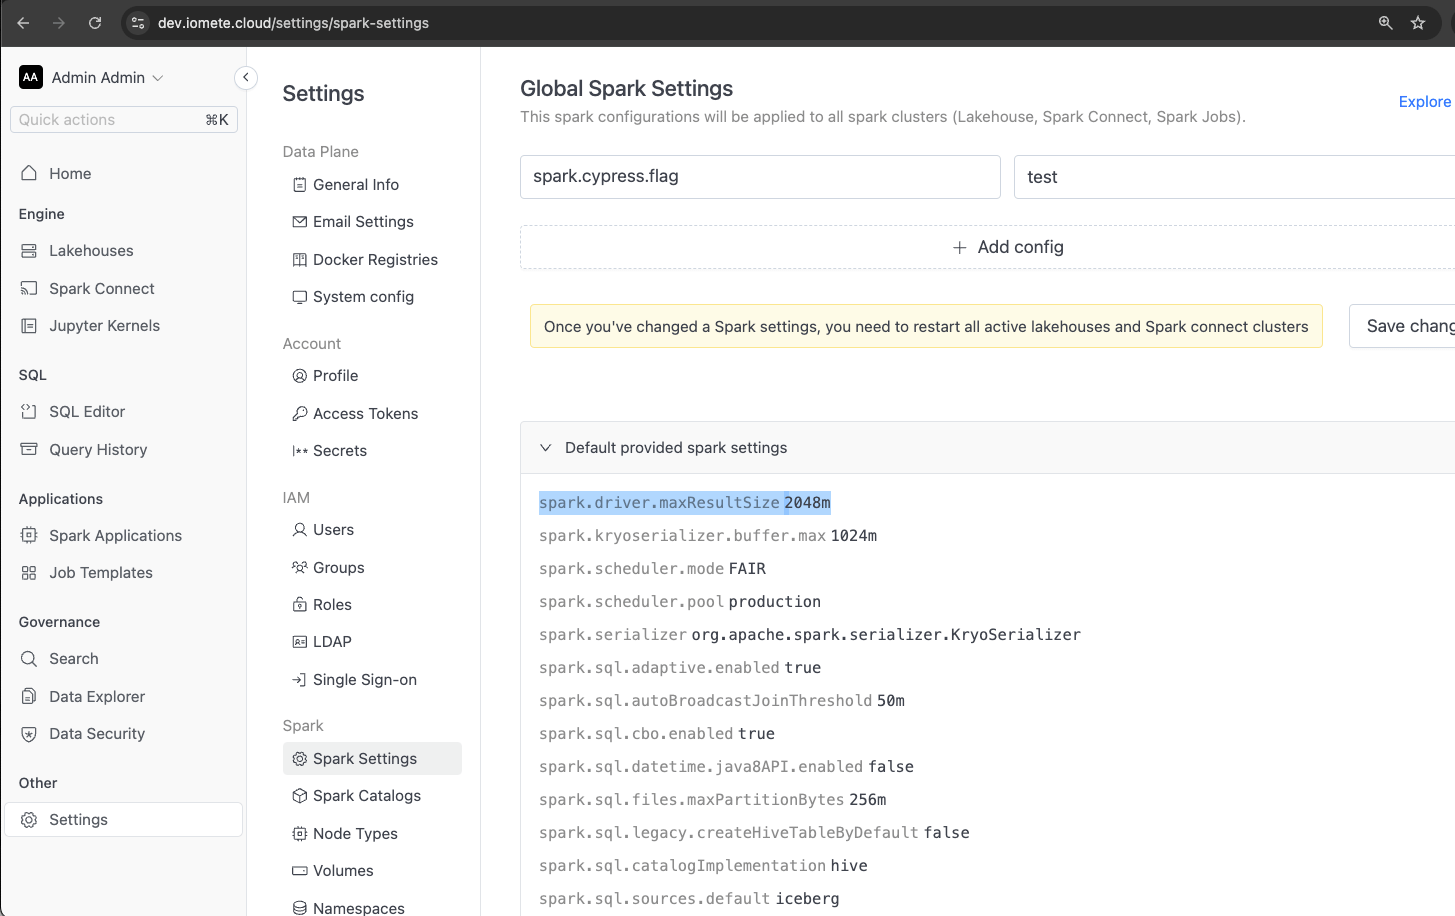
The default value for the spark.driver.maxResultSize property in IOMETE is 2GB. This setting aborts jobs if the total size of the serialized results from all partitions exceeds this value. If this value is set too large in relation to the available driver memory, it can result in out-of-memory (OOM) errors.
Lastly, spark.sql.autoBroadcastJoinThreshold controls the size threshold for automatic broadcast joins. A broadcast join is a type of join in which one of the tables is broadcasted to all worker nodes. Typically, this is used for smaller tables that can fit in memory. Increasing this threshold can improve the performance of joins, but setting it too high can lead to OOM kills if the broadcasted table is too large for the available memory.
Enabling Lakehouse Event Logs in Spark History
Currently, Spark event logs are only enabled for Spark jobs, and they are not enabled by default on the IOMETE Lakehouse. Enabling these event logs can be valuable for investigating which jobs were running at the time of an OOM kill, as they can be viewed in the Spark History UI.
To enable event logs, add the following properties to the Lakehouse configuration:
spark.eventLog.enabledspark.eventLog.dir
We recommend setting the value of spark.eventLog.dir to the same value of that IOMETE internally uses for the spark jobs.
This would default to the name of your configured s3 bucket appended with path /iomete-assets/spark-history. Please make sure to use s3a as this uses
hadoopfs underneath to write the data. Any other path you configure must exist or else the lakehouse driver will fail to start.
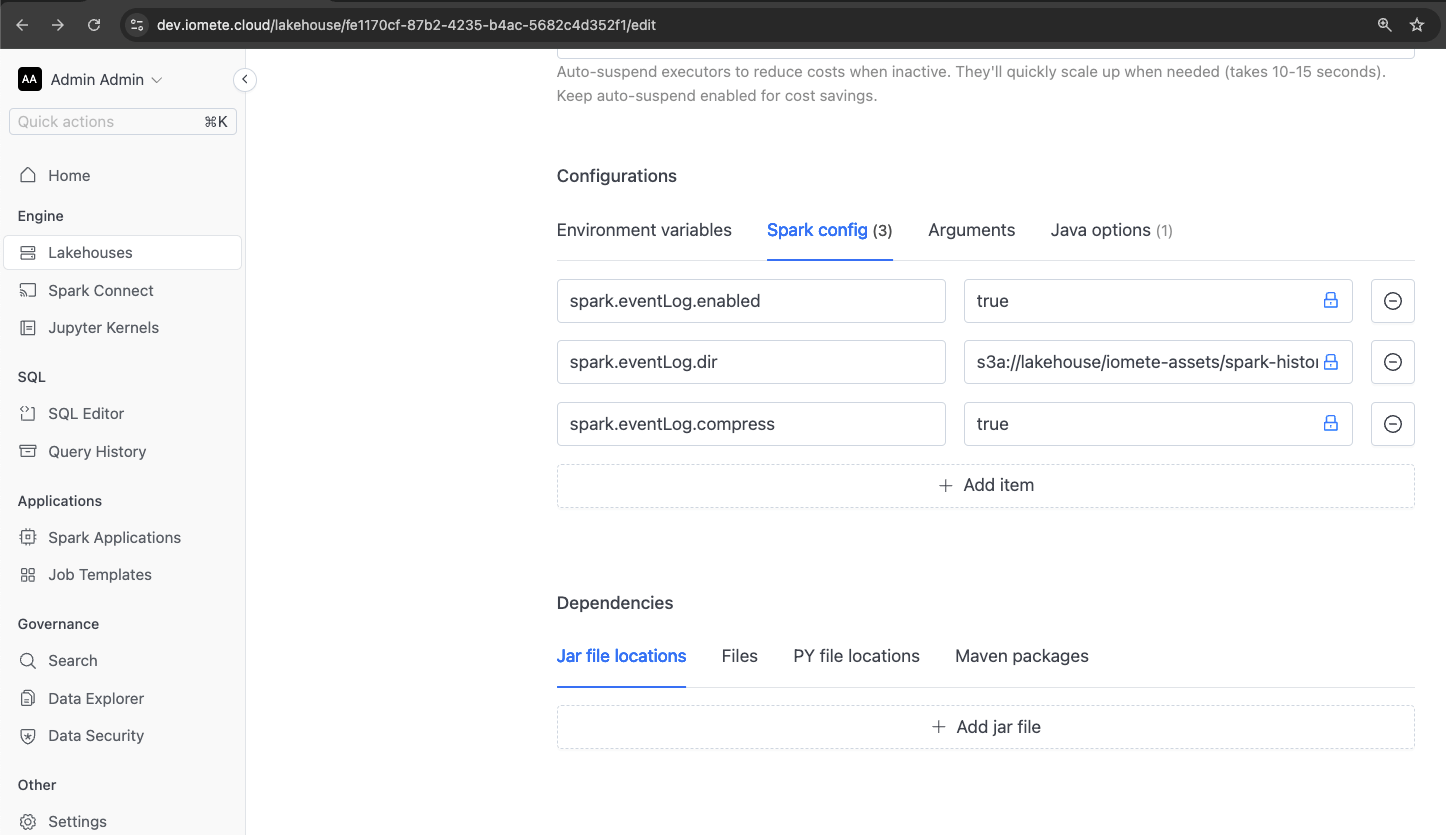
To help manage the size of the event logs, consider adding the following properties:
spark.eventLog.compressspark.eventLog.rolling.enabledspark.eventLog.rolling.maxFileSize
Enabling GC Logs
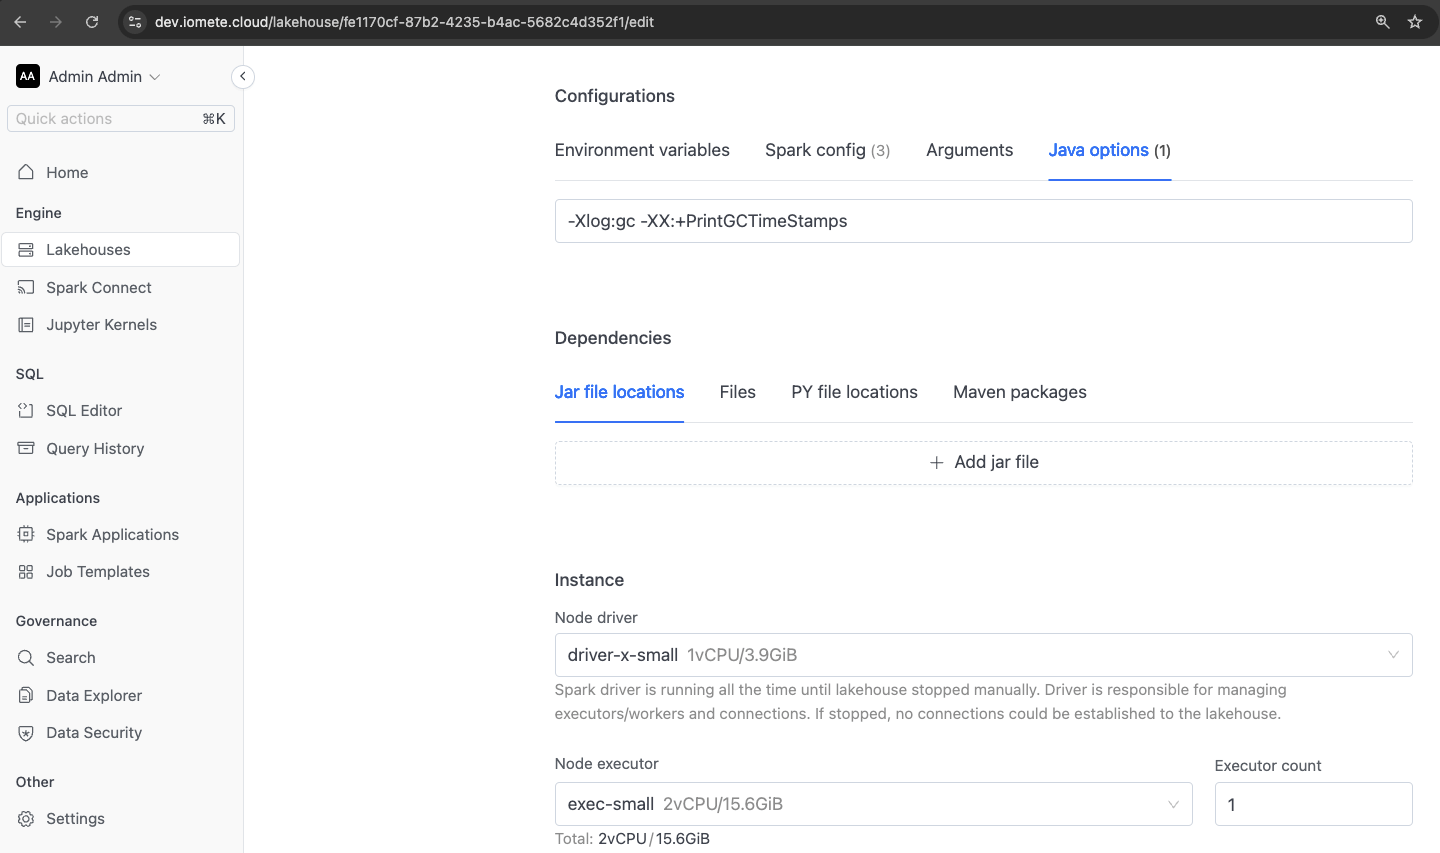
To view the details of the JVM garbage collector, you can add the following property:
-Xlog:gc
For better readability of the log entries, you may also want to include this property:
-XX:+PrintGCTimeStamps
If you want to capture the garbage collector logs to a file on disk, specify the path as follows:
-Xlog:gc:<file-system-path>
Note that the directory must already exist, as the JVM will not create it automatically. For example:
-Xlog:gc:/opt/spark/work-dir/gc/gc.log
To prevent the log file from growing too large and causing disk space issues, consider adding these properties for log rotation:
-XX:+UseGCLogFileRotation-XX:NumberOfGCLogFiles=<max-number-of-gc-files-to-keep>-XX:GCLogFileSize=<maximum-size-of-each-gc-log-file>
Please note that unless the path chosen for the GC logs is on a persistent volume claim (PVC) or network-attached storage, the log files will be lost if Kubernetes restarts the pod.
Capturing Memory Dumps
If you want to analyze what was consuming memory inside the JVM at the time of an OOM error, you can add the following properties:
-XX:+HeapDumpOnOutOfMemoryError-XX:HeapDumpPath=<path-to-store-heapdump>
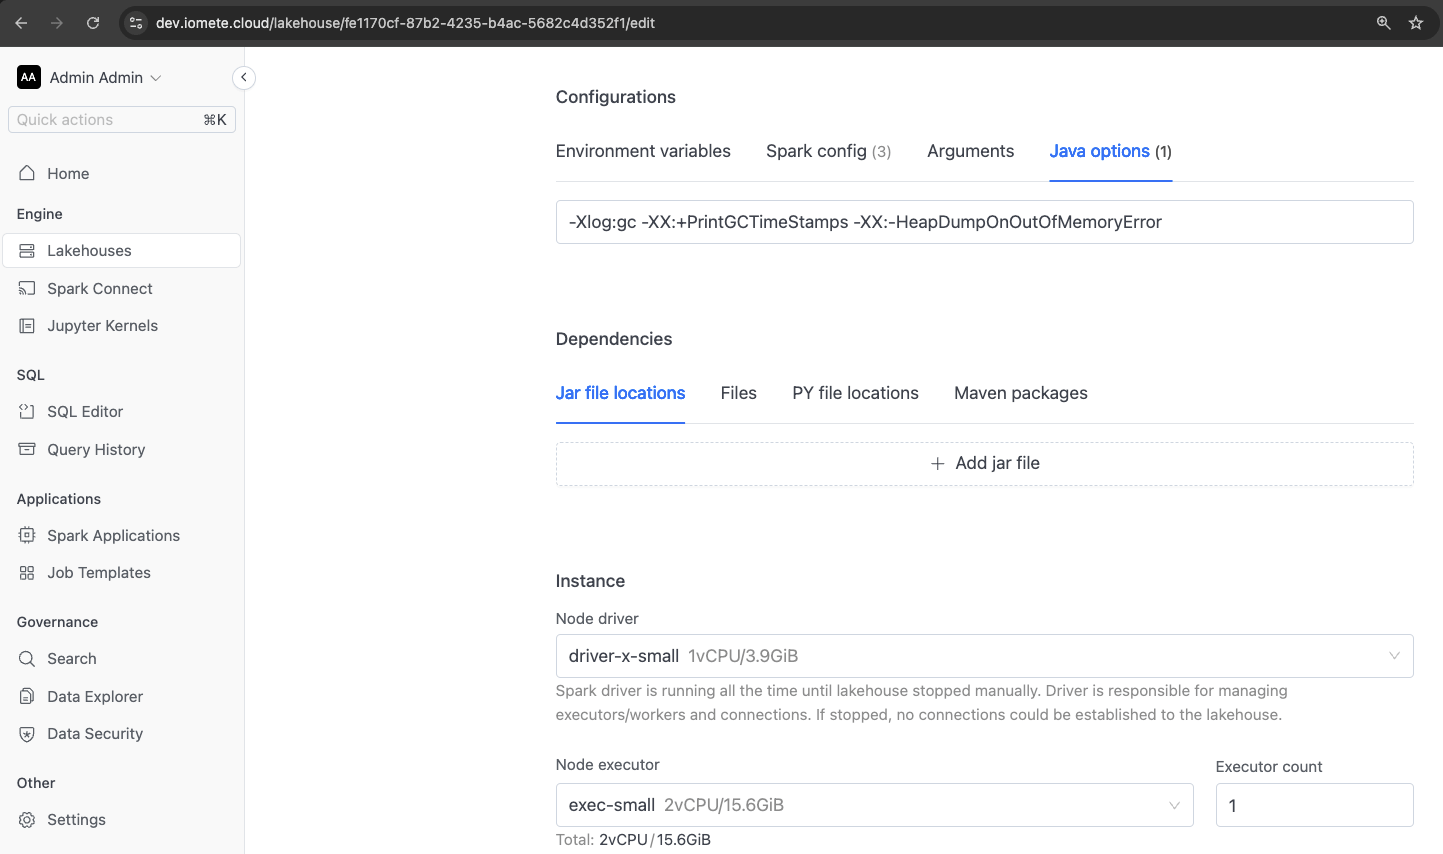
These settings will have the JVM create a file with a memory dump of what data was in the JVM at the time it ran out of memory.
Note that currently, the driver and executor pods are restarted in Kubernetes upon failure. If you choose to store the heap dump on the “host path,” the dump will be lost when the pod is restarted. To ensure the heap dump remains accessible, you should store it on a persistent volume claim (PVC) or tmpfs.