Query Monitoring
Query Monitoring gives you a single view of every SQL query running on your IOMETE compute clusters, no matter where it came from. Queries from the SQL Editor, JDBC drivers, scheduled jobs, and external clients all surface here, complete with execution metrics, the SQL text, and (where enabled) the Spark physical plan.
Use it to spot slow or runaway queries, dig into how Spark planned and executed them, and terminate anything that's still running.
Overview
You'll work with Query Monitoring in one of two contexts, both built on the same interface:
- Per-domain: every domain has its own Query Monitoring page covering queries that ran against that domain's compute clusters.
- Platform-wide (admin): administrators see queries from every domain through the Admin portal.
Each record captures the SQL text and who ran it, the compute cluster and namespace it landed on, timing and resource metrics, and the final status.
Accessing Query Monitoring
Where you find Query Monitoring depends on your role. Domain users open it from inside their domain; administrators reach it through the Admin portal.
As a domain user:
- Open your domain.
- In the left sidebar, expand the Monitoring group.
- Click Query Monitoring.
As a platform administrator:
- Open the Admin portal.
- In the sidebar, click Monitoring.
- On the Monitoring landing page, click the SQL query monitoring card.
Browsing the Query List
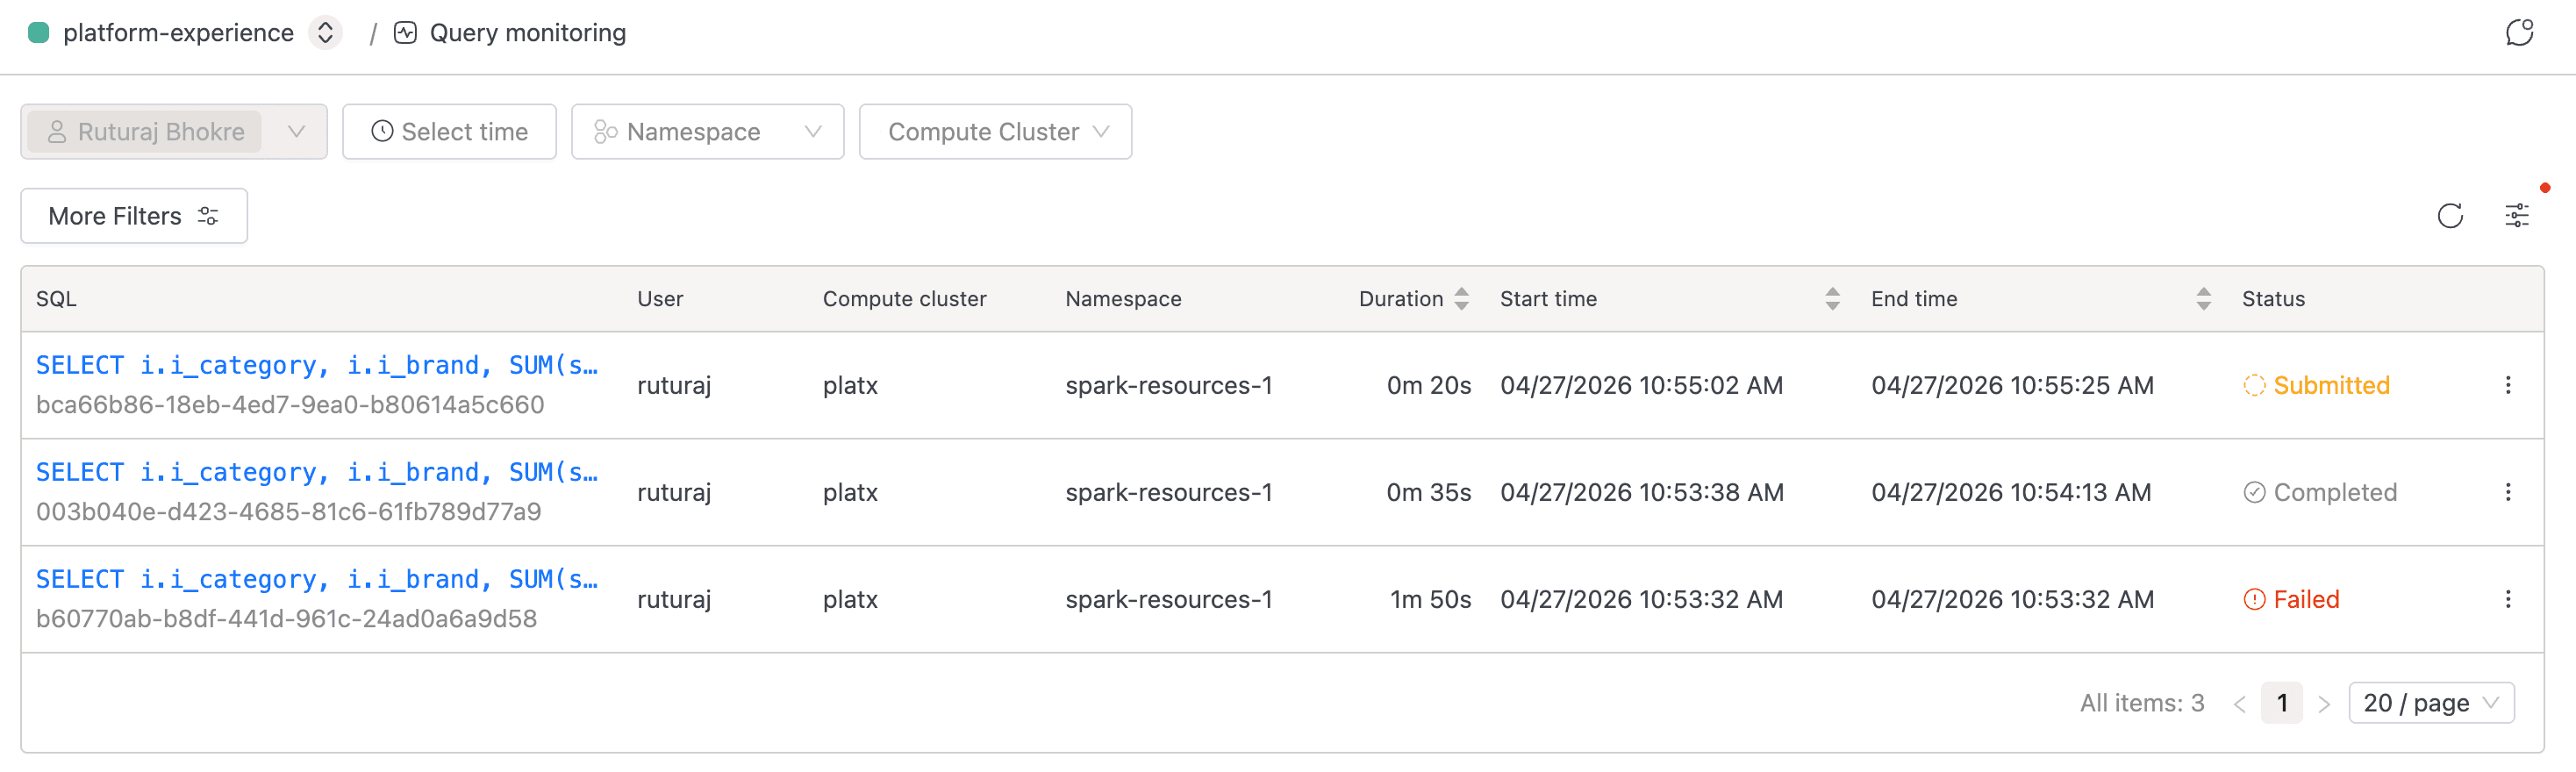
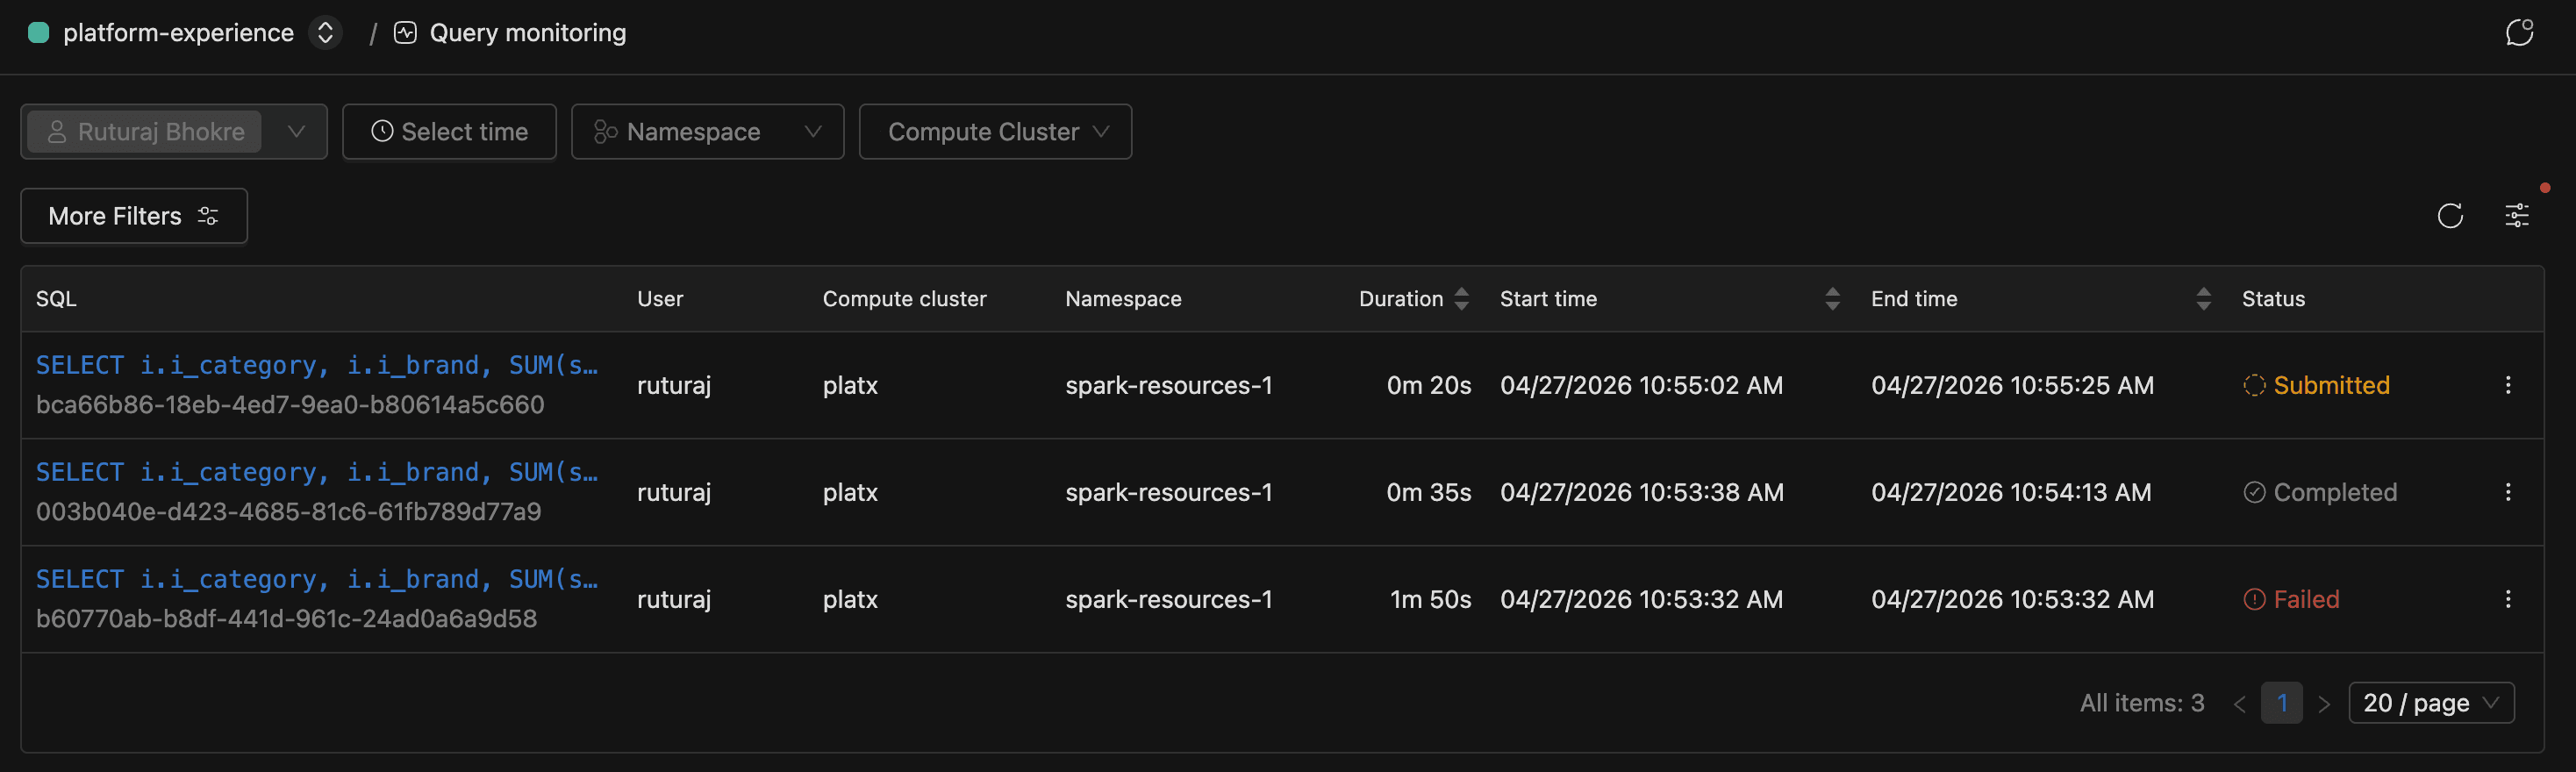
The list is where you start when something looks off. It shows one row per query, with submitted and running queries pinned to the top so anything still in flight stays visible.
Each row carries the truncated SQL alongside the submitter, compute cluster, namespace, timing and memory metrics, and current status. Click any row's SQL cell to open the details page, or click the refresh button in the table header to re-fetch the latest results.
Hover the SQL cell to pop up a panel with the full pre-formatted SQL and a copy button. The full Query ID sits in muted text beneath each SQL entry; hover to reveal a copy icon for sharing.
On first load, the page applies your username to the Users filter automatically, even if you're a domain owner or platform administrator. To see queries from other users, clear or expand the Users filter. Regular domain members can't change this filter and only ever see their own queries.
Filtering Queries
When the list gets dense, use the filter bar at the top to narrow it down. Every filter change updates the URL, so you can bookmark a view or share it with a teammate.


| Filter | Type | Notes |
|---|---|---|
| Users | Multi-select | Defaults to your username. In a domain, only domain owners can pick other users; regular members see their own queries only |
| Time range | Date range | Pick a relative range (last hour, last day, and so on) or an absolute window |
| Namespace | Single-select | Filters to queries that ran in a specific Kubernetes namespace |
| Domain | Single-select | Admin context only. Pick a domain to scope the list. Changing the domain clears the Compute Cluster selection |
| Compute Cluster | Multi-select | Filters to queries that ran on specific clusters. In the admin context, it stays disabled until you choose a Domain; the tooltip reads "Select domain first." |
Changing any filter resets pagination back to page 1.
Using More Filters
For anything beyond the basic bar, click More Filters to open a popover with extra predicates. Each filter you apply appears as a removable tag between the More Filters button and the table. Click a tag to edit it, or click the x to remove it.


| Filter | Input | Behavior |
|---|---|---|
| Status | Checkboxes for Running, Completed, Cancelled, Failed, Unreachable, Submitted | Multi-select. The Apply button is disabled until your selection differs from what's already in the URL |
| SQL Text | Text area | Case-insensitive partial match against the query's SQL |
| Query ID | Text input | Exact match on the query identifier |
| Duration | Number + unit (Seconds / Minutes / Hours) | Matches queries whose total wall-clock duration is greater than the specified value |
| Total Memory | Number + unit (MB / GB / TB) | Matches queries whose cumulative memory usage is greater than the specified value |
| Total Task Time | Number + unit (Seconds / Minutes / Hours) | Matches queries whose total task time is greater than the specified value |
Understanding Query Statuses
The status column tells you at a glance whether a query is still doing work, already finished, or in trouble. Here's what each one means.
| Status | Meaning |
|---|---|
| Submitted | The query has been received but hasn't started executing yet. Eligible for Terminate |
| Running | The query is executing. Eligible for Terminate |
| Completed | The query finished successfully |
| Cancelled | The query was cancelled. The detail page records who cancelled it |
| Failed | The query failed. The detail page shows the error message |
| Unreachable | The query had no progress update for longer than the configured stale-check window. The platform marks it Unreachable automatically |
Records stick around for 7 days by default before they roll off the live table. If legitimate long-running queries keep getting flagged Unreachable, ask your platform administrator to tune the stale-check window.
Viewing Query Details
When a query in the list looks suspicious, the detail page is where you go to find out what actually happened. Click any row's SQL cell to open it. The page is organized into tabs.
| Tab | Always visible? | What it shows |
|---|---|---|
| Details | Yes (default) | Performance metrics, shuffle metrics, and general query info |
| SQL | Yes | The full, formatted SQL text |
| Plan | Where enabled | The Spark physical plan as an interactive graph |
The active tab is captured in the ?tab= URL parameter, so you can deep-link straight to a specific view.
Details Tab
The Details tab opens with the query's status, ID, and session ID across the top. Failed queries show a Failure Reason alongside, and cancelled ones show Cancelled By with the user who issued the cancel.
Below the header, you'll find performance and runtime metrics like duration, CPU time, memory usage, task counts, disk spill, input bytes, submission and end times, and a Spark URL link into the Spark UI. If the query produced shuffle activity, a Shuffle Metrics section appears with read/write byte and record counts. Hover the info-circle next to any metric label for a one-line description of what it measures.
SQL Tab
The SQL tab renders the query text in a read-only viewer with syntax highlighting. SQL is auto-formatted with uppercase keywords for readability.
Plan Tab
The Plan tab is where you go to figure out why a query was slow. It renders the Spark physical plan as an interactive top-to-bottom graph, and it's available wherever your deployment has it enabled.
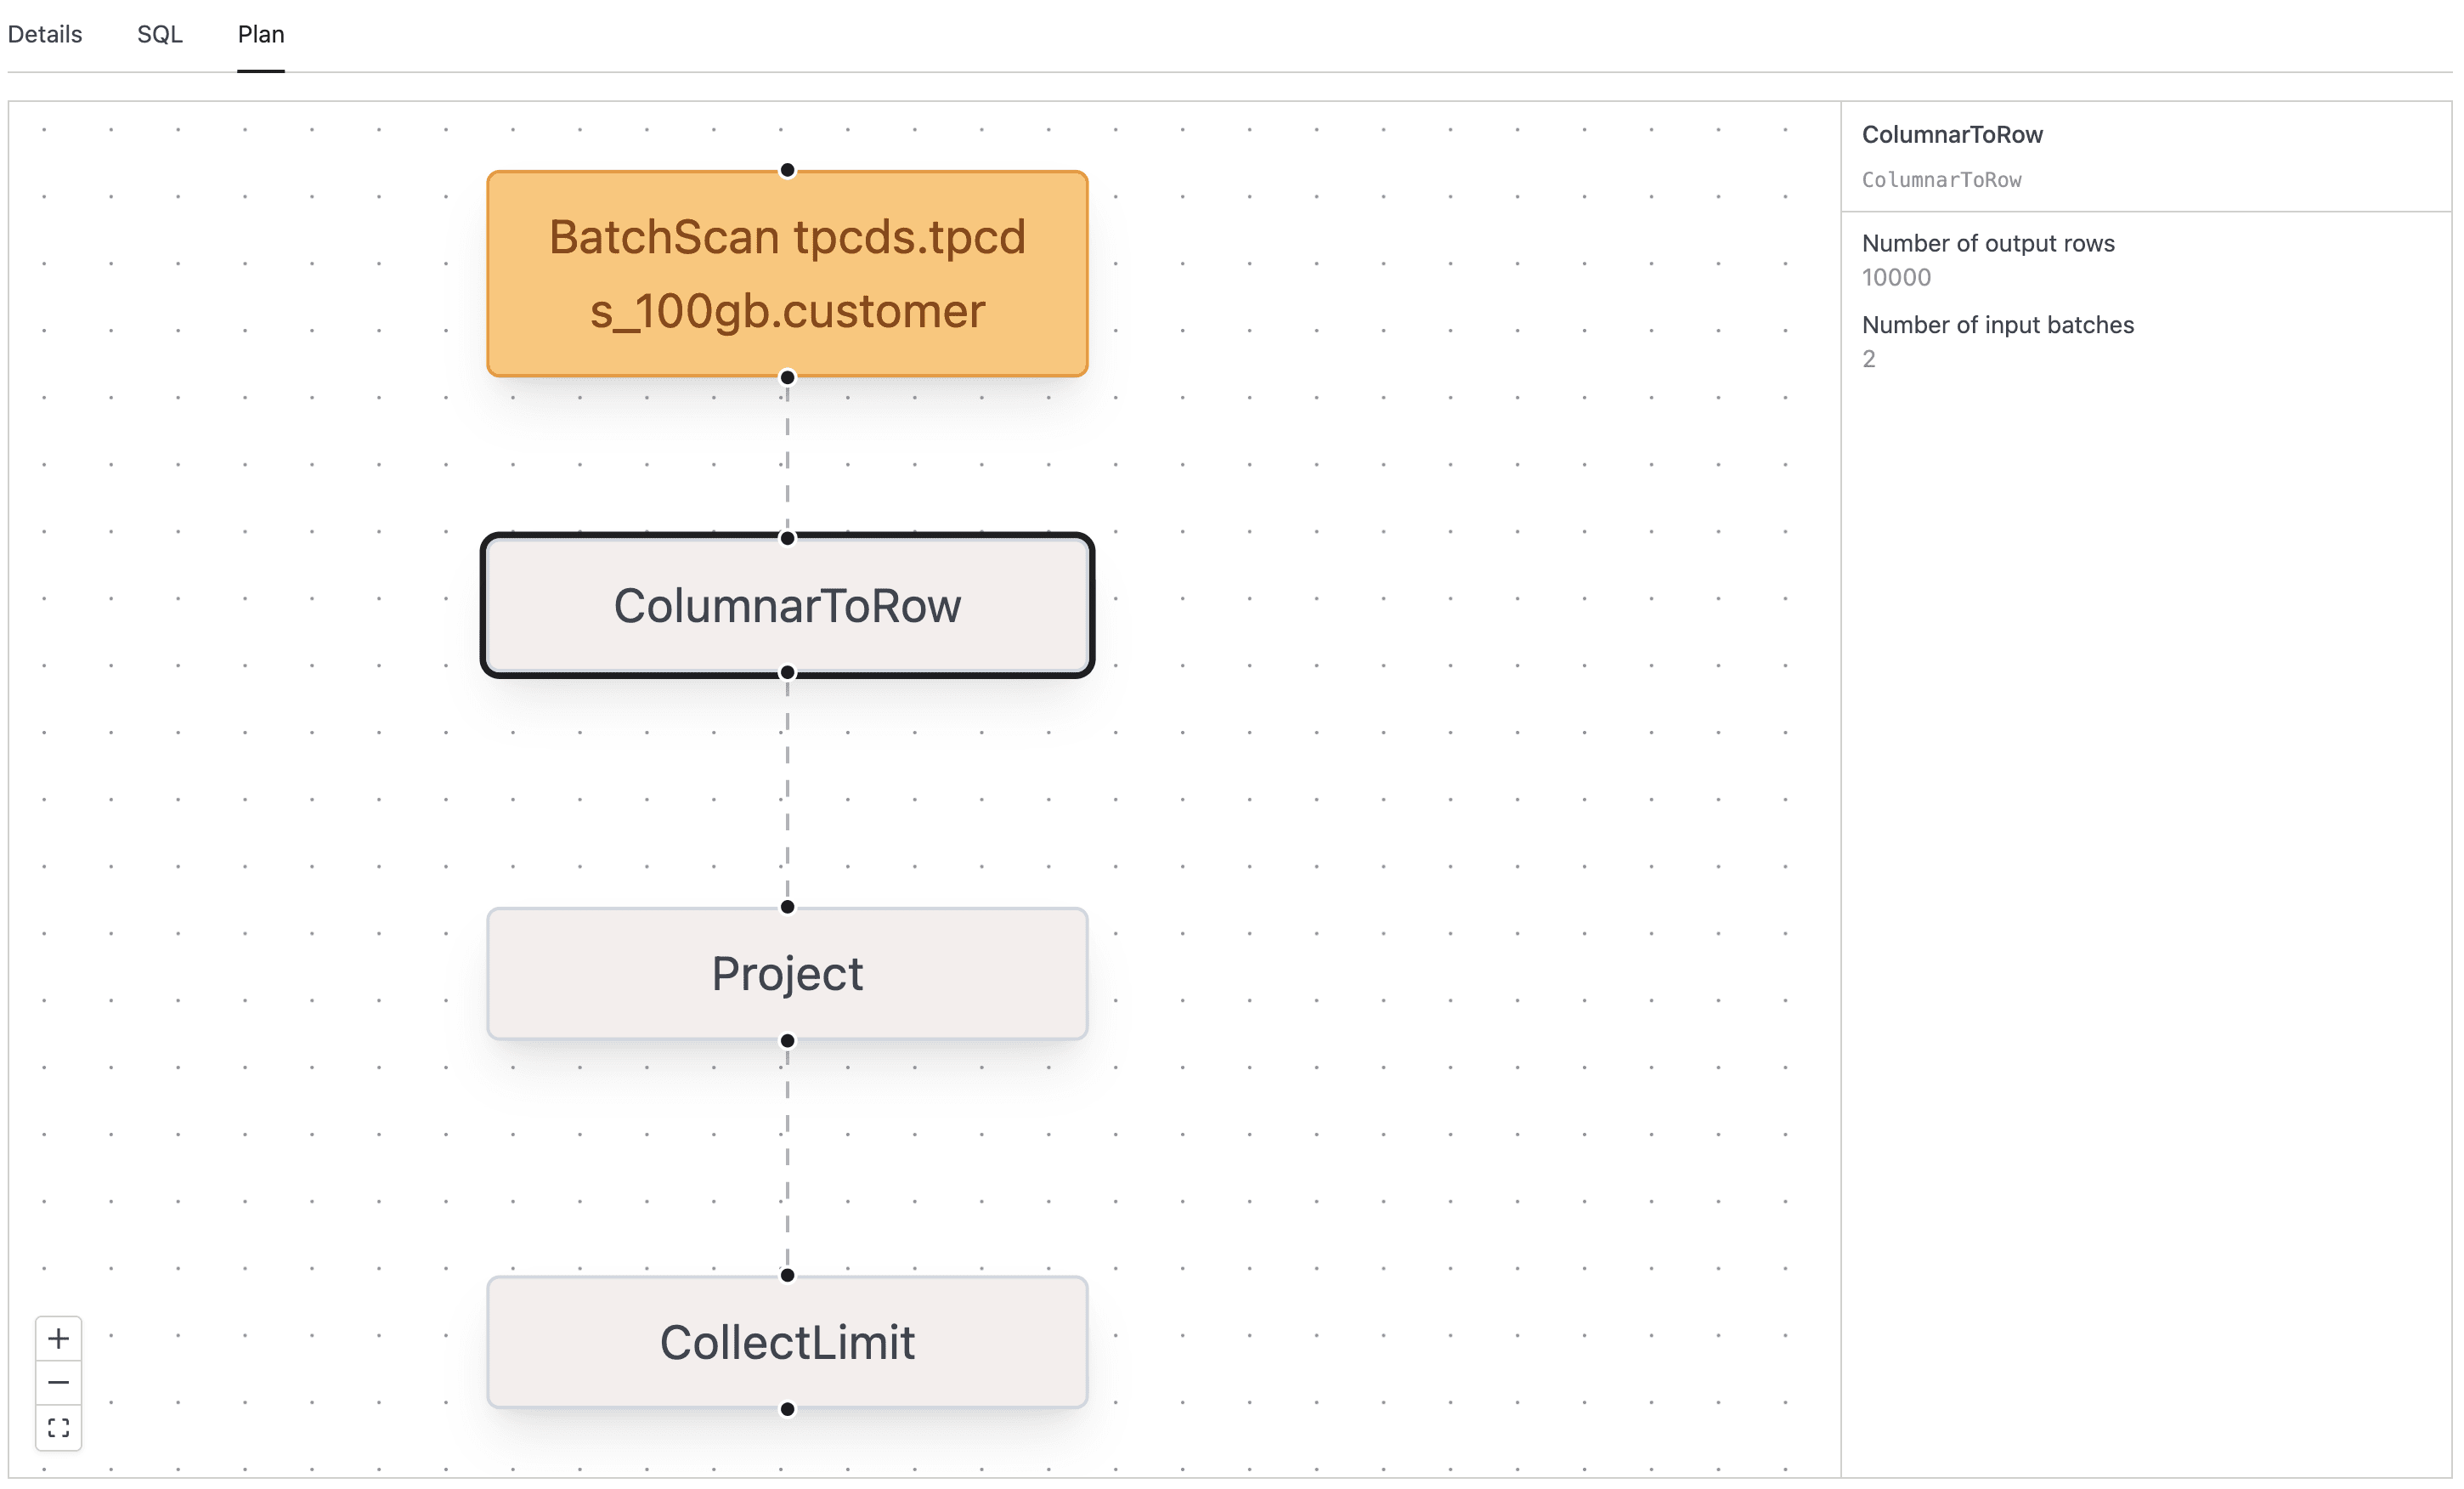
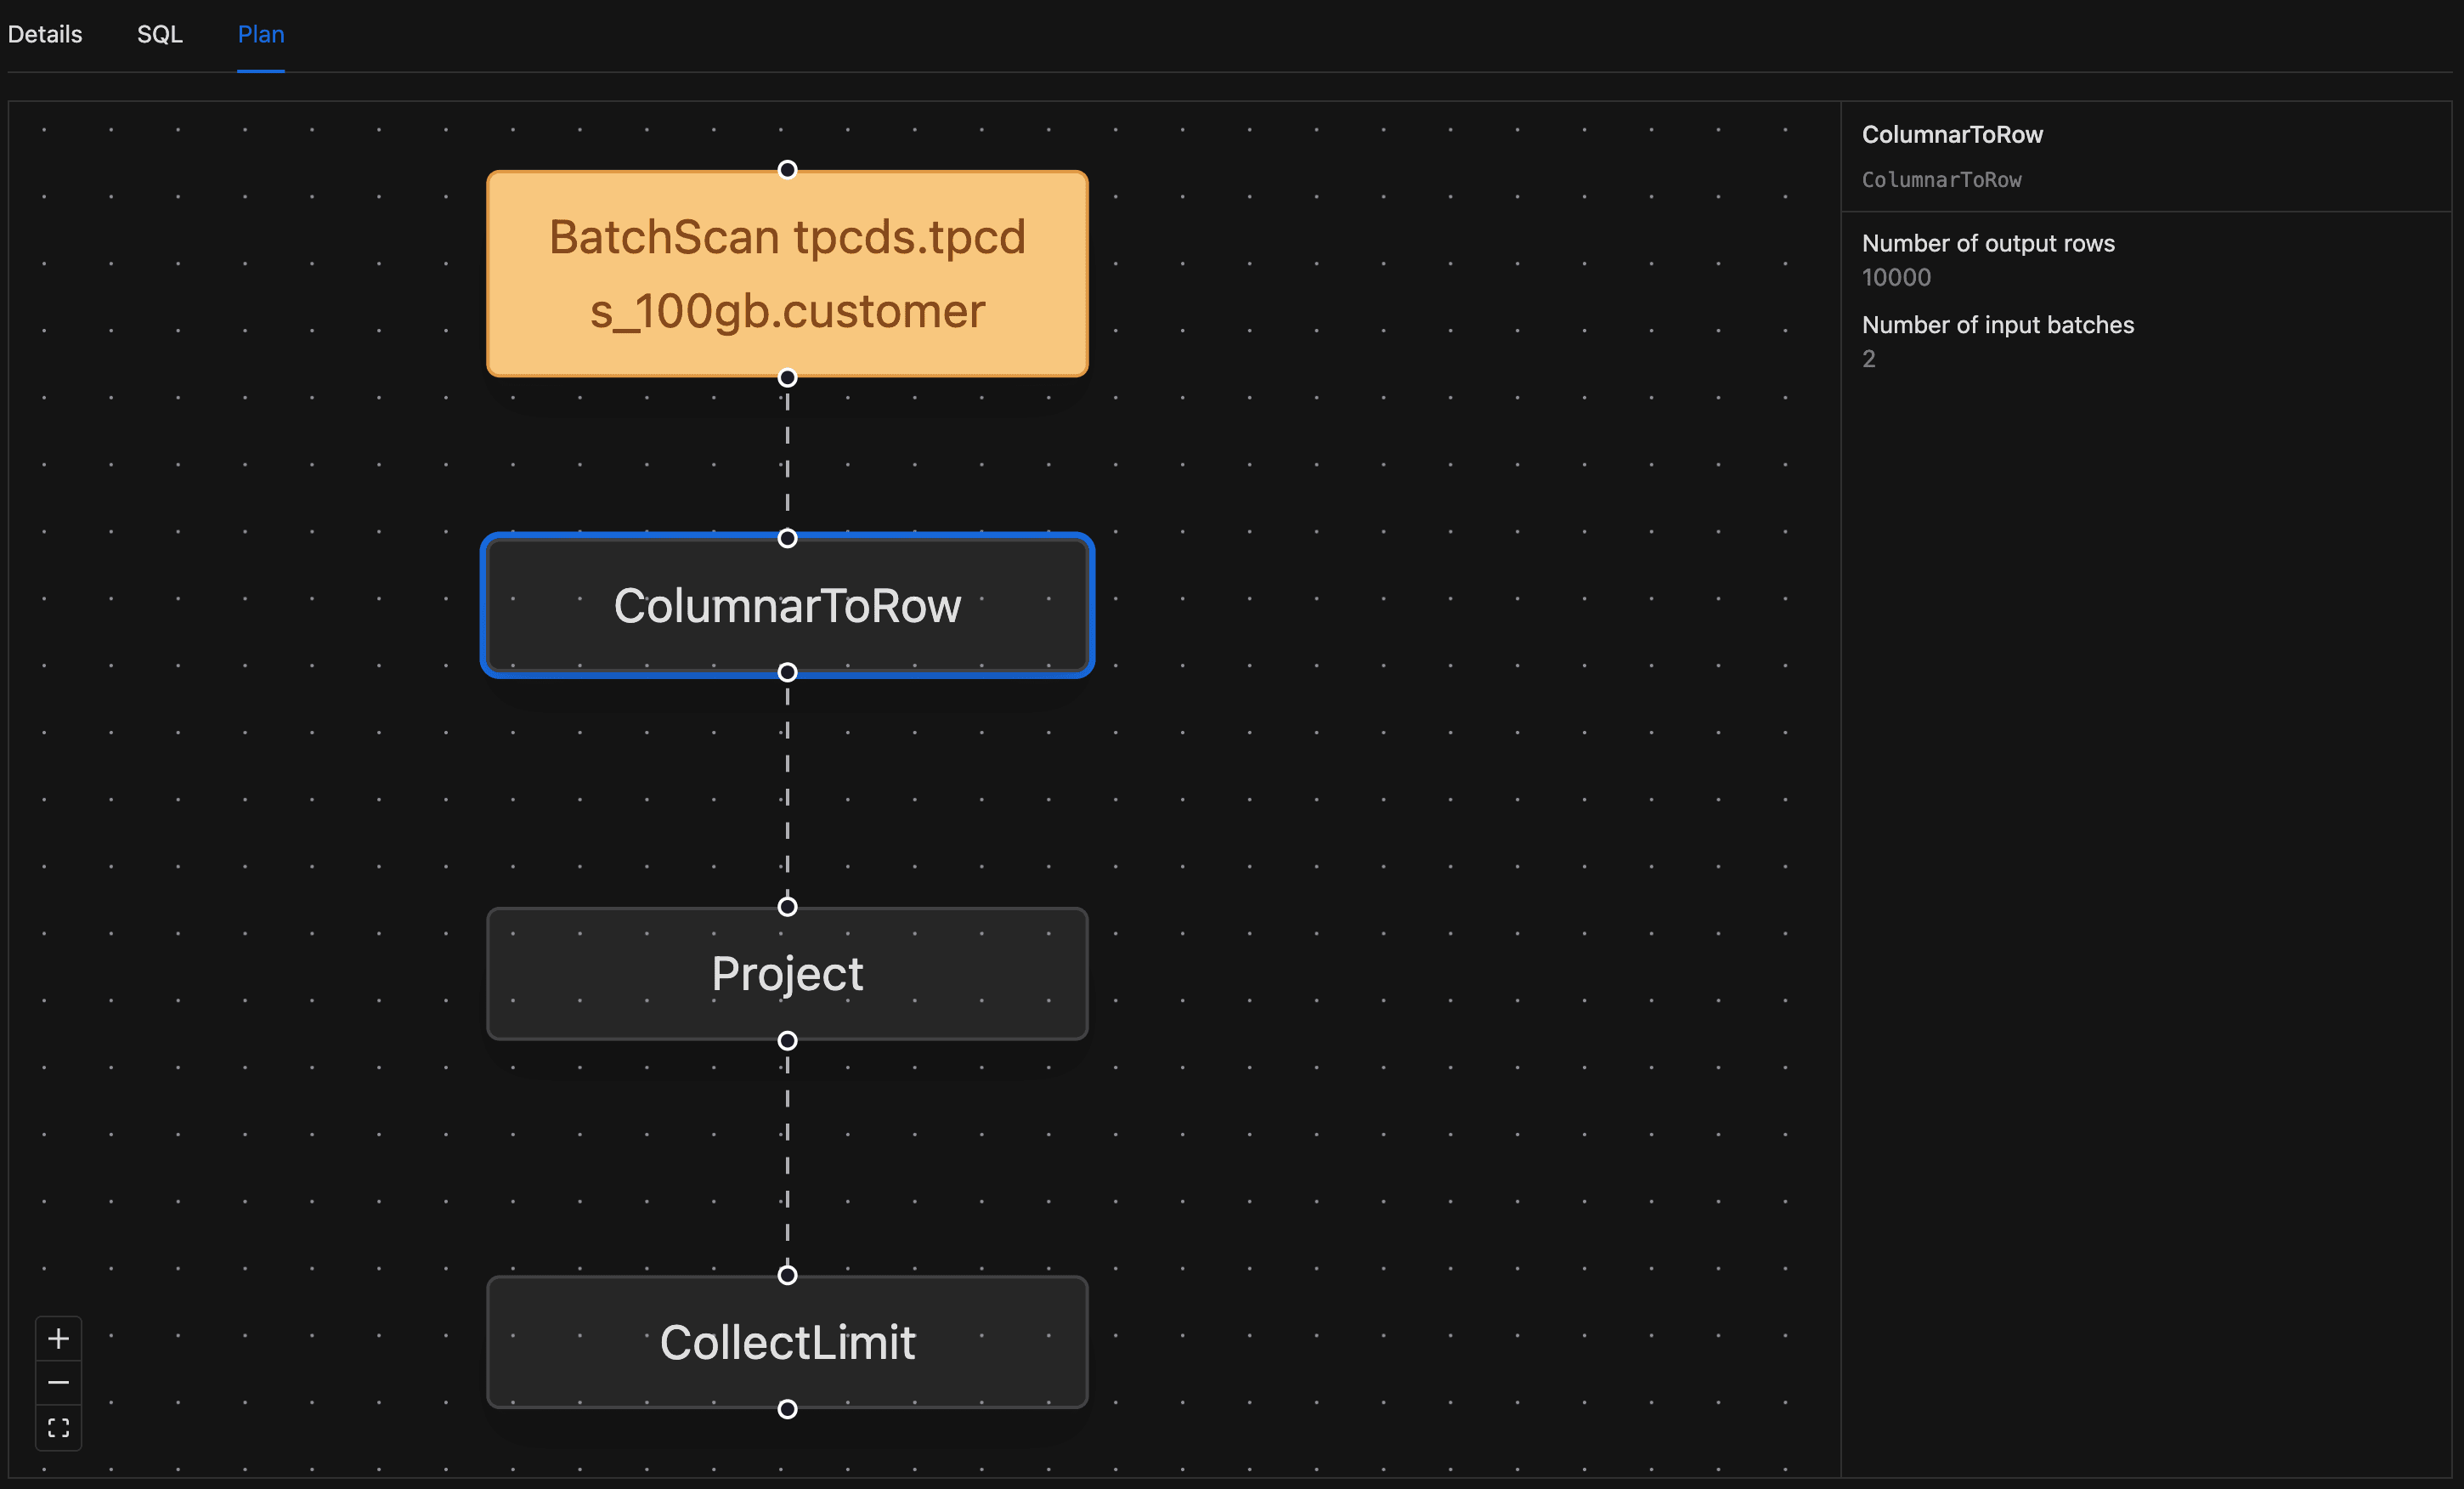
- Open the query detail page and switch to the Plan tab.
- The graph renders with one node per Spark plan operator. Pan by click-and-drag, zoom with the scroll wheel, or use the zoom and fit-view buttons in the lower-left corner.
- Nodes are color-coded by operator type:
- Filter operators use a blue surface.
- BroadcastExchange operators use a green surface.
- BatchScan operators use an orange surface.
- All other operators use a neutral fill.
- Click any node to open a side panel with the operator's name, description, and metrics. Each metric is rendered with its appropriate unit (
msfor timing,bytesfor size). - Click the same node again to close the side panel.
Terminating a Running Query
When a query is hogging cluster resources or making no progress, you can cancel it as long as it's still in the Submitted or Running state. Every cancellation lands in the query record, so there's a clear audit trail of who cancelled what.


- Find the query in the list and confirm its status is Running or Submitted. The Terminate option doesn't appear for any other status.
- Click the three-dot menu in the row's actions column.
- Click Terminate.
- In the confirmation popover, click Yes, terminate it.
If the cancellation succeeds, a toast reads "Query cancelled successfully" and the list refreshes. The query's status moves to Cancelled, and your username is recorded in the Cancelled By field on the detail page.
Terminating a query stops Spark execution mid-stream. Any partial work the query had done is discarded; there is no resume.
The same row action menu also has a Spark UI link that opens the Spark UI for the query in a new tab. It's enabled only while the query's compute cluster is active.
Regular domain members can cancel only their own queries; domain owners and platform admins can cancel any query in their scope.