Health Check
Health Check is the admin-portal page that shows the live status of every IOMETE control-plane service in your data plane. When something looks wrong, it's the fastest way to confirm whether the problem is a known control-plane issue, check uptime trends over the last 48 hours, or correlate failures with specific timestamps from broken jobs and queries.
A probe service hits each endpoint every 10 seconds and keeps 48 hours of results, aggregated into 1-hour bars. Each service renders as a card with a status badge, a 48-bar timeline, and an uptime percentage.
Opening the Health Check Page
You can reach Health Check two ways from the admin portal. Both land on the same page, so pick whichever fits your workflow.
From Settings
- Sign in with an admin account and open the admin portal.
- In the left sidebar, scroll to the Other group and click Settings.
- In the Settings inner sidebar, click Health Check.
From the Monitoring Tab
- Sign in with an admin account and open the admin portal.
- In the left sidebar, click Monitoring.
- On the Monitoring page, click the Control-Plane health card.
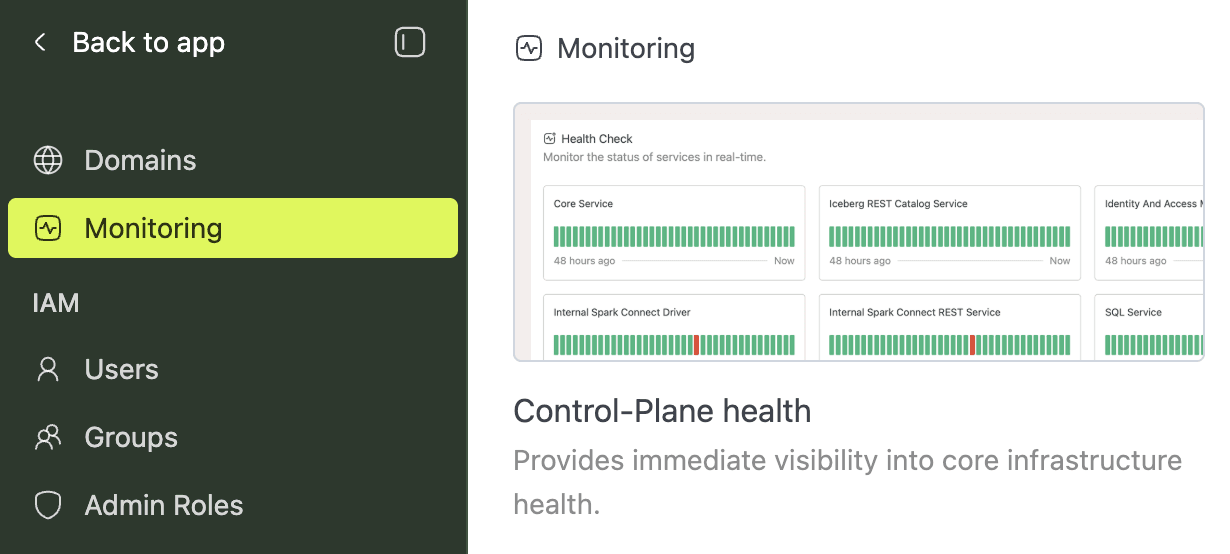
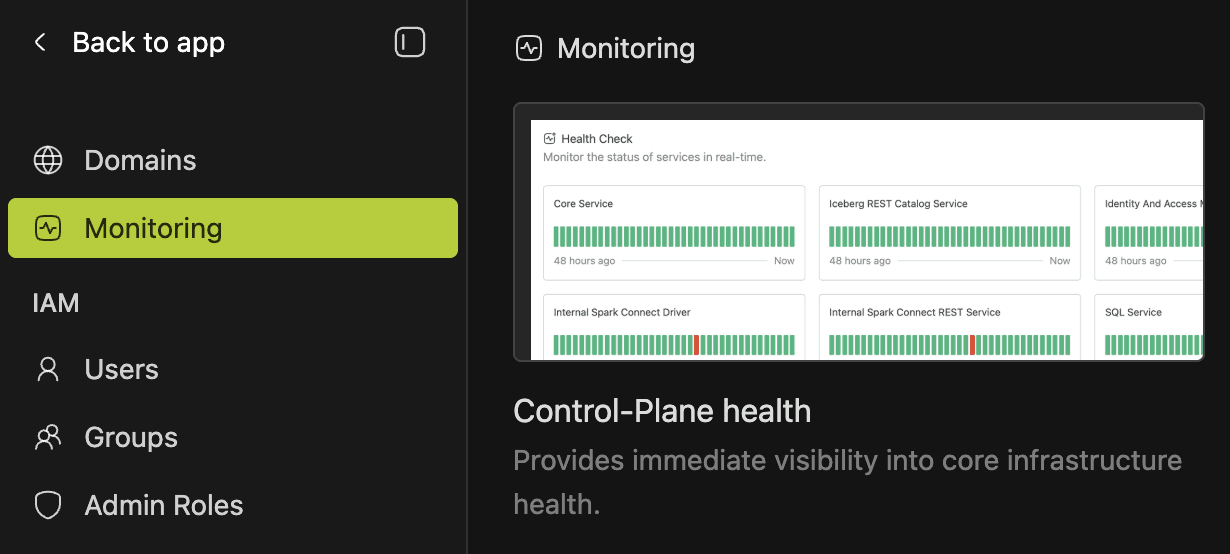
Either path opens the Health Check page.
Reading the Page
Once the page is open, you see a toolbar at the top and a grid of service cards below. Knowing what each region tells you saves time when you're triaging an incident.
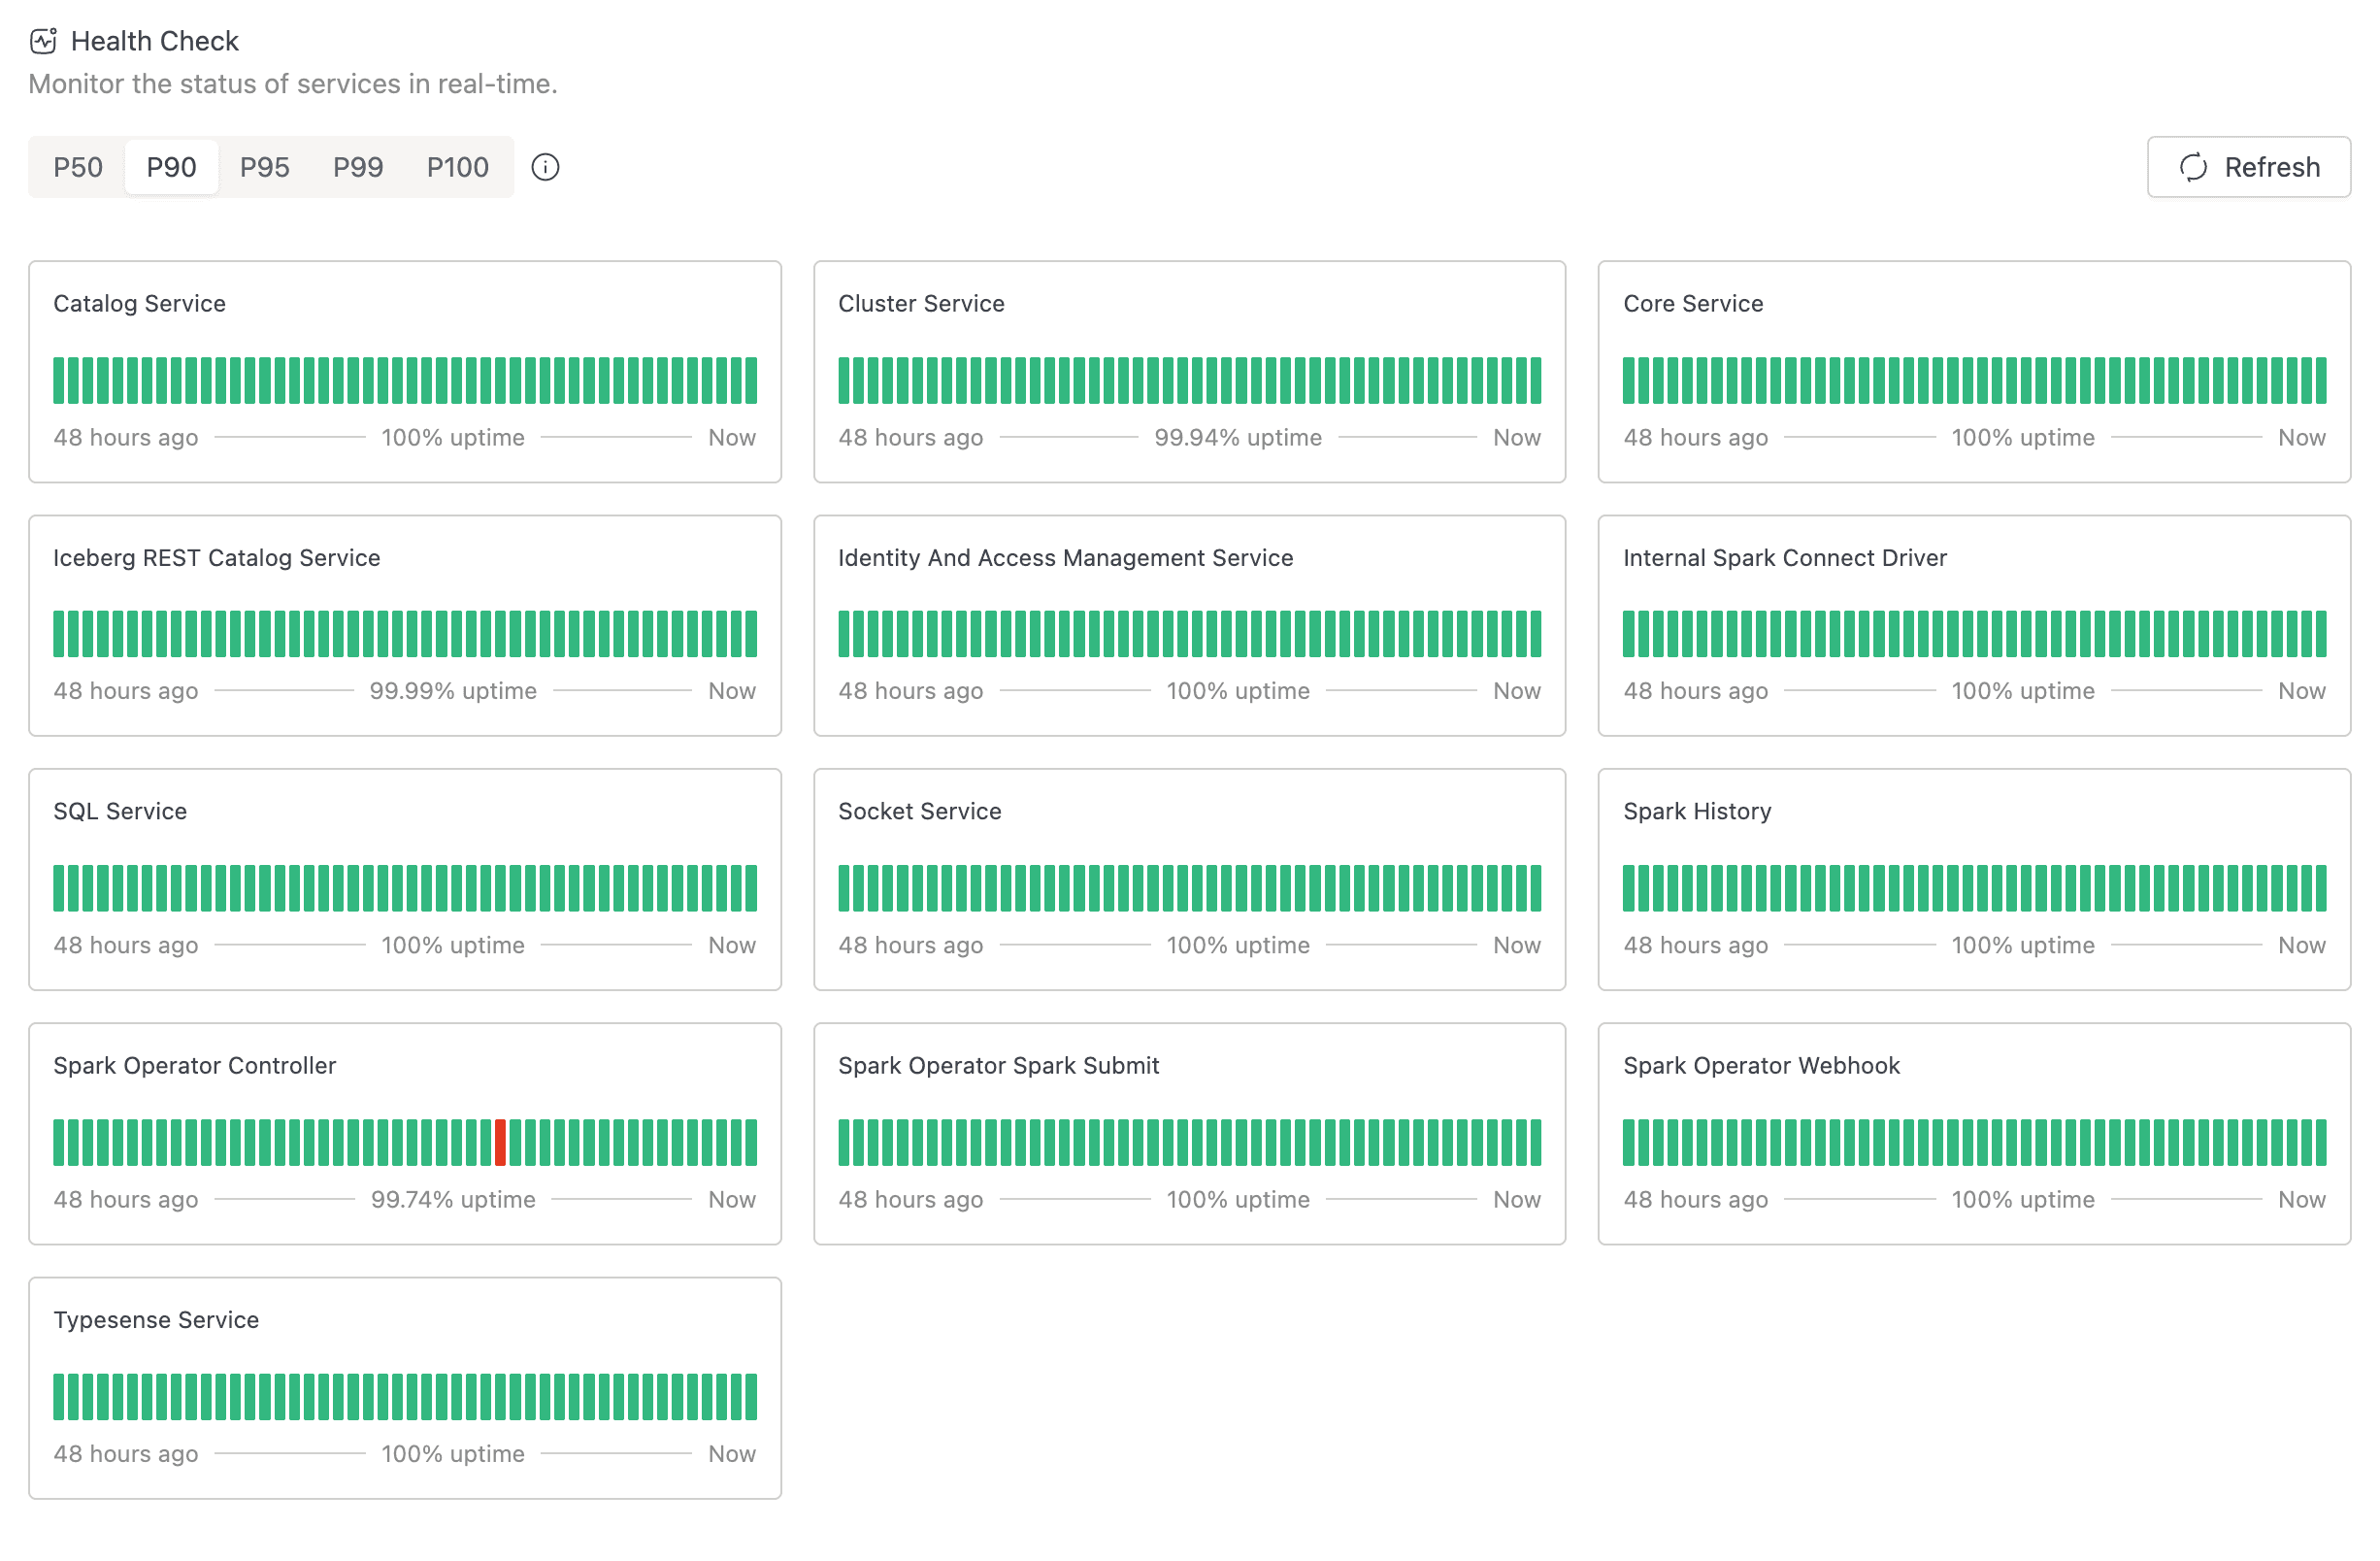
Toolbar
The toolbar runs across the top of the page and contains:
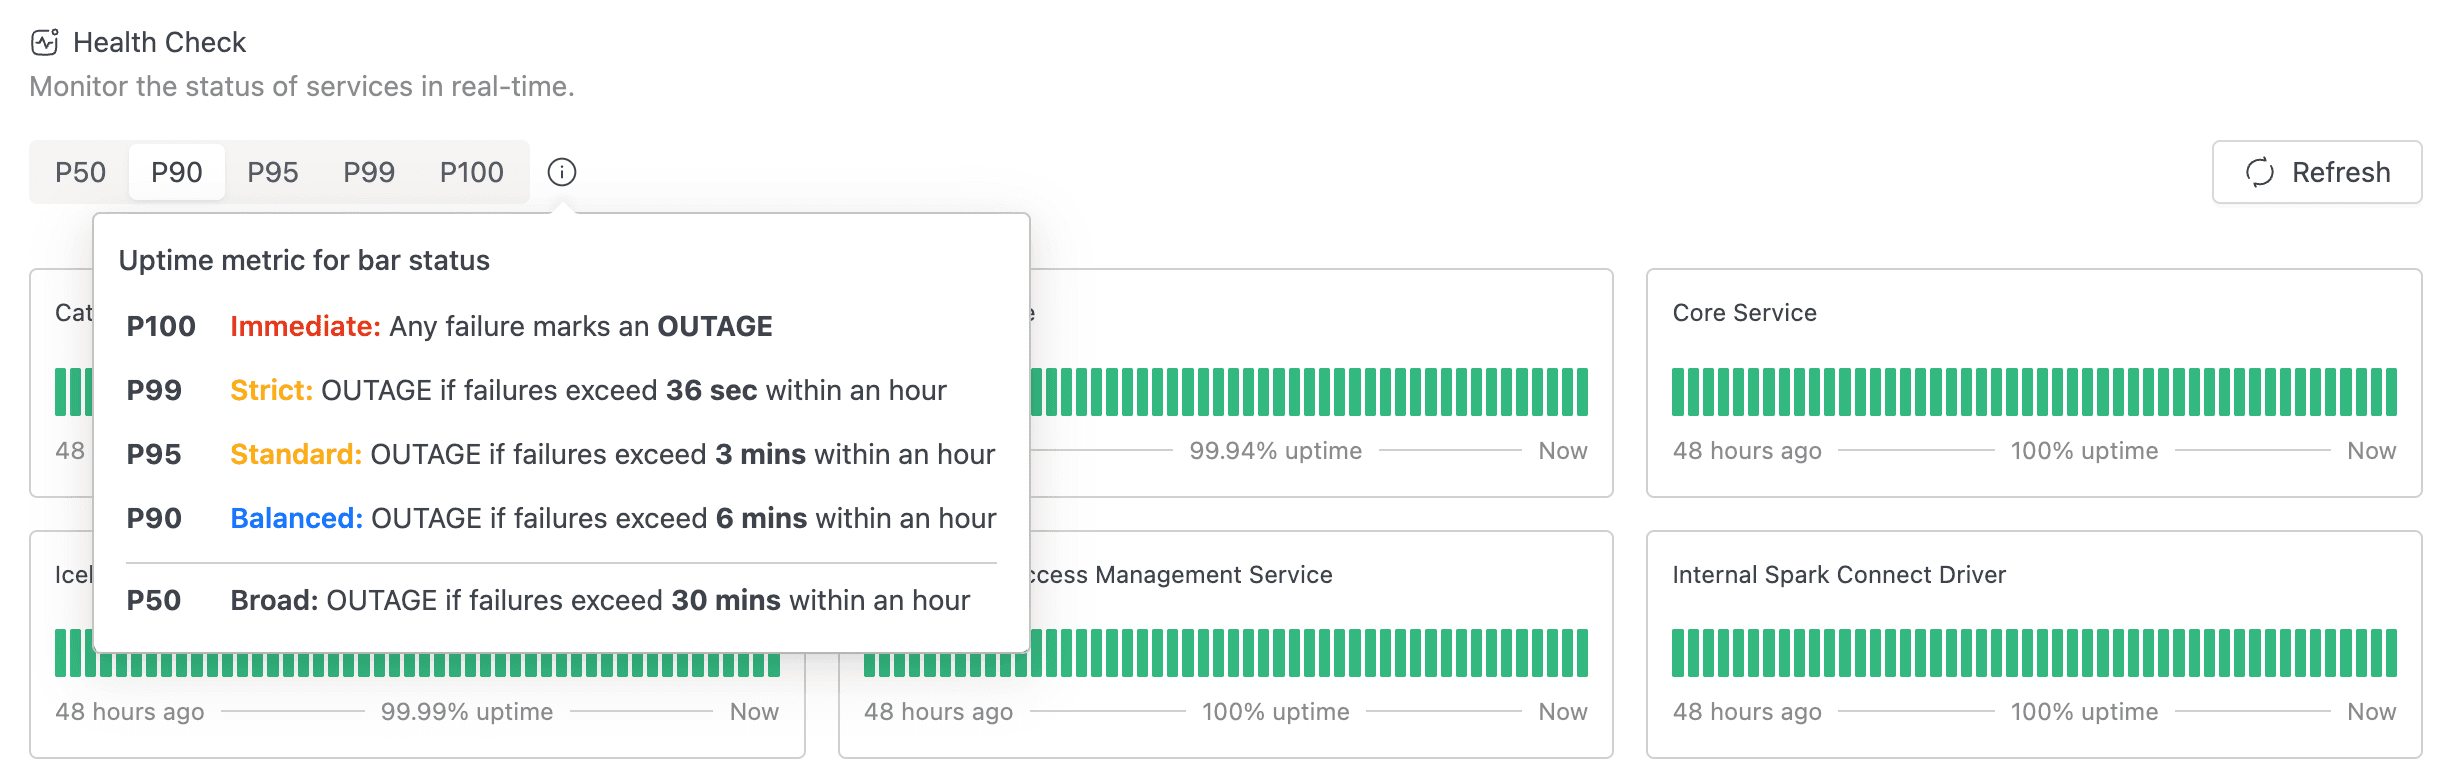
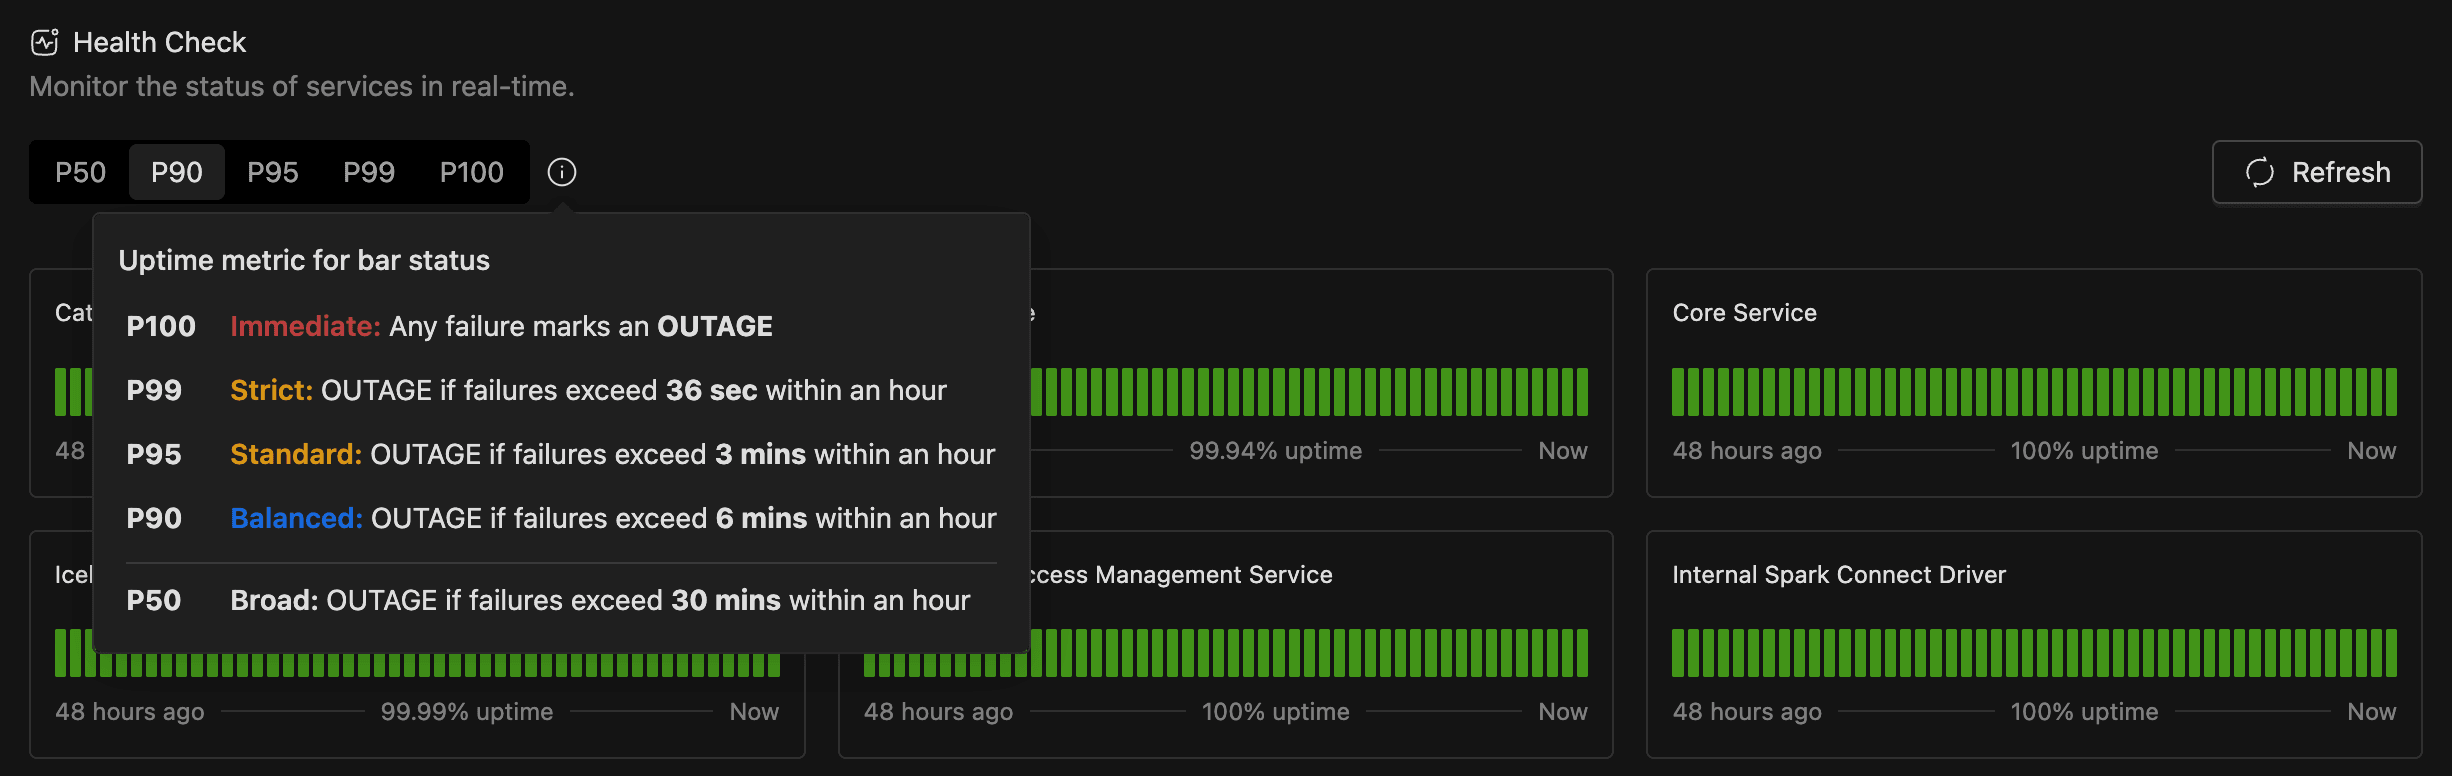
- A segmented control with the labels P50, P90, P95, P99, and P100. This is the uptime metric selector (see Choosing an Uptime Metric below).
- A small information icon next to the segmented control. Hover it for a popover titled Uptime metric for bar status that explains each metric.
- A Refresh button on the right. Click it to fetch the latest data immediately. While a fetch is in flight, the button shows a loading spinner and is disabled.
Service Cards
The grid below the toolbar shows one card per service. Each card has the service name, a status badge, a 48-bar timeline, and a footer with the start of the window, the uptime percentage, and Now.


Status Timeline
The timeline runs left to right with one coloured bar per 1-hour window over the last 48 hours. The right-most bar is the current hour. Hover any bar for a popover with:
- Period: the bar's time range, formatted
DD MMM HH:mm - HH:mm. - Status: Operational or Outage for that hour.
If a service has fewer than 48 hours of history, the timeline is left-padded with grey bars. Grey means "no data yet," not a problem.
Status Meanings
Every service and every bar is in one of two states. The icon and colour are the same on the service-level badge and on each timeline bar.
| Status | Icon | Colour | What it means |
|---|---|---|---|
| Operational | Filled circle | Green | The service is responding healthily. |
| Outage | Alert circle | Red | The service is failing health checks beyond the threshold for the selected metric. |
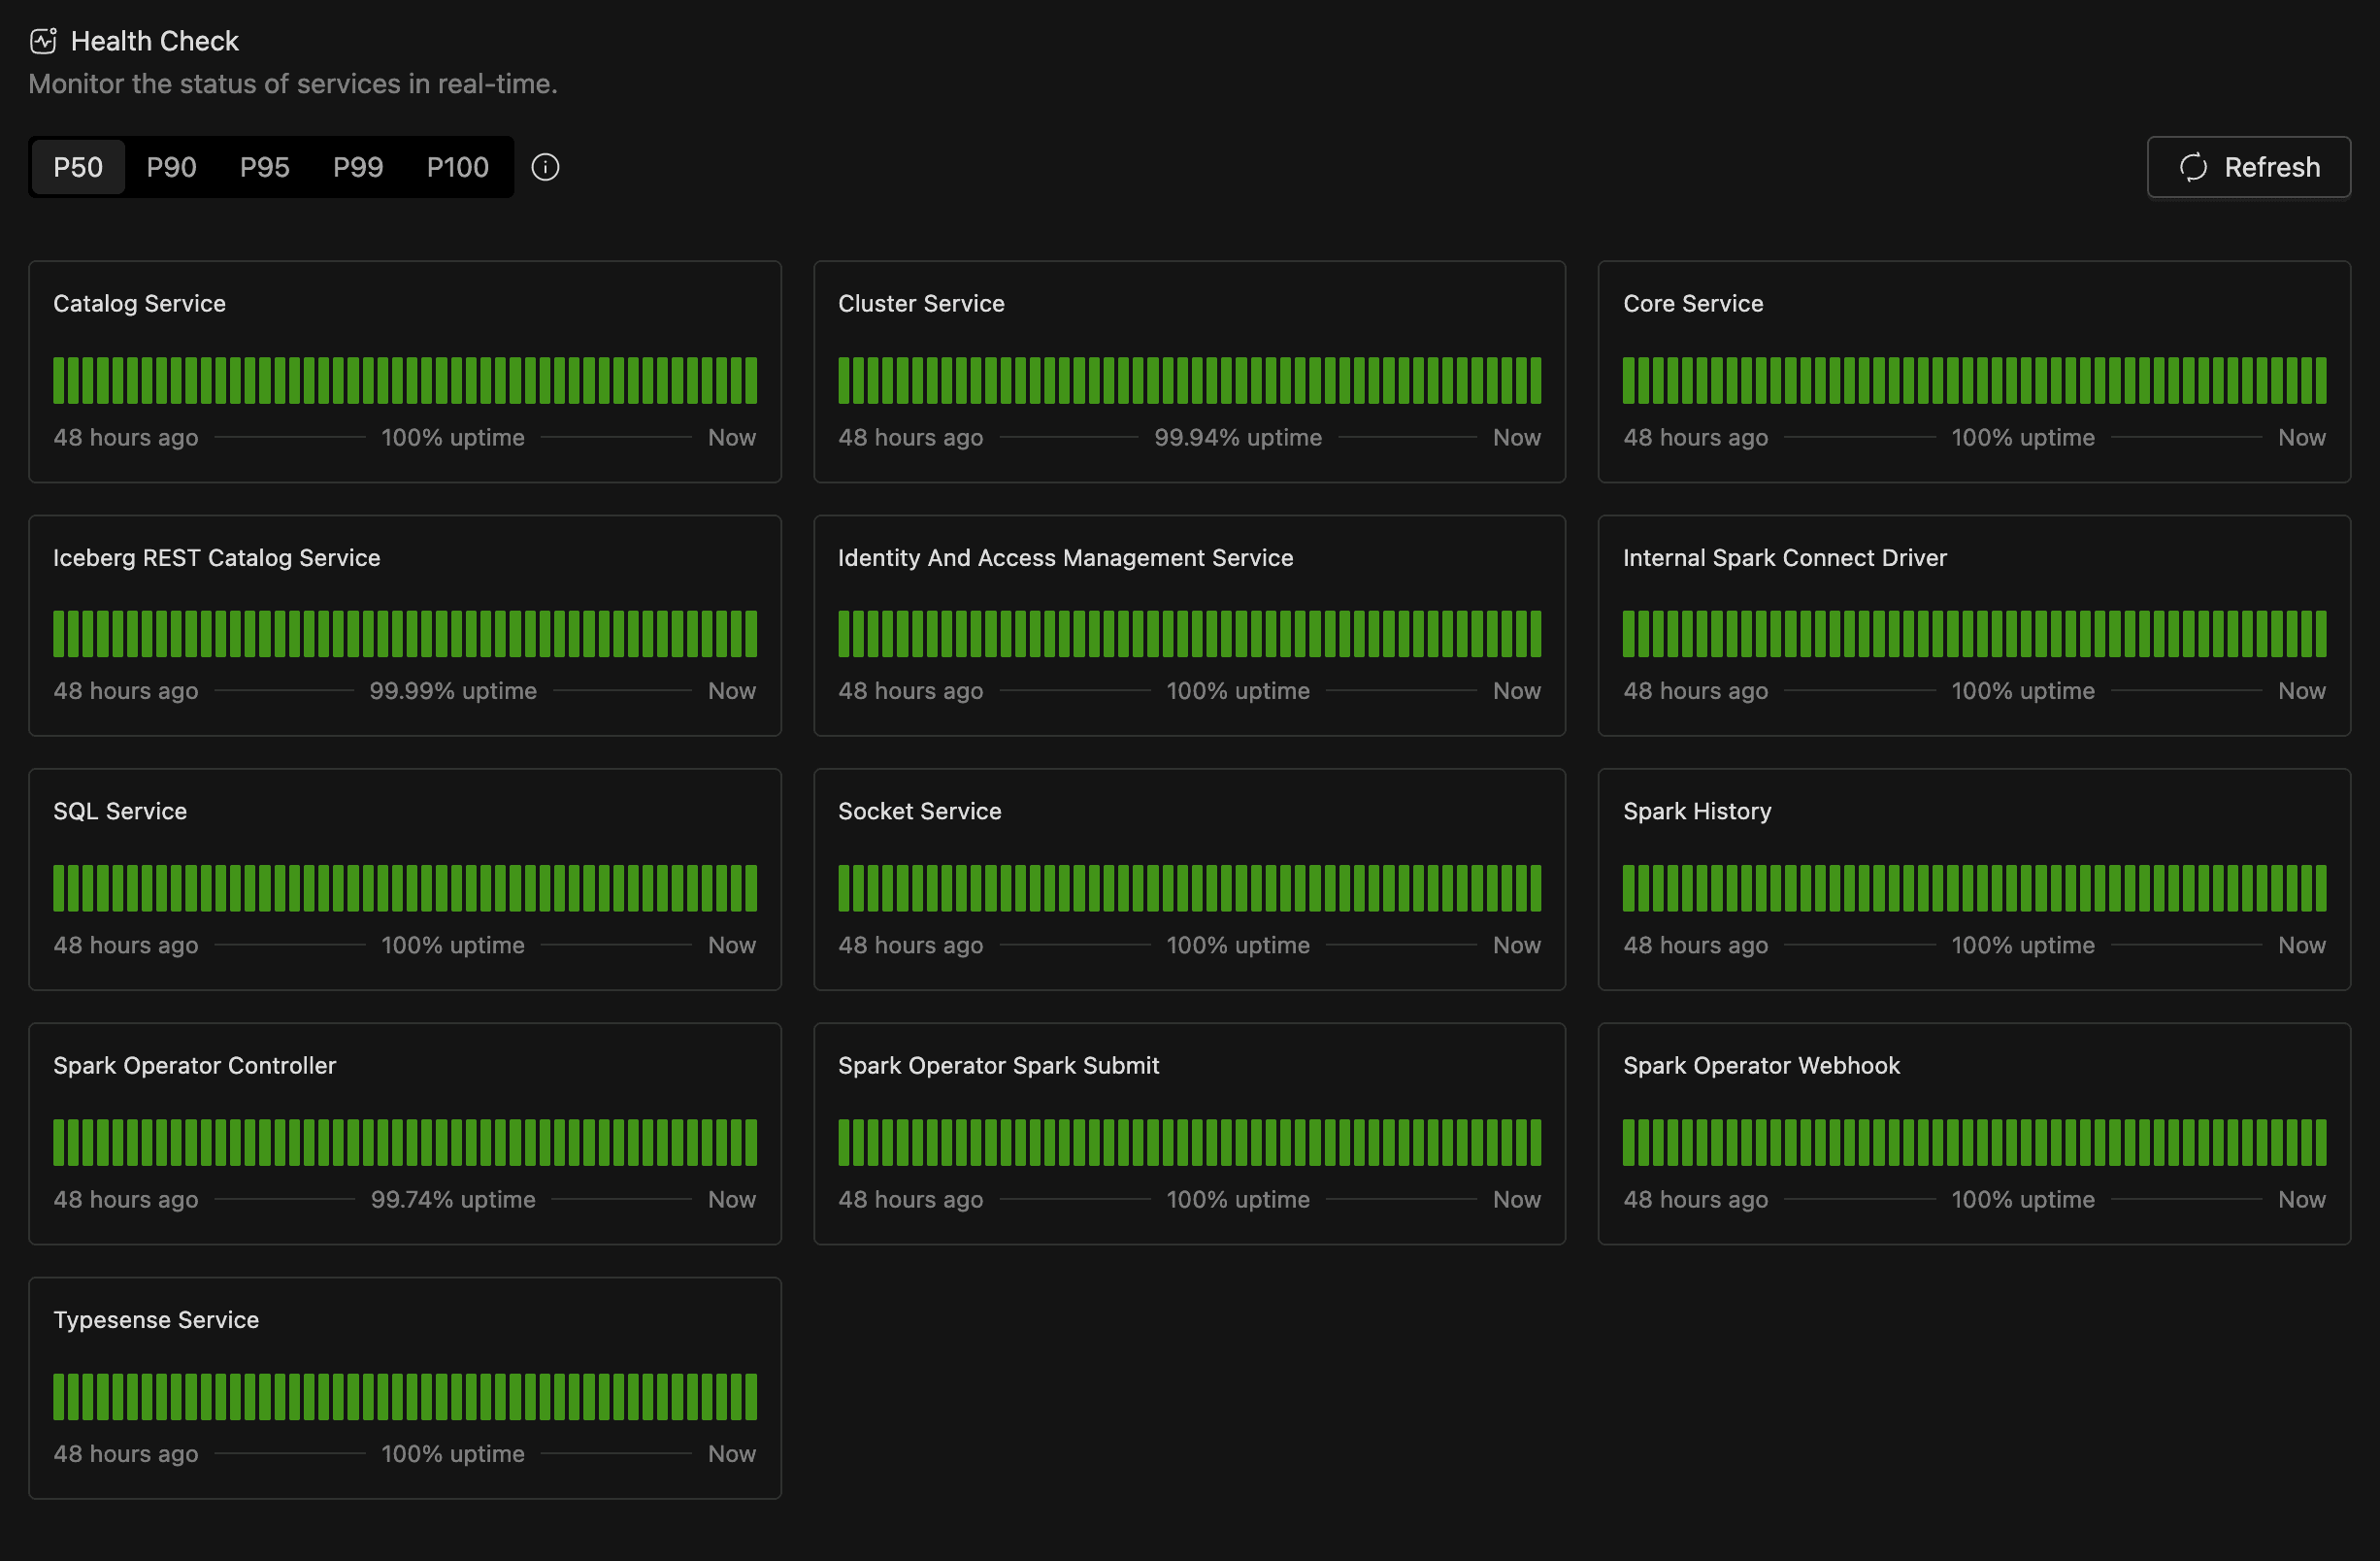
Choosing an Uptime Metric
The segmented control at the top of the page sets how strictly a 1-hour window has to fail before its bar turns red. The metric only affects bar colouring; the underlying probe data is the same regardless of which one you pick.
| Metric | Threshold |
|---|---|
| P100 | Immediate. Any failure marks an OUTAGE. |
| P99 | Strict. OUTAGE if failures exceed 36 sec within an hour. |
| P95 | Standard. OUTAGE if failures exceed 3 mins within an hour. |
| P90 | Balanced. OUTAGE if failures exceed 6 mins within an hour. |
| P50 | Broad. OUTAGE if failures exceed 30 mins within an hour. |
The default is P90.
Use P100 to see every individual probe failure as red, which is useful for catching transient blips. Use P50 to see only sustained outages. The current selection is mirrored to the URL query string (for example, ?metric=P95), so links to the Health Check page are shareable and preserve the strictness you chose.
Troubleshooting
The Health Check page doesn't expose individual probe logs, so for deeper investigation, inspect the affected IOMETE service pod directly with your usual Kubernetes tooling.
If the Health Check page itself fails to load while other admin pages work normally, the iom-health-check deployment is unhealthy. Check the pod status and the deployment's own Kubernetes liveness and readiness probes.