Monitoring
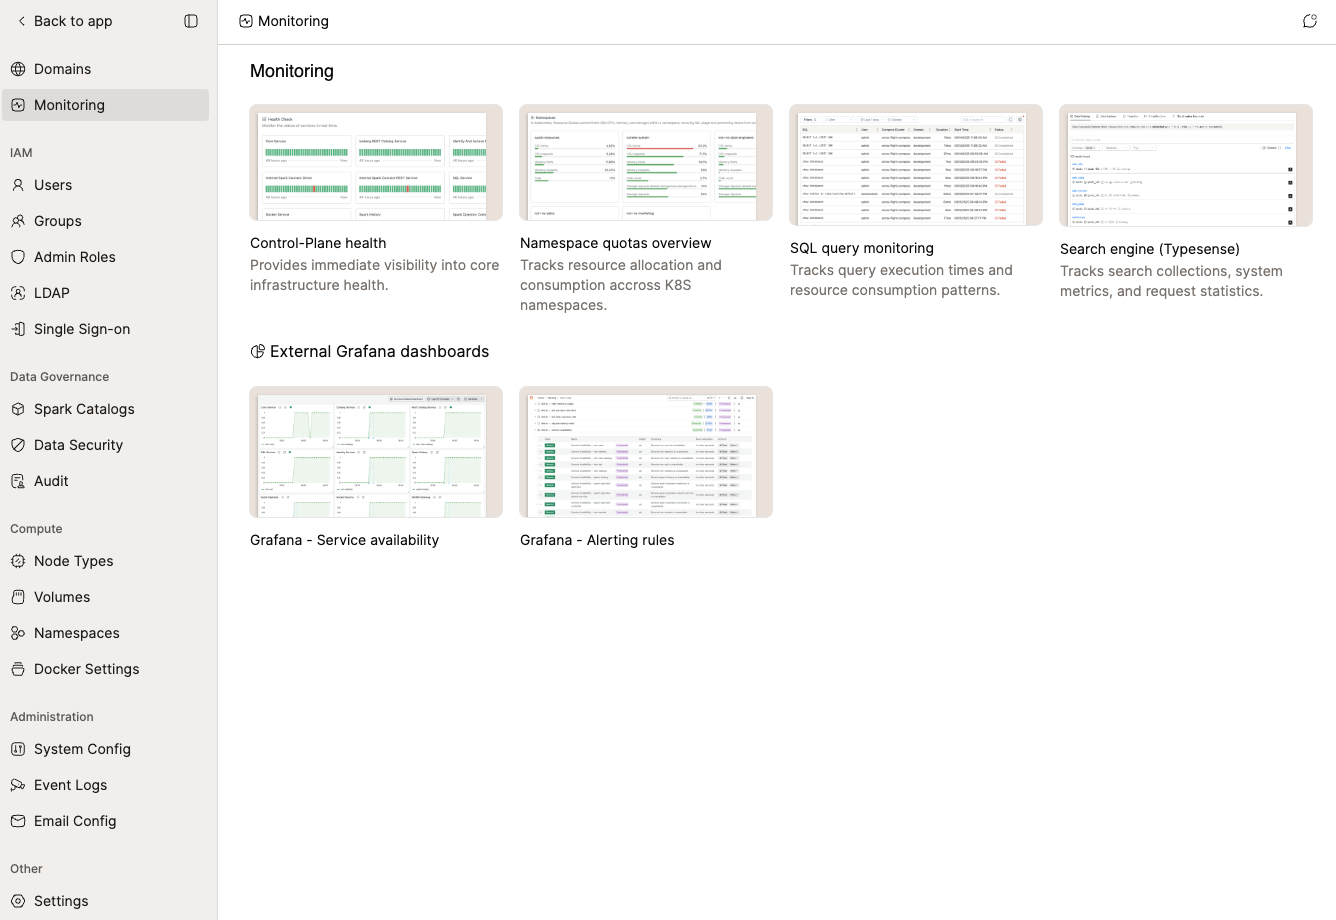
Monitoring is the admin portal's directory of every platform-wide monitoring surface in IOMETE: control-plane health, namespace resource usage, query activity, search engine metrics, and any external Grafana dashboard your organization has configured. The page itself renders no metrics. Each card links to the page that does.
Sign in with an admin account and open the admin portal, then click Monitoring in the left sidebar. Any admin role can open it, so you won't need a special permission just to find it.
Monitoring Cards
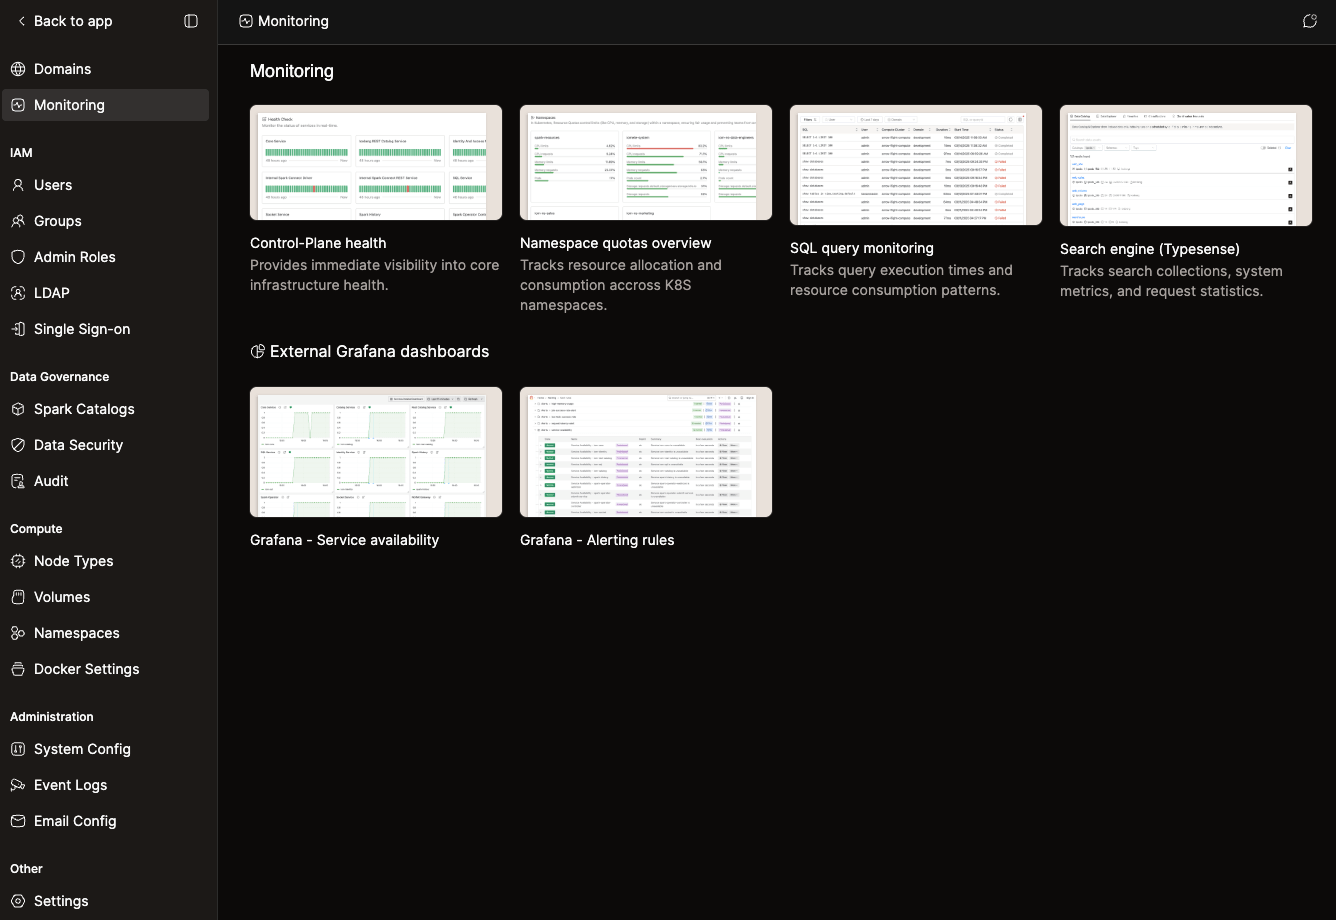
Each card has a thumbnail image, a title, and a short description, so you don't have to memorize a URL for every monitoring surface in IOMETE. Click any of the four standard cards to open it, all in the same browser tab:
| Card | What It Opens | Description |
|---|---|---|
| Control-Plane health | The Health Check page | Shows core infrastructure health at a glance. |
| Namespace quotas overview | The Namespaces page (Compute group in the sidebar) | Tracks resource allocation and consumption across Kubernetes namespaces. See Namespace Quotas. |
| SQL query monitoring | The Query Monitoring page | Tracks query execution times and resource consumption patterns. |
| Search engine (Typesense) | The Search Engine Monitoring page | Tracks search collections, system metrics, and request statistics. |
The Search engine (Typesense) card is visible to any admin, but its page requires the Administration Manager role for every request. See Search Engine Monitoring for details.
External Grafana Dashboards
If your organization has linked external Grafana dashboards, a second section titled External Grafana dashboards appears below the main card grid. Unlike the standard cards, these two cards open in a new browser tab, because they lead to Grafana, outside the admin portal:
- Grafana - Service availability
- Grafana - Alerting rules
Each card only appears once its dashboard URL has a value. If neither is configured, the section doesn't render at all, so it never appears empty.
These cards can only appear if your data plane was deployed with monitoring support enabled (the Helm value monitoring.enabled, default false). If that flag is off, the two dashboard-URL keys don't exist in System Config at all, so there's nothing to find or set in the console. If you can't locate these keys, this infra-level flag being off is the most likely reason, not a UI issue. Ask whoever deployed your data plane to confirm the setting.
If a dashboard URL is entered as a full address (starting with http:// or https://), IOMETE links to it as-is. If it's a relative path instead (starting with /), IOMETE resolves it against the console's own address: the same protocol, host, and port you're using to view the admin portal.
Configuring the Dashboard Links
To make these cards appear, set the corresponding System Config values. This requires the Administration Manager role. Without it, the edit action is disabled and shows an access-denied tooltip.
-
Sign in with an account that has the Administration Manager role.
-
In the left sidebar, open the Other group and click Settings.
-
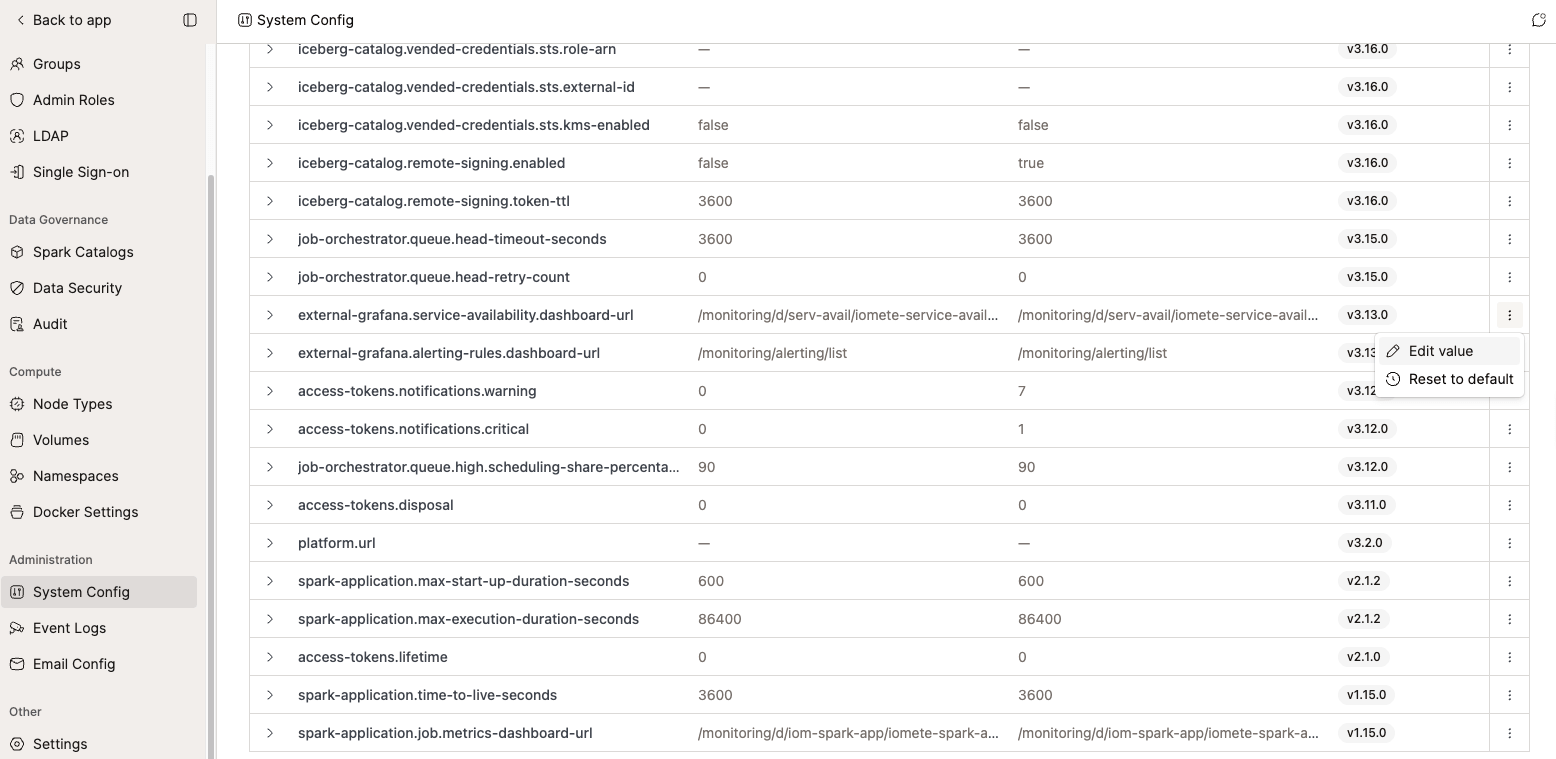
Open System Config and find the key for the dashboard you want to link:
external-grafana.service-availability.dashboard-urlexternal-grafana.alerting-rules.dashboard-url
-
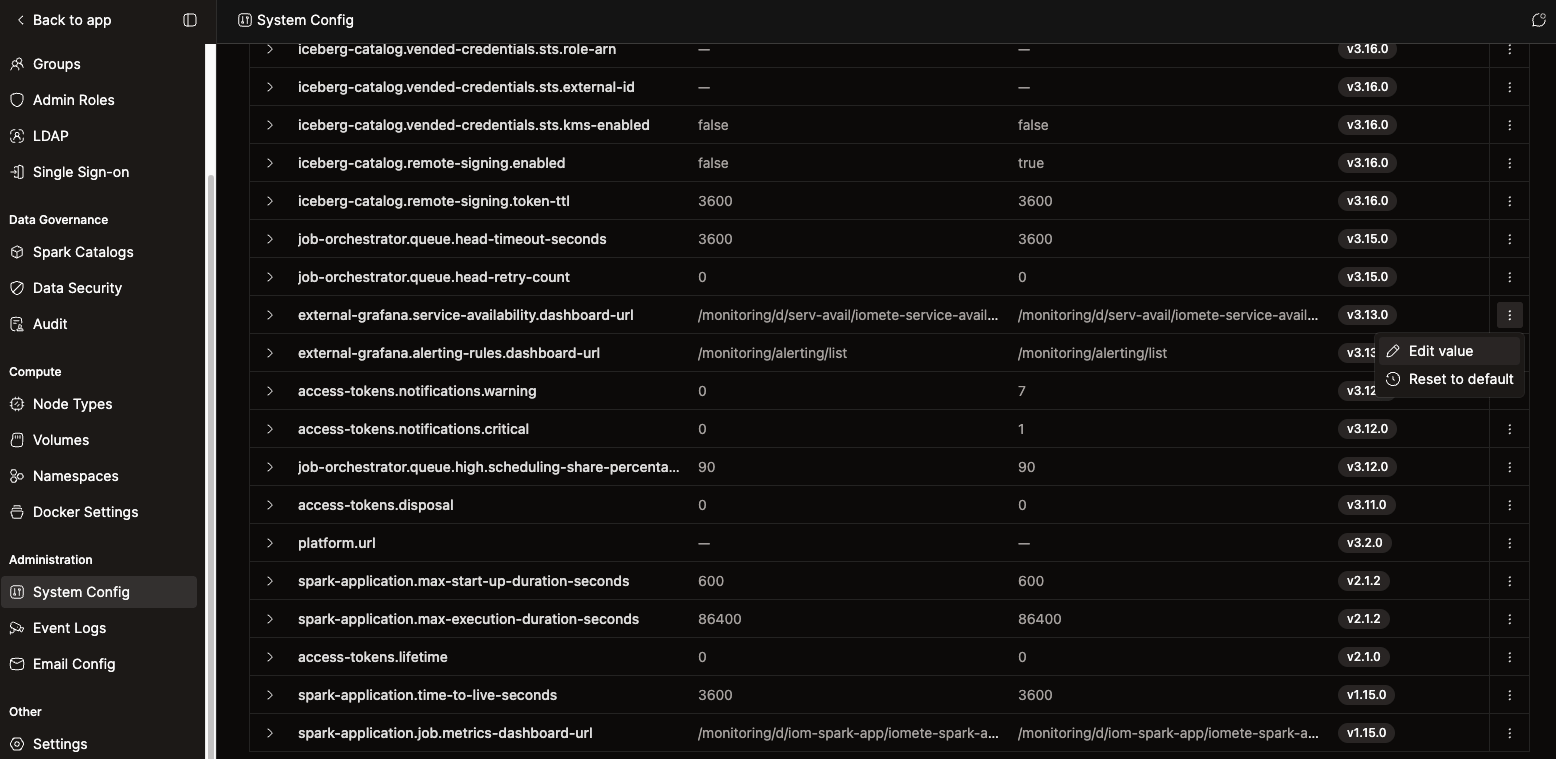
Open the row's actions menu and choose Edit value.
-
Enter the URL of the corresponding Grafana dashboard, then save.


If the value you enter fails validation, the dialog shows the error inline on the field instead of saving:
| Trigger | Error Message |
|---|---|
| Value is left blank | "Dashboard URL cannot be blank" |
Value doesn't start with http://, https://, or / | "URL should either be relative (starts with '/') or start with http:// or https://" |
If validation passes, IOMETE shows a "Config updated successfully" toast and closes the dialog. The next time anyone opens the Monitoring page, the matching card appears or disappears based on the new value.
You can also choose Reset value from the same row-actions menu to remove your override and revert to the key's built-in default (/monitoring/d/serv-avail/iomete-service-availability for service availability, /monitoring/alerting/list for alerting rules). This also requires the Administration Manager role.
Access Permissions
Who can see Monitoring and who can edit its Grafana links are two different questions, governed by two independent permission checks:
| Role | View Monitoring Page & Cards | Edit / Reset Grafana Dashboard URLs |
|---|---|---|
| Any admin role | ✅ | ❌ |
| Administration Manager | ✅ | ✅ |
There's no resource-level permission model for this page. Access is governed entirely by admin role, independent of any workspace- or namespace-scoped permissions you might have elsewhere.