Run History & Metrics
You can view maintenance runs at two levels:
- Table-level history lives on the table's Maintenance tab and shows runs for that table only.
- Catalog-level history lives under Monitoring > Maintenance in the side panel and shows runs across every catalog the domain owns, with filters to narrow the results.
Both views open the same per-run detail page when you click a row.
Viewing Table-Level History
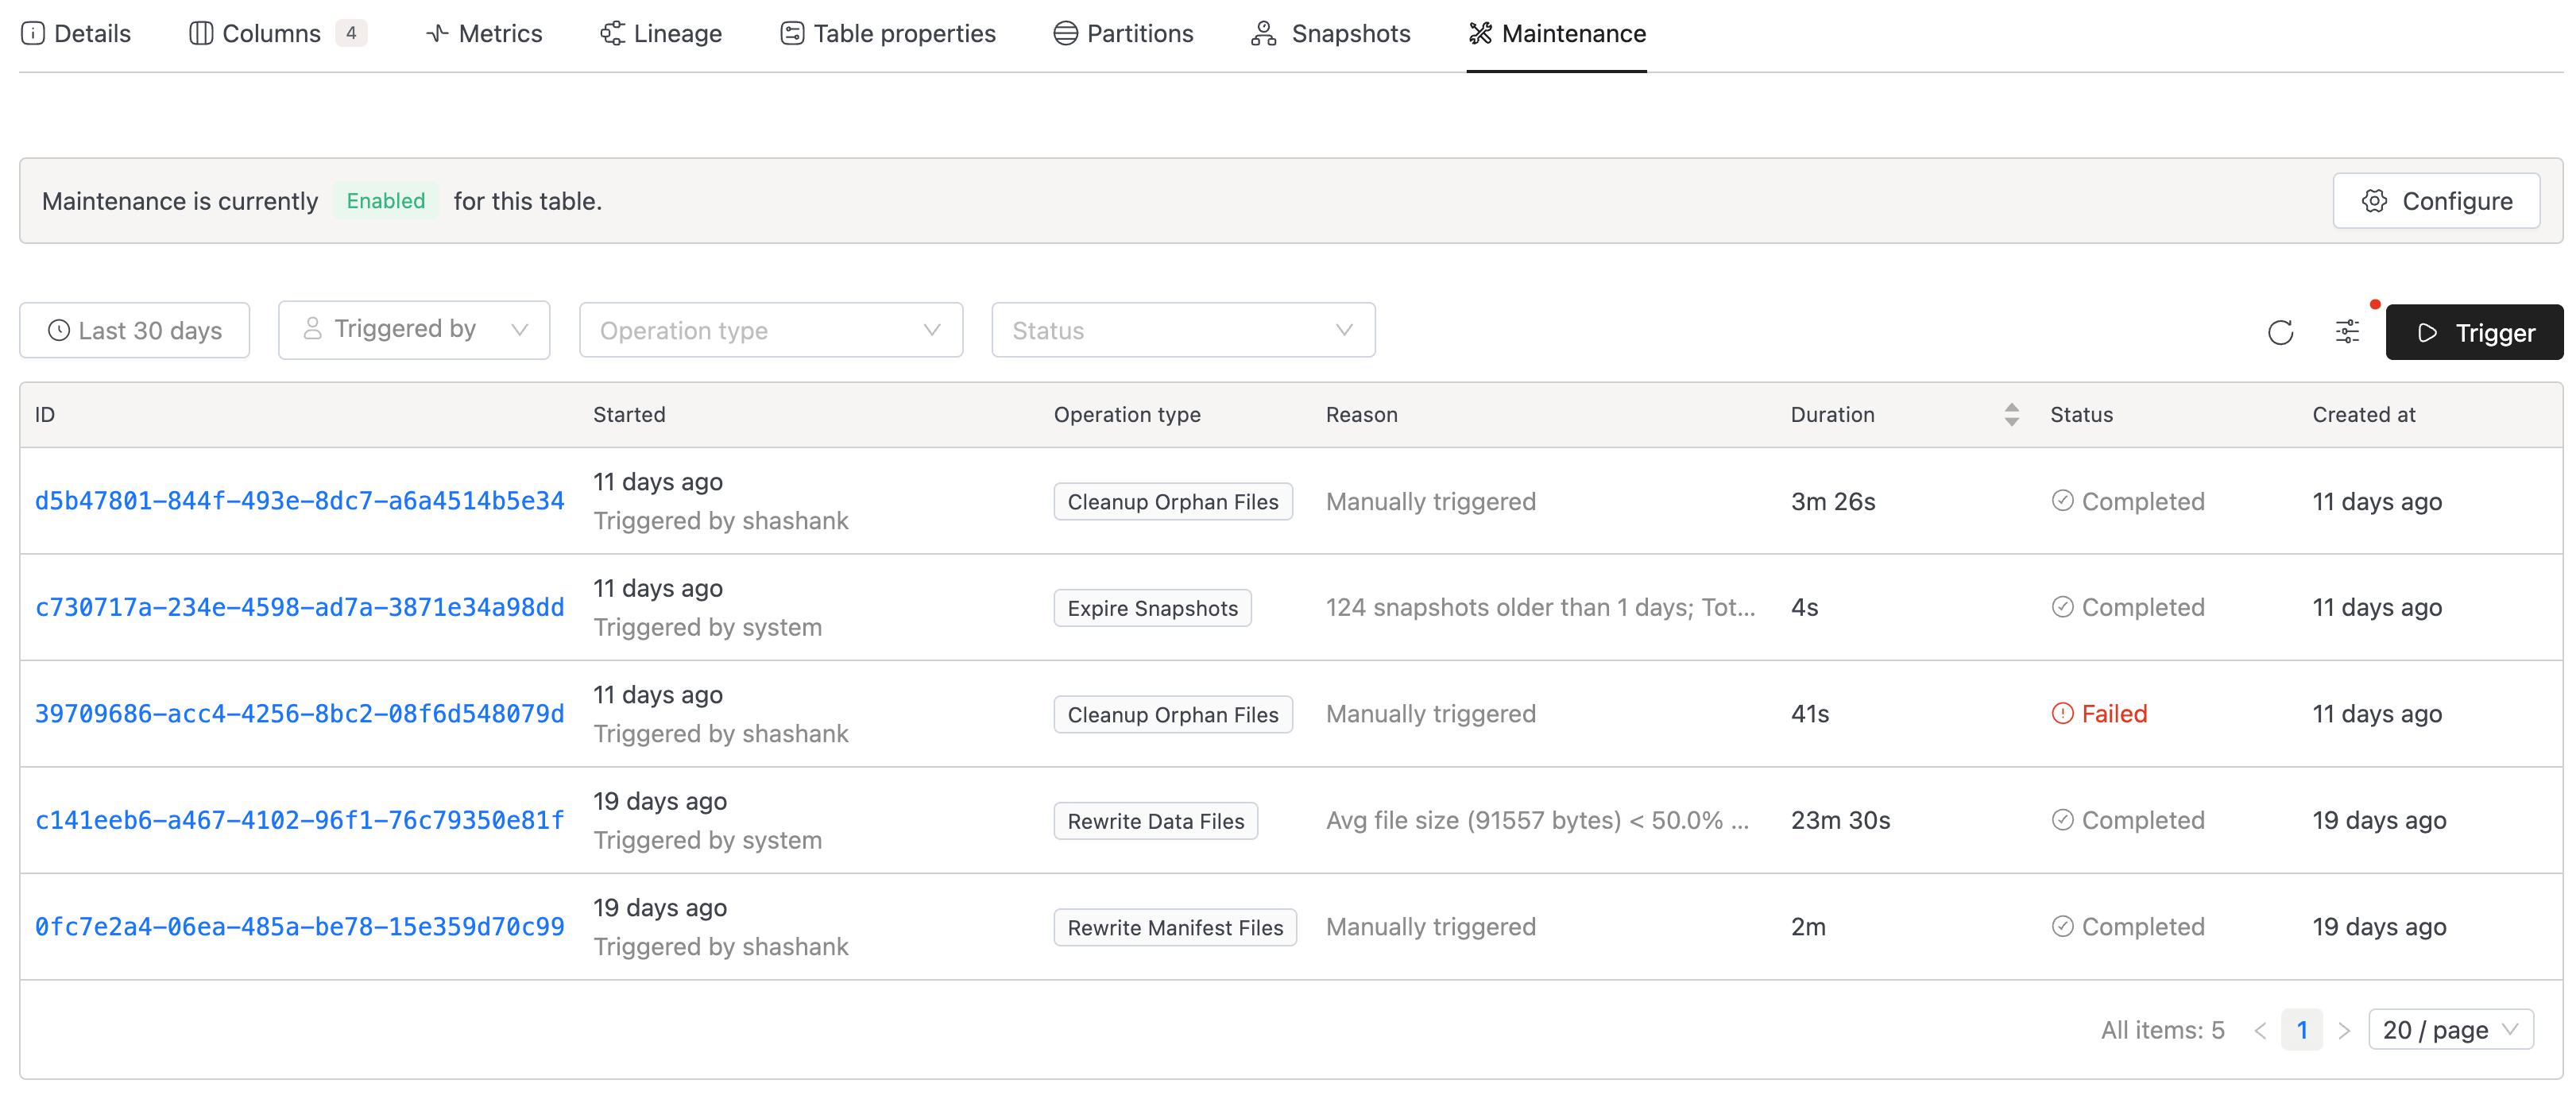
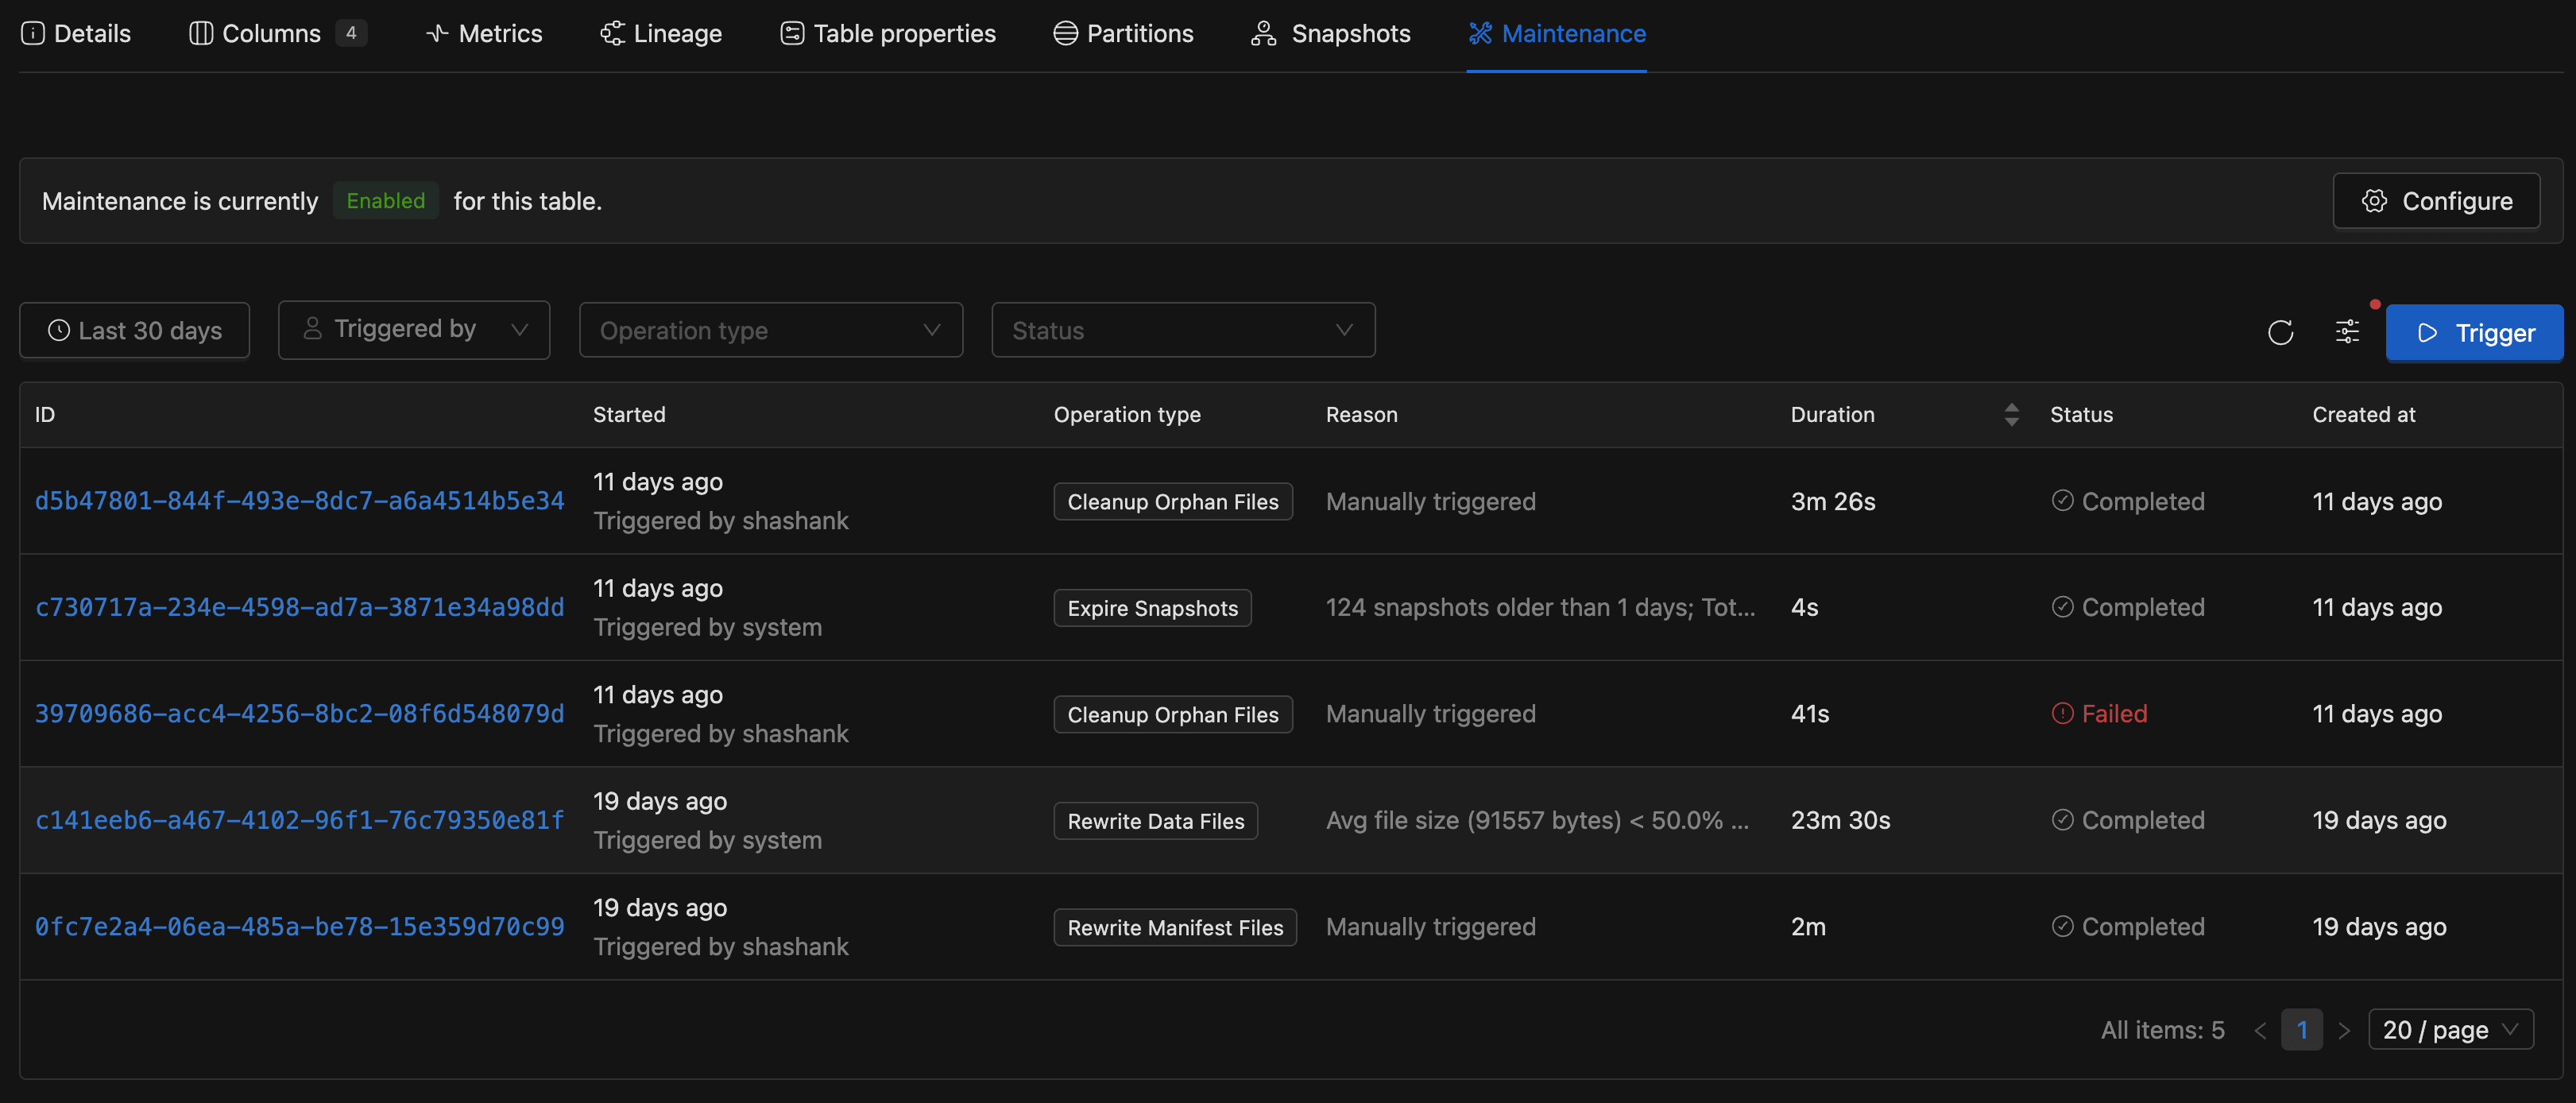
The table's Maintenance tab lists every maintenance run for that table. It's the quickest way to see what ran, why it ran, and what changed.
- Go to Governance > Data Catalog from the side panel.
- Find and open the table details page:
- Data Catalog tab: Search for the table by name and click it.
- Data Explorer tab: Navigate through Catalog > Database > Table.
- Go to the Maintenance tab.
- Use the filters at the top to narrow results:
- Time range: a date-range picker (maximum range is 30 days).
- Triggered by: filter by the username who triggered the run.
- Operation type: filter by a specific operation.
- Status: filter by status (All, Pending, Running, Completed, etc.).
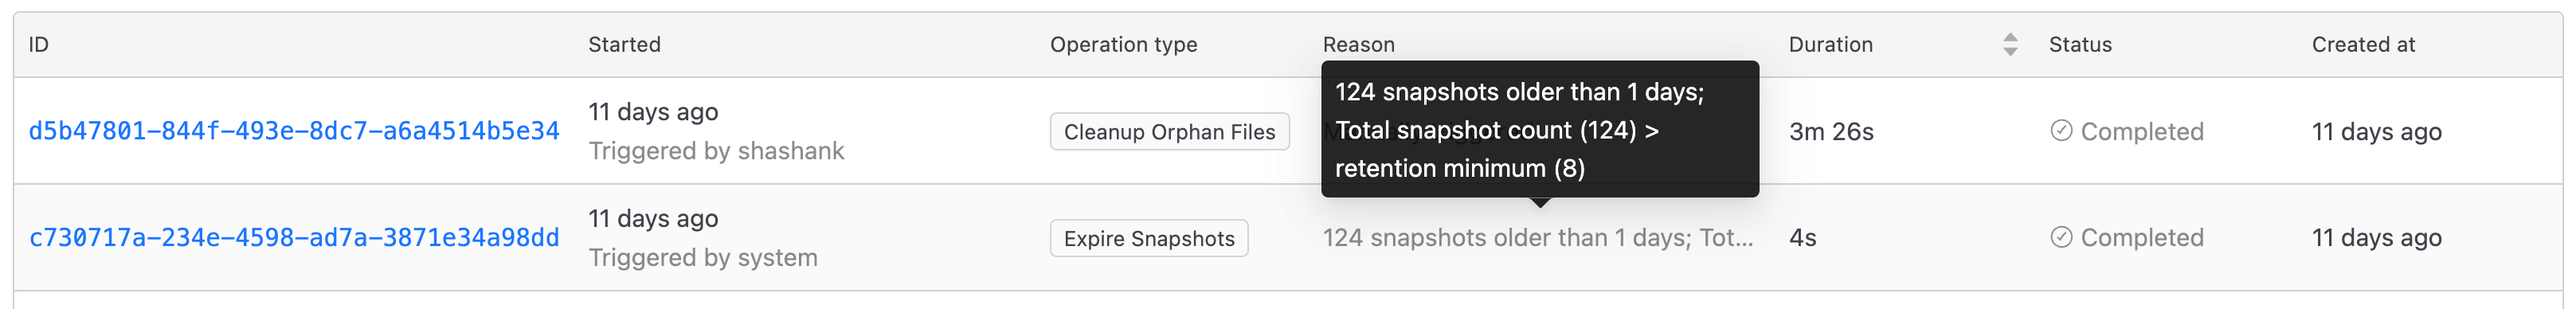
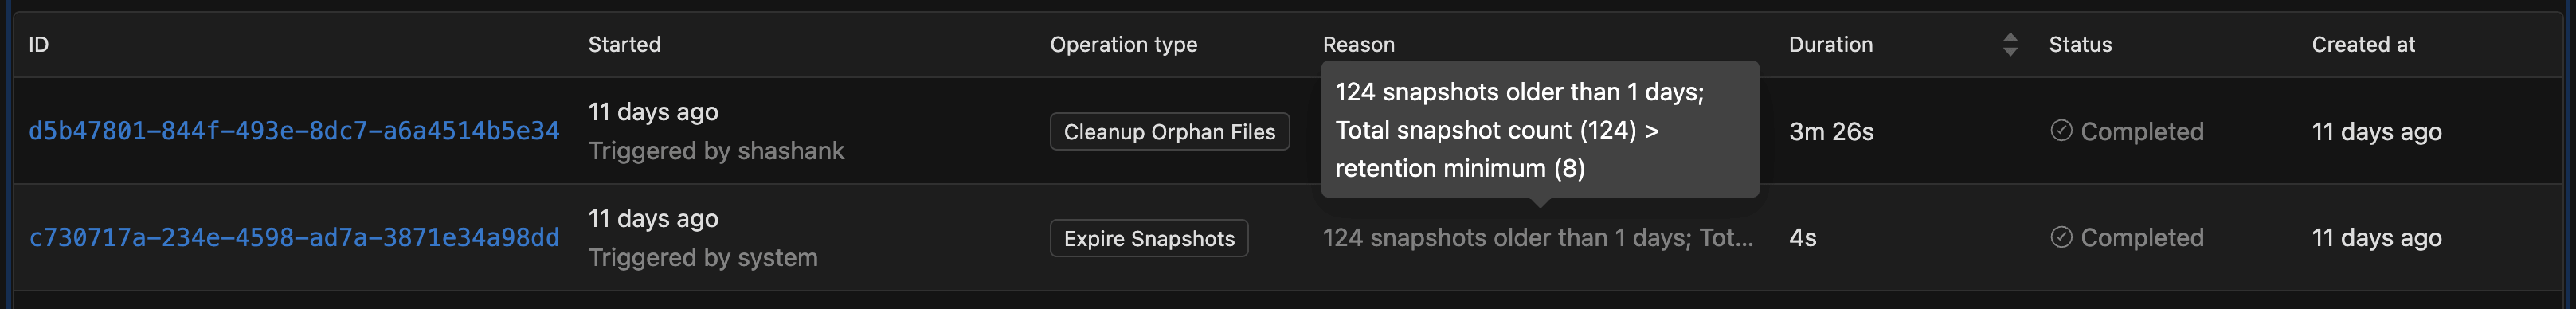
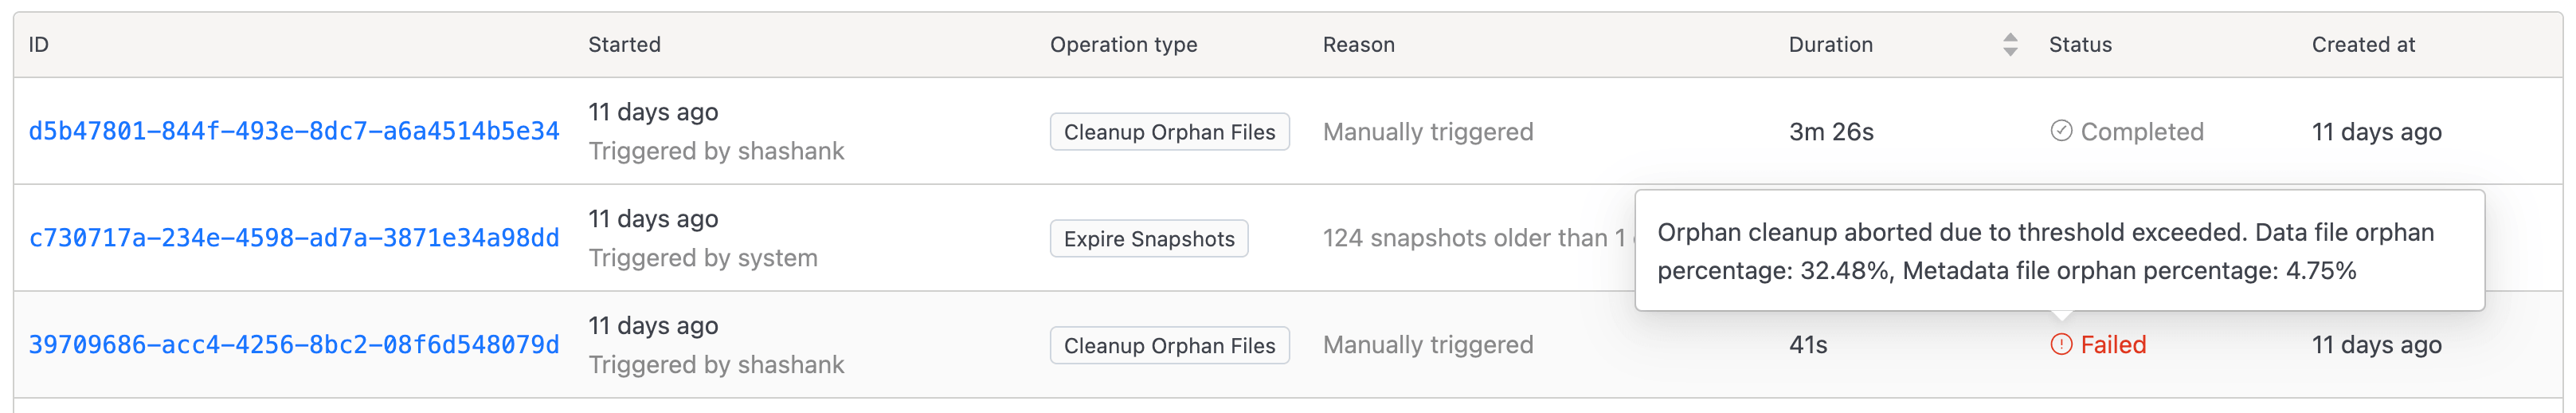
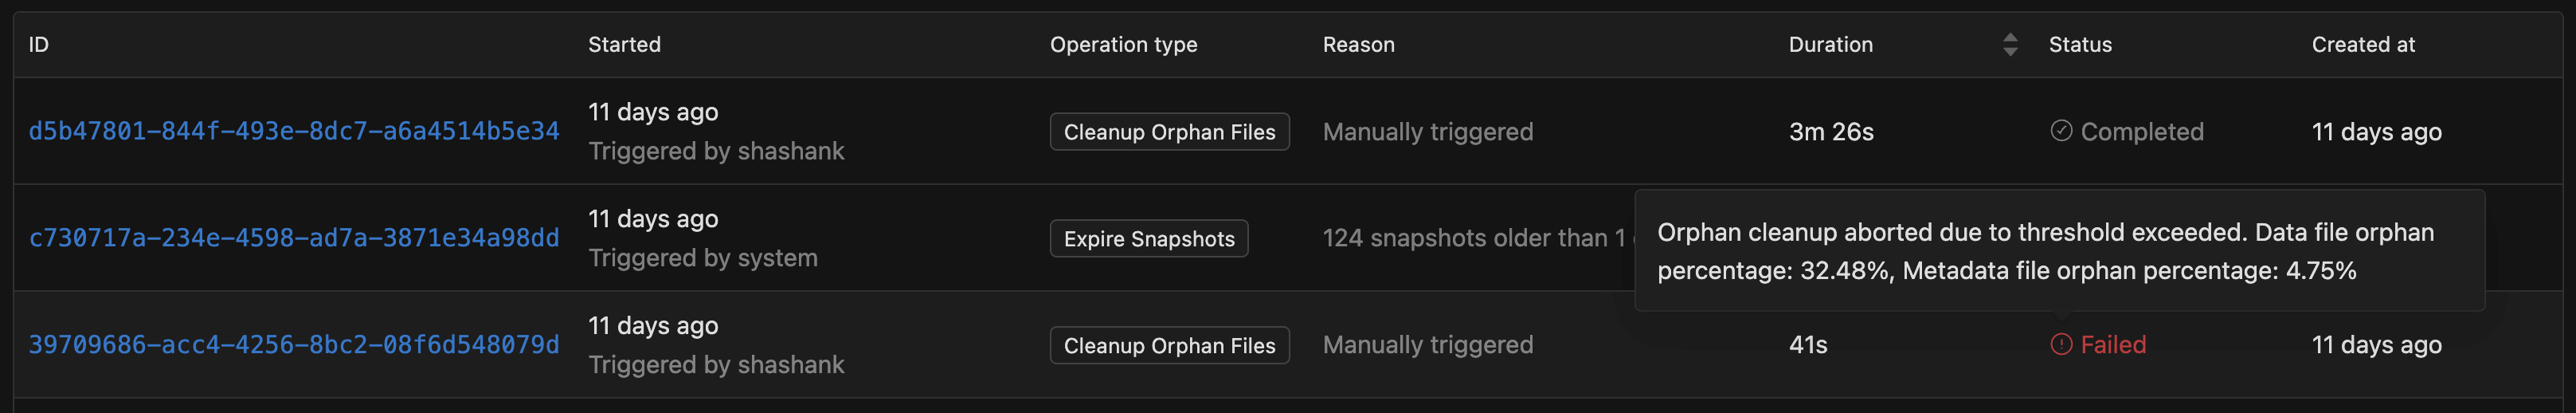
- The Reason column shows why an operation was scheduled: which threshold condition was met (small average file size, high delete-file ratio, excessive snapshot count, etc.) or whether it was a manual trigger.
- For a failed run, hover over the Failed badge to see the error message inline.
- Click any row to open its run detail page.
Viewing Catalog-Level History
The catalog-level history shows runs across every catalog domain owns and adds Catalog, Database, and Table filters so you can scope the runs however you need.
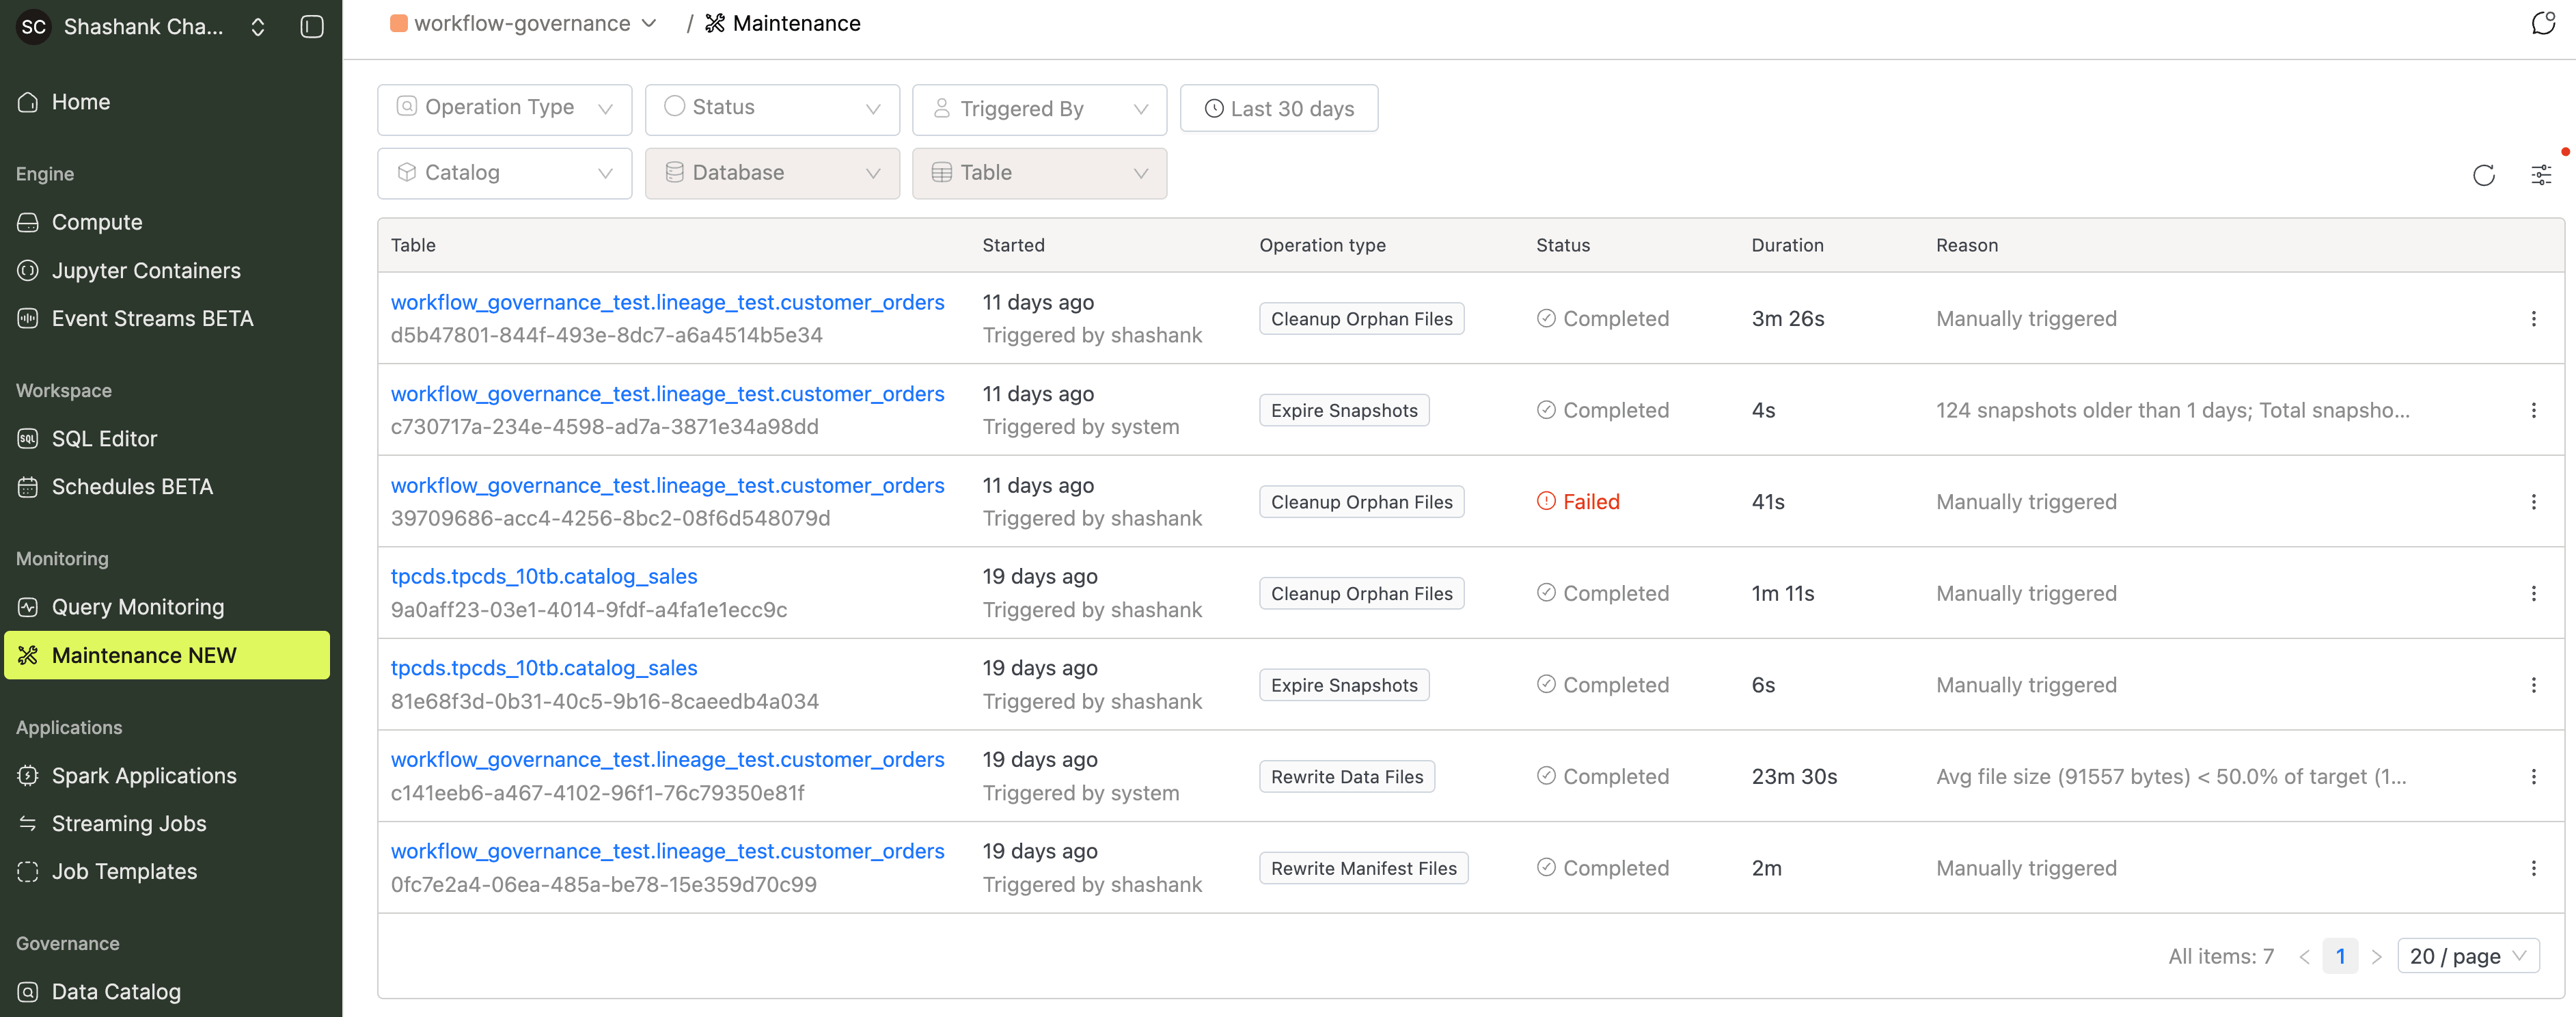
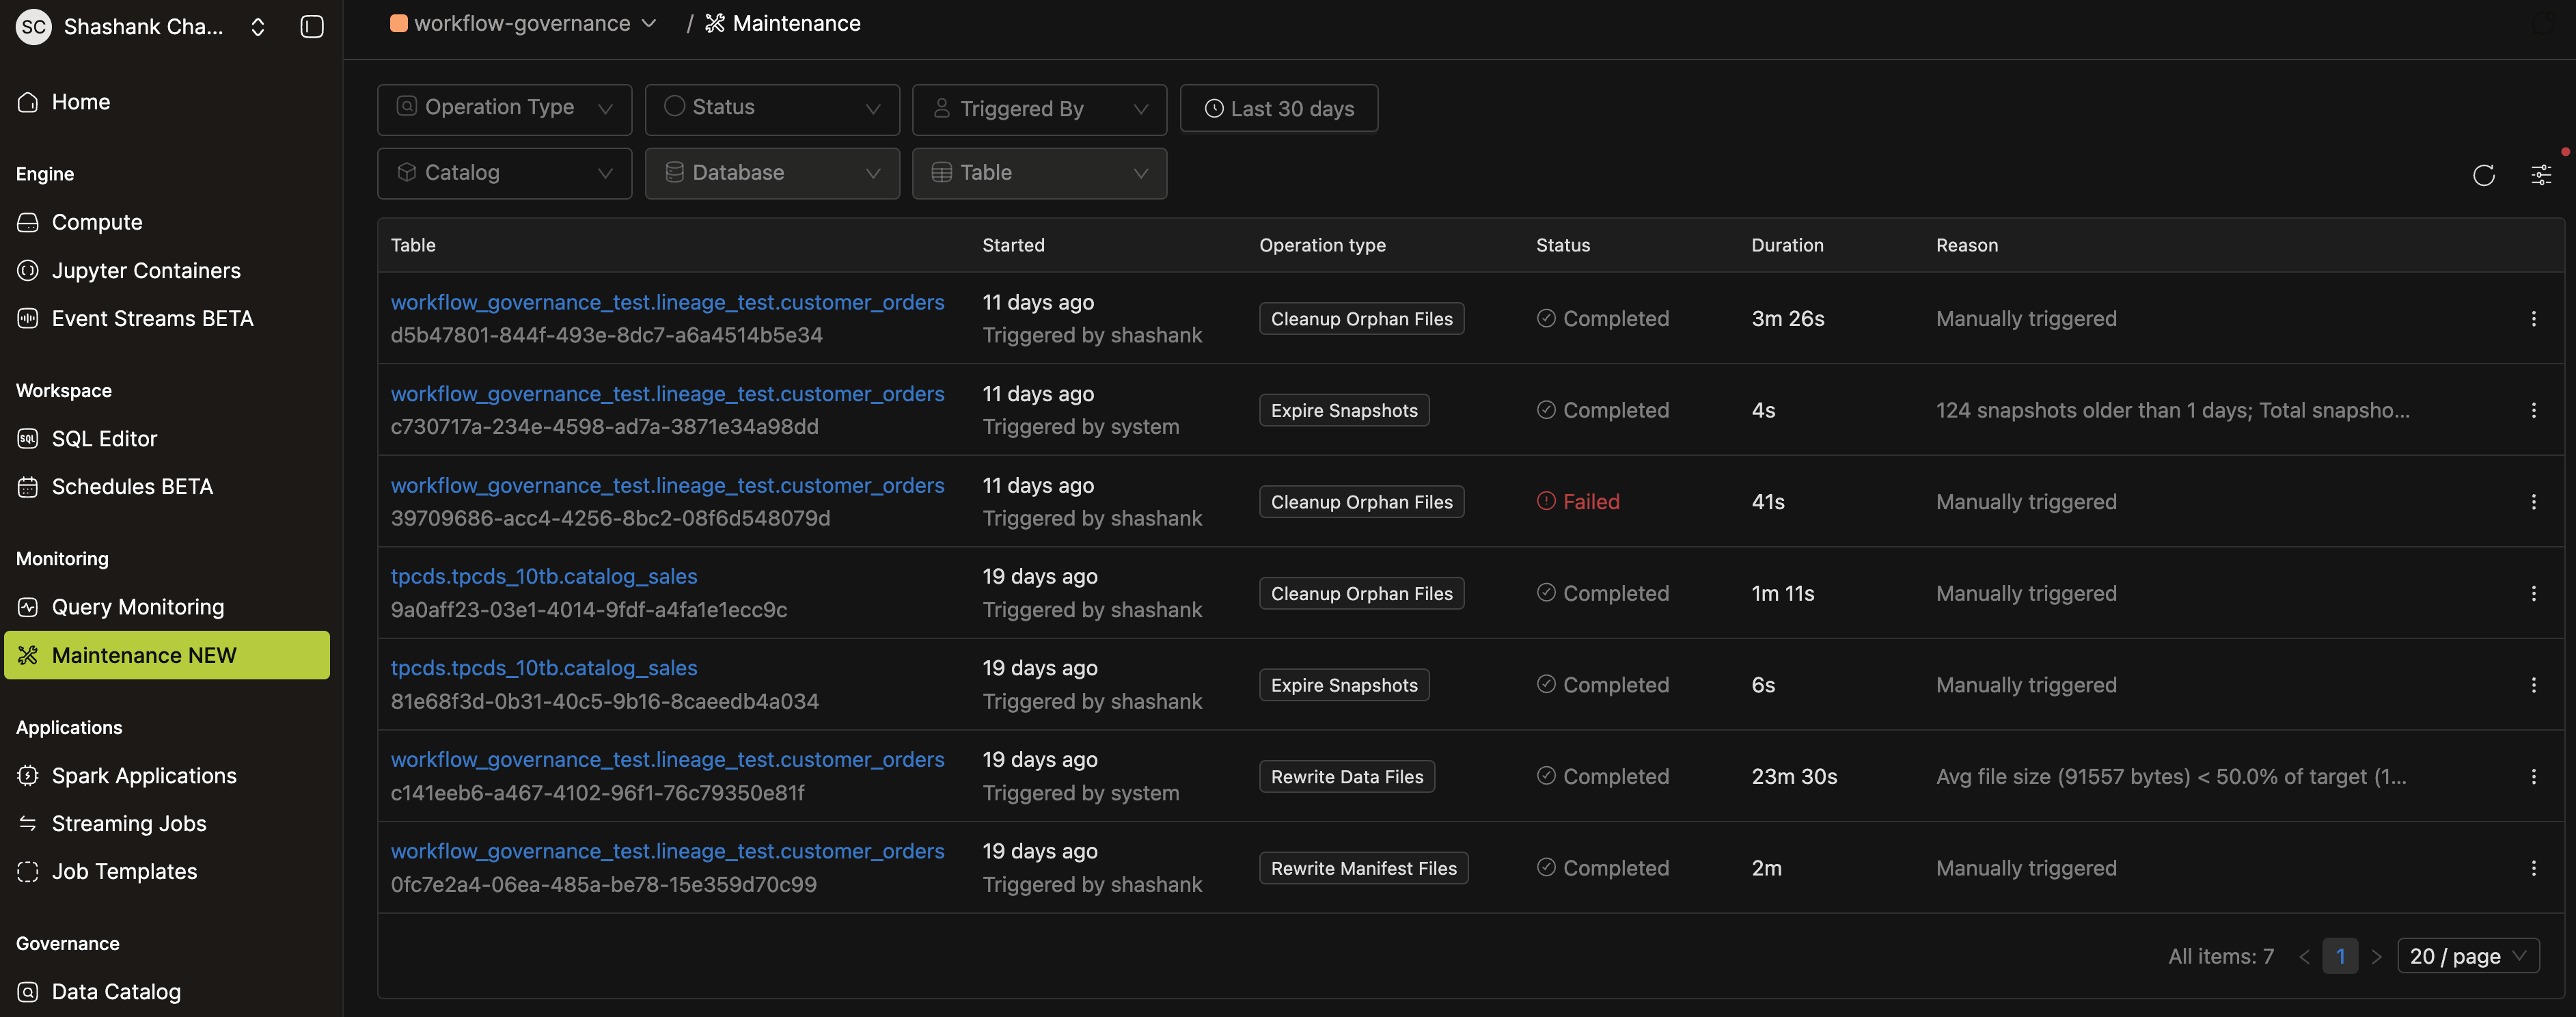
- From the side panel, go to Monitoring > Maintenance.
- Use the filters at the top of the page:
- Operation Type, Status, Triggered By, Time range — same as on the table-level view.
- Catalog, Database, Table — narrow to a specific scope.
- The Table column shows the full
catalog.database.tablepath for each run. Click it to open the run detail page.
Viewing a Run Detail Page
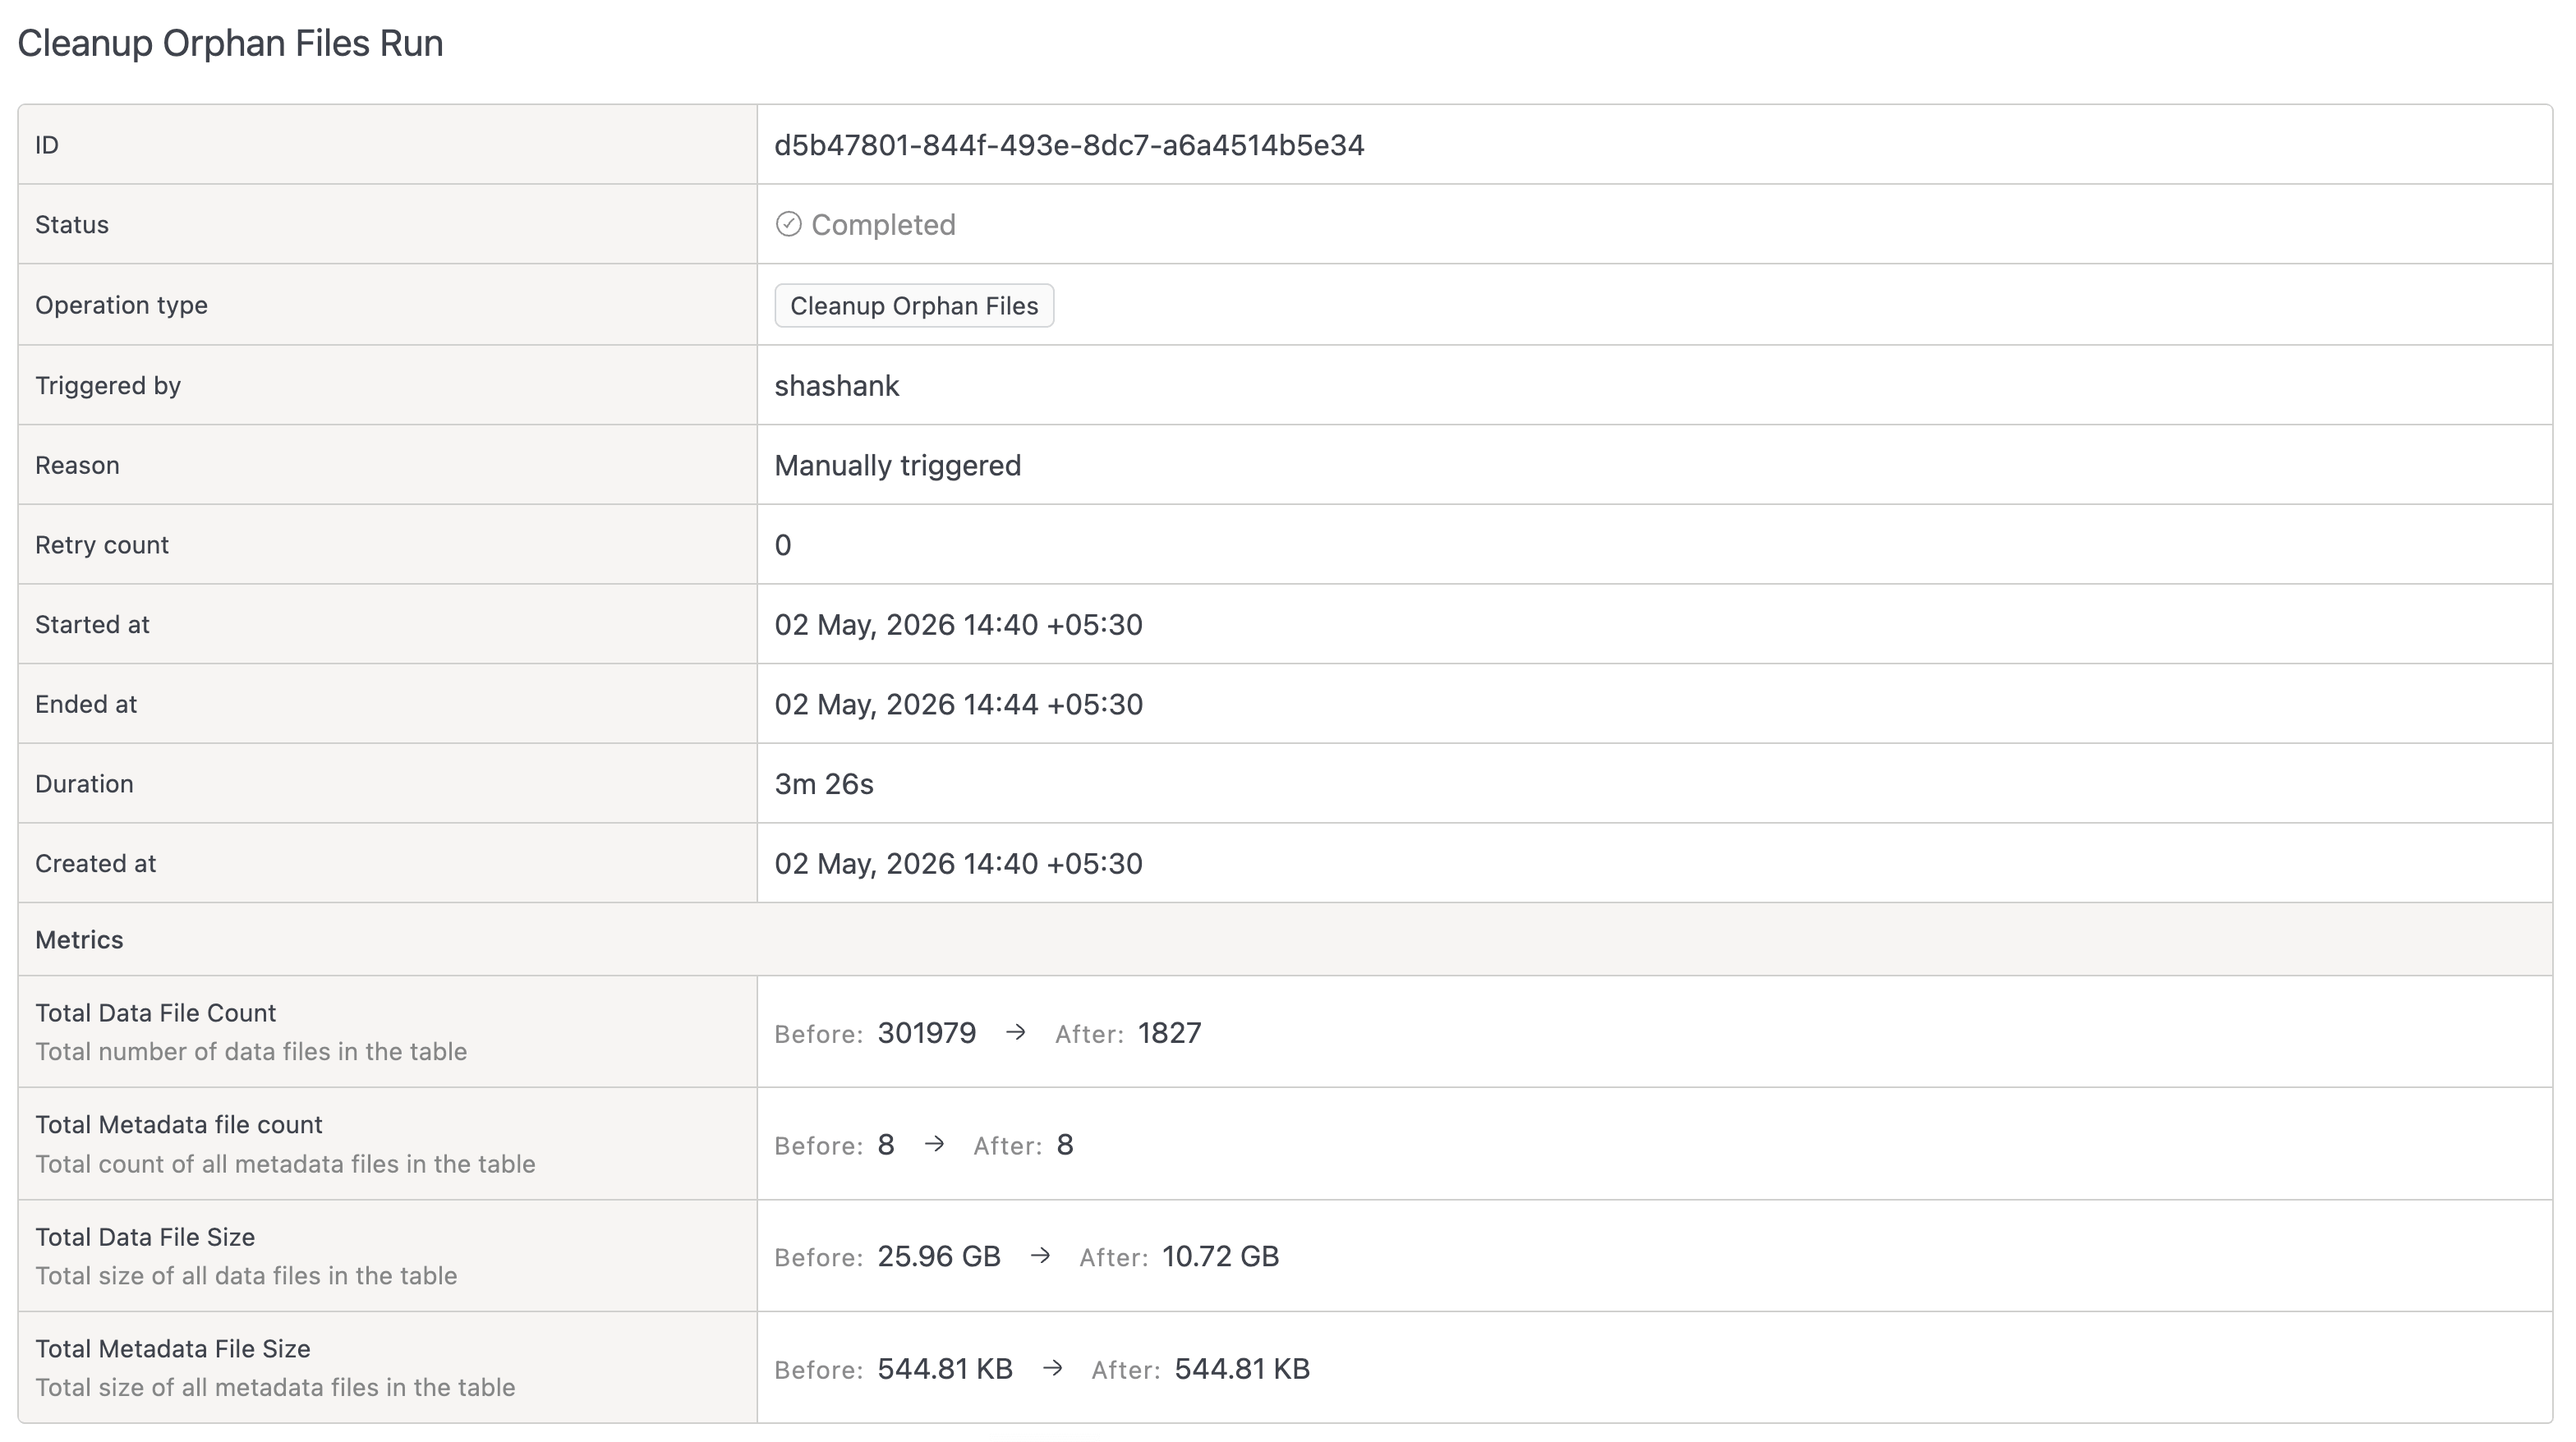
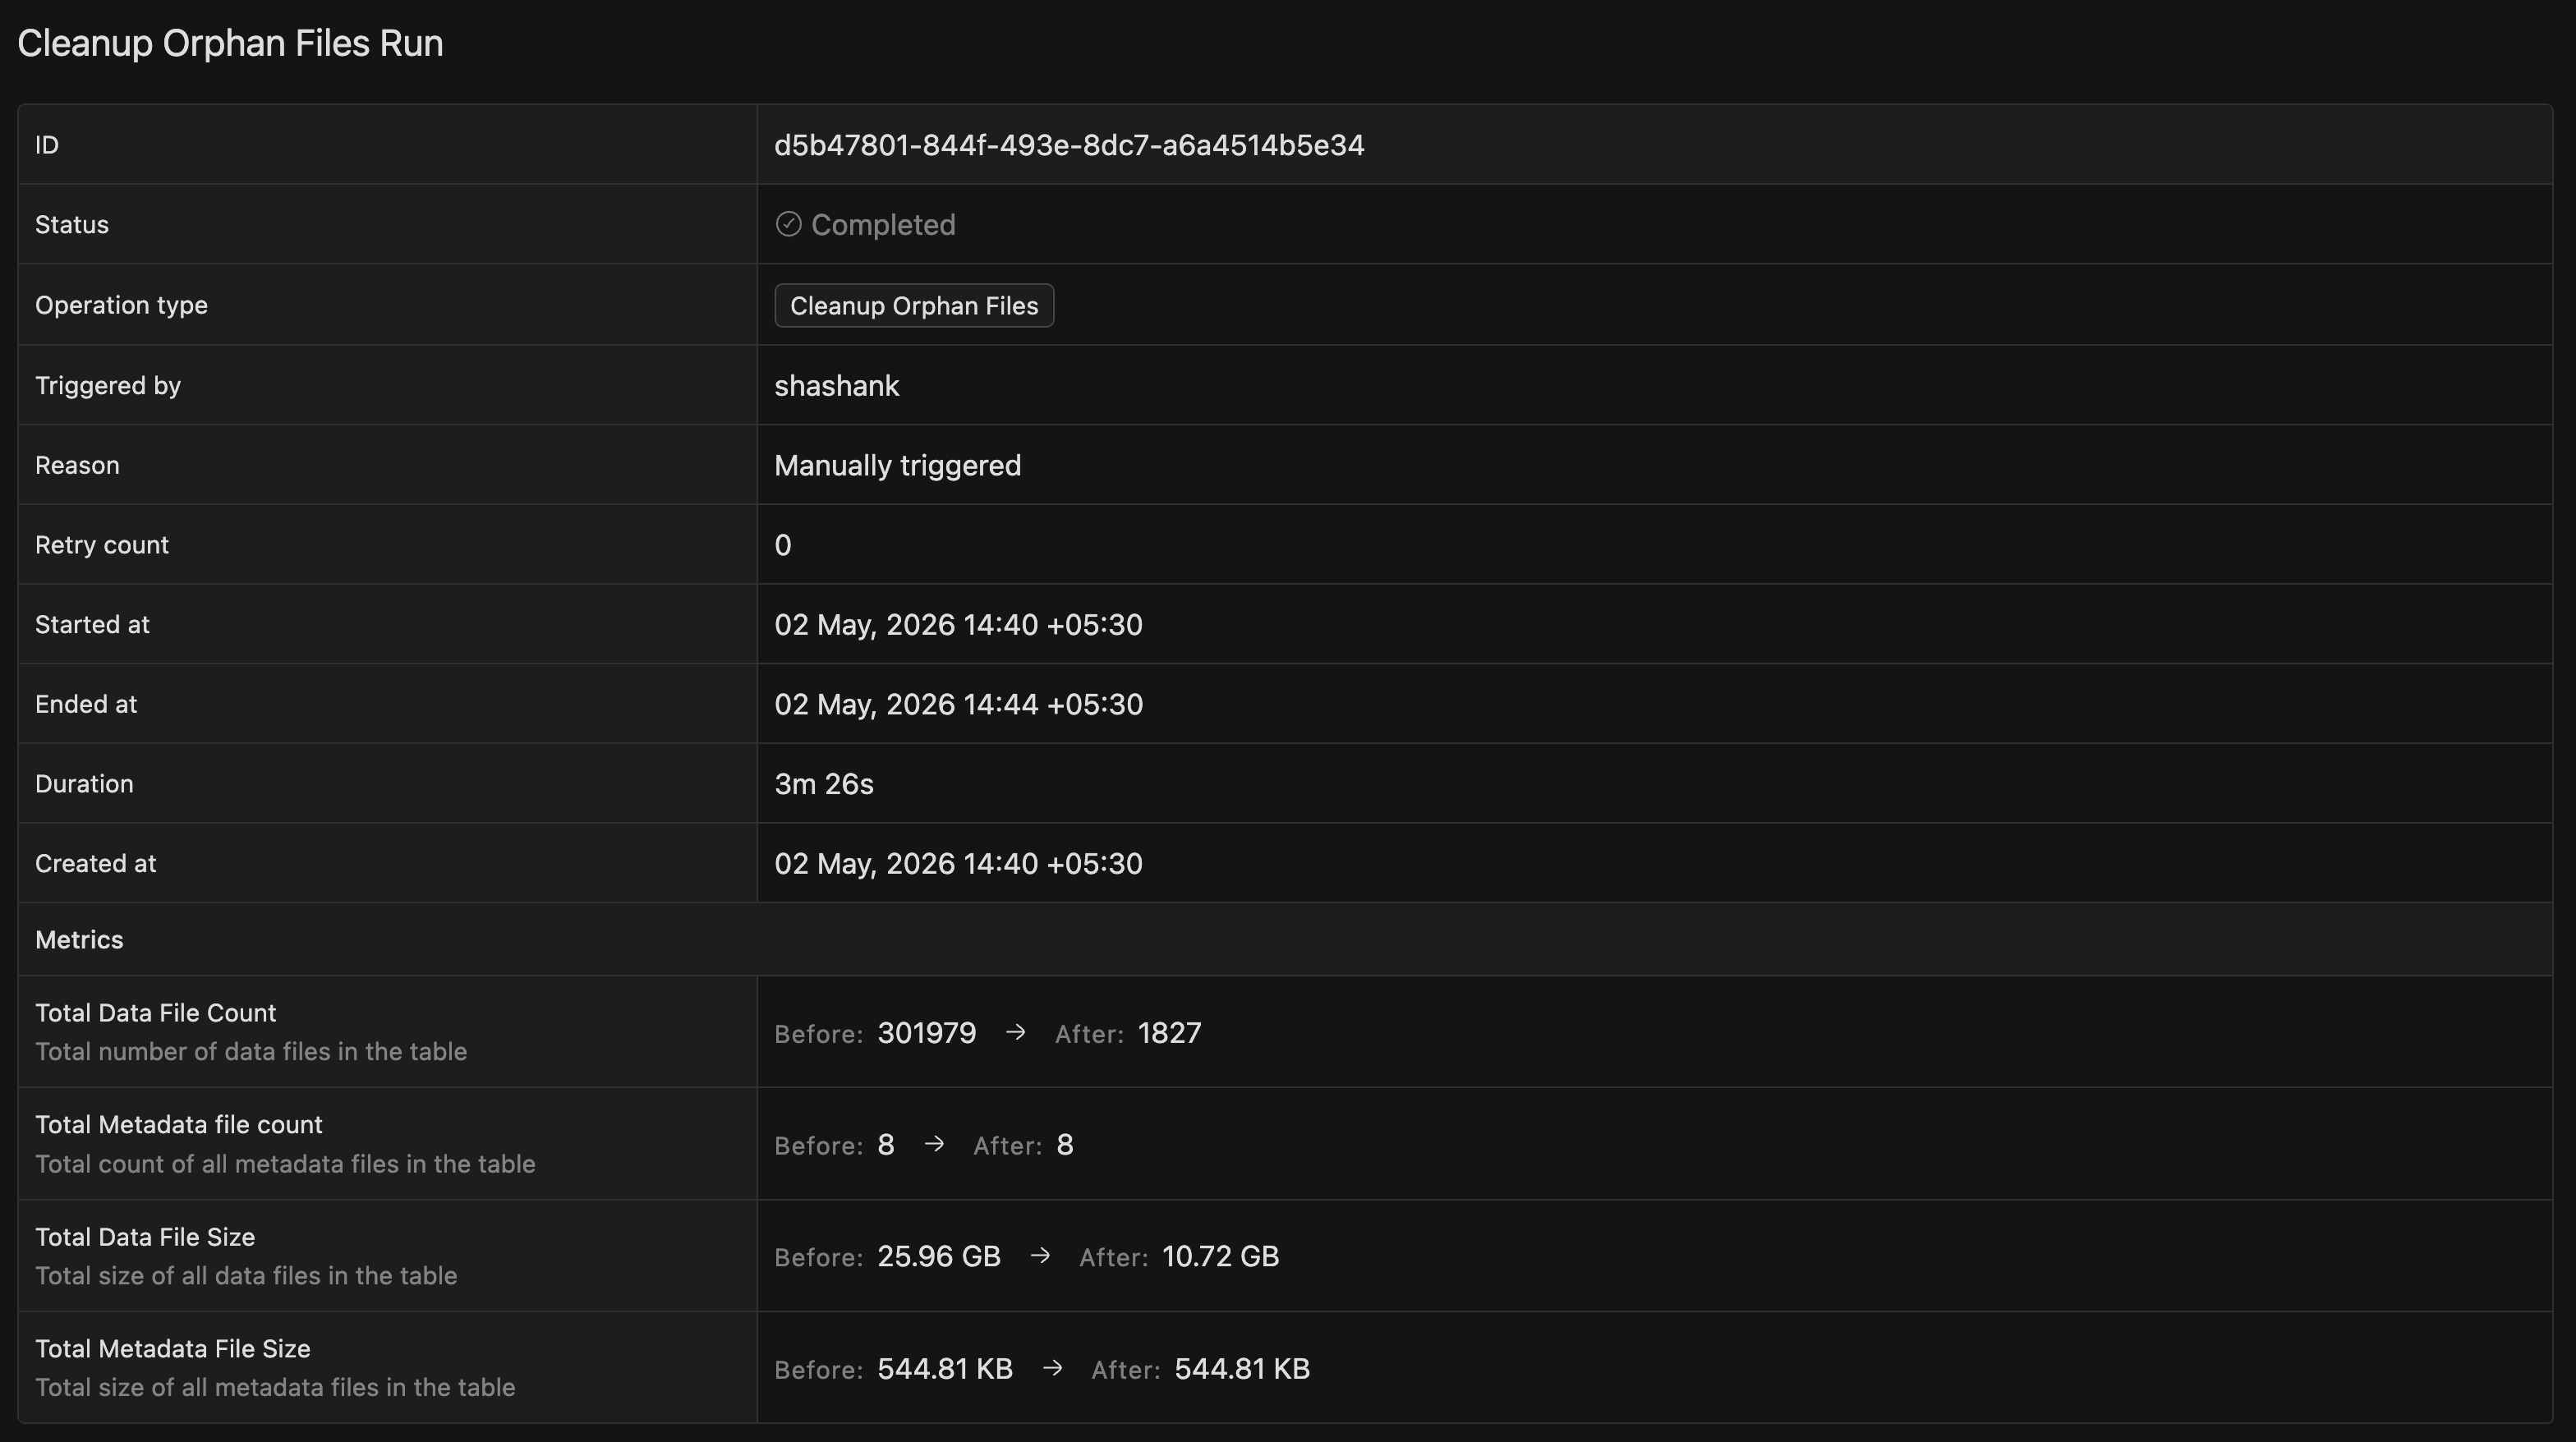
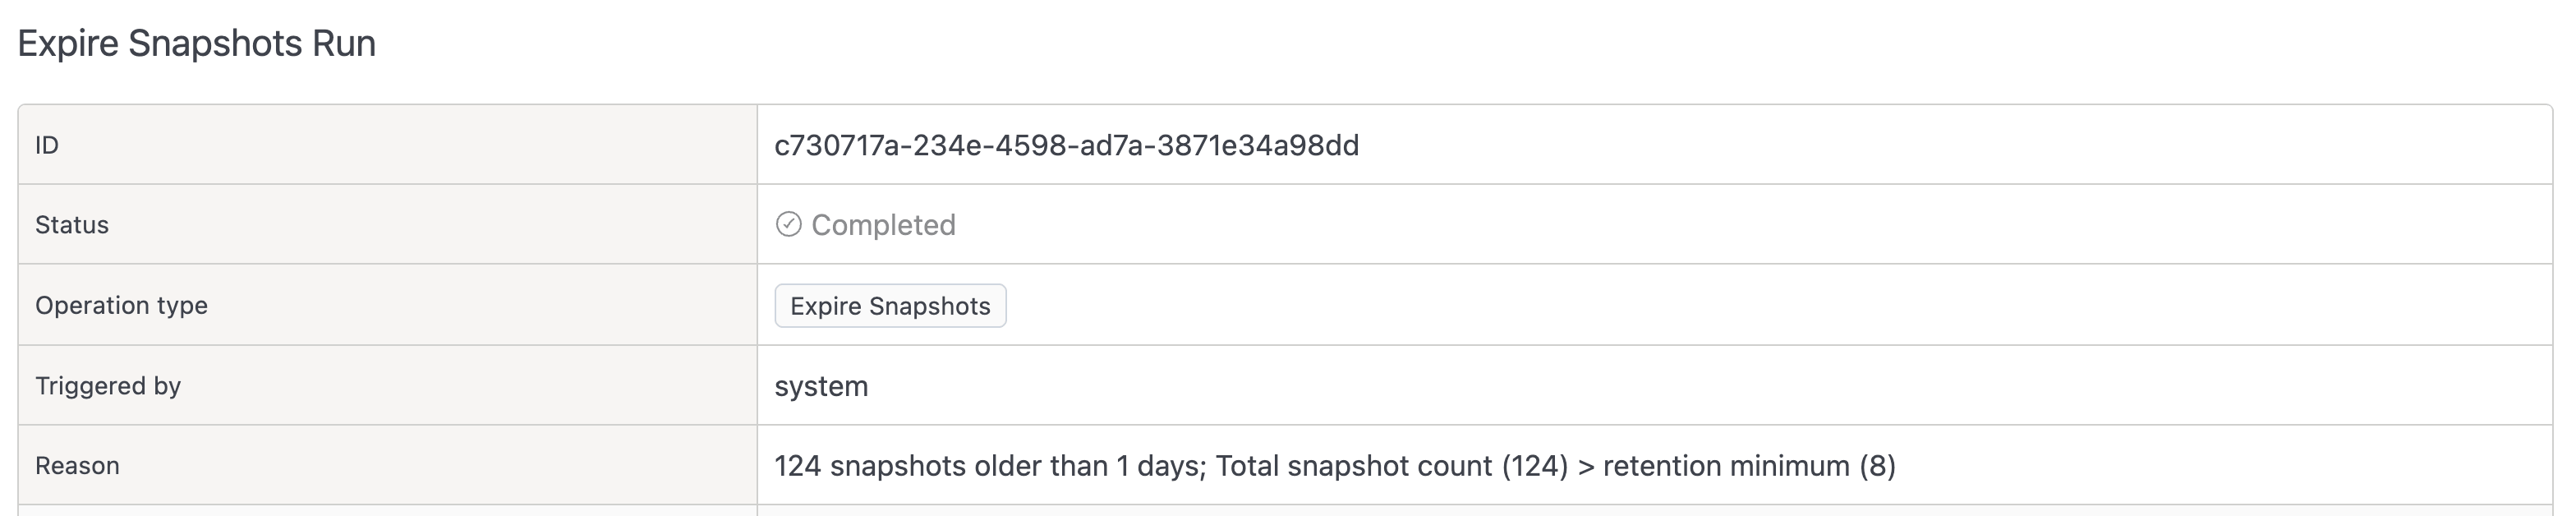
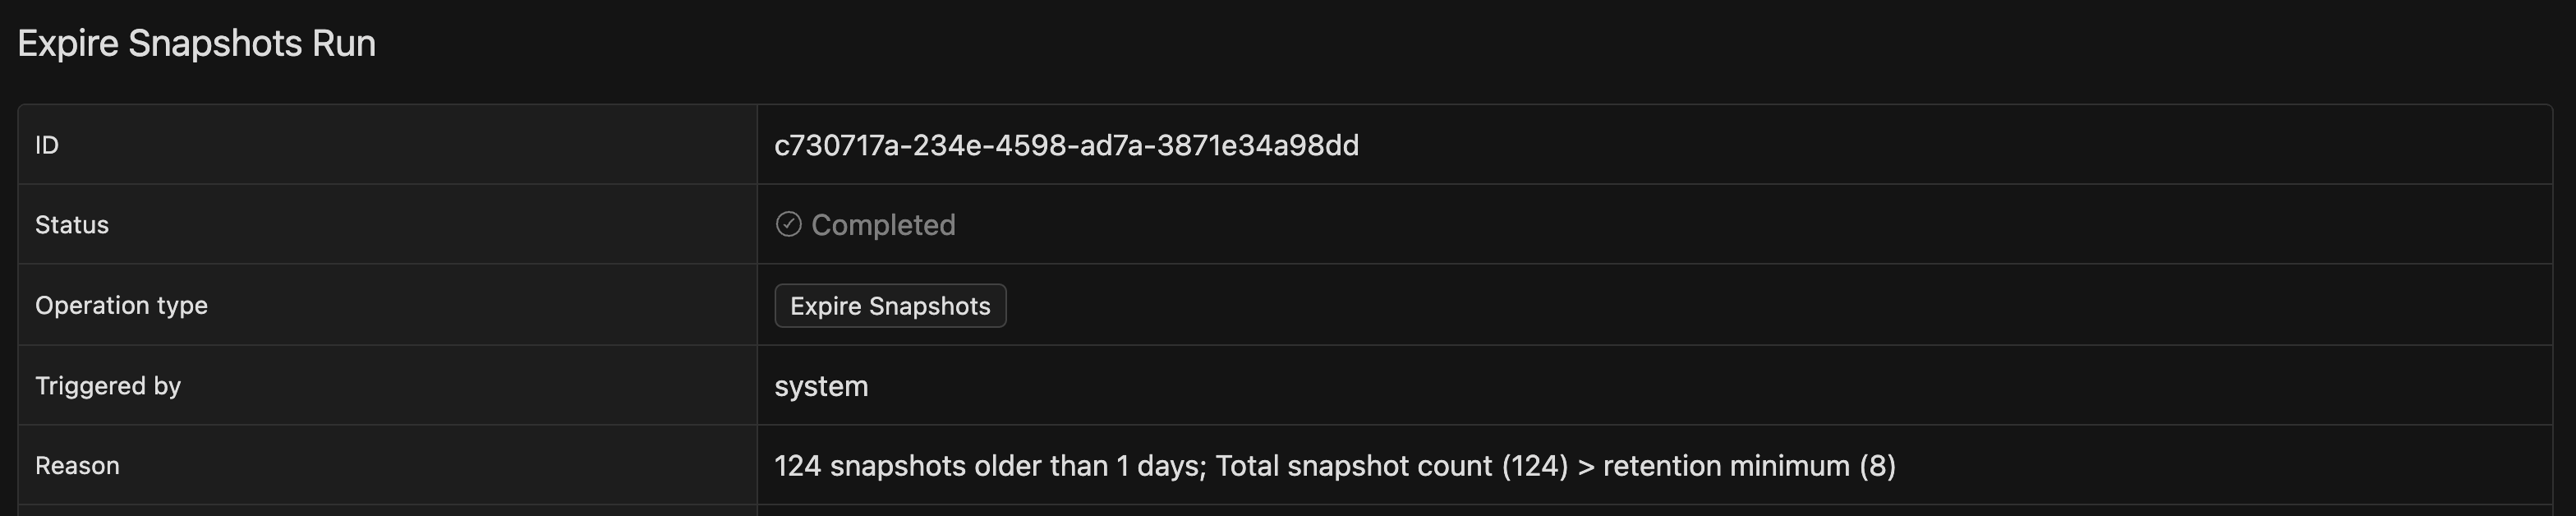
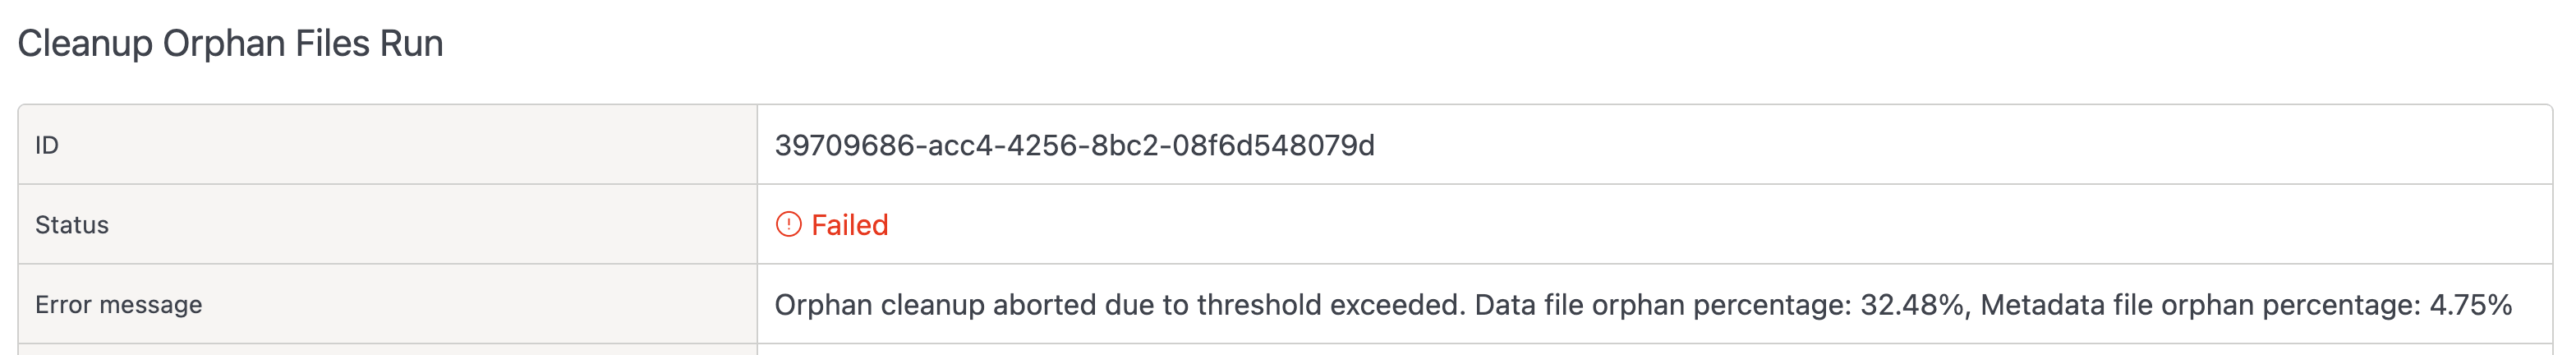
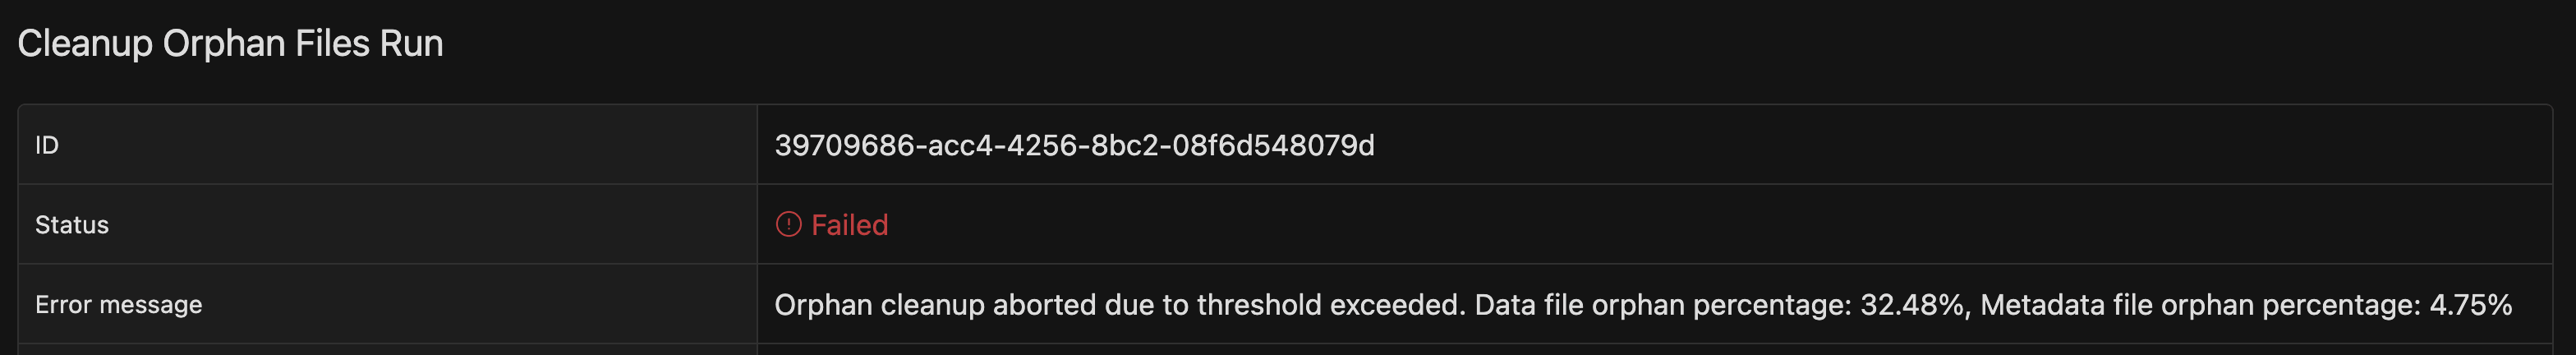
Clicking a run from either history view opens a dedicated detail page for that run. The page title reflects the operation (for example, Cleanup Orphan Files Run or Expire Snapshots Run) and lists ID, Status, Operation type, Triggered by, Reason, and timing fields.
For completed runs, the detail page also shows a Metrics table comparing values Before and After the run, so you can see exactly what changed.
Operations that were scheduled automatically also display the Reason that triggered them.
For failed runs, the detail page includes a dedicated Error message row that shows the full error text.
Metrics Per Operation
| Operation | Metrics (before/after) |
|---|---|
| Rewrite Data Files | Data File Count, Total File Size |
| Expire Snapshots | Snapshot Count |
| Rewrite Manifest Files | Manifest File Count, Manifest Total Size |
| Cleanup Orphan Files | Total Data File Count, Total Metadata File Count, Total Data File Size, Total Metadata File Size |
Manually Triggering an Operation
Run any maintenance operation on demand without waiting for the automated cycle. This is useful when testing your configuration or addressing an urgent performance issue.
- Go to Governance > Data Catalog from the side panel.
- Find and open the table details page:
- Data Catalog tab: Search for the table by name and click it.
- Data Explorer tab: Navigate through Catalog > Database > Table.
- Go to the Maintenance tab.
- Click the Trigger button in the top-right of the history list.
- In the modal, select the operation type from the dropdown.
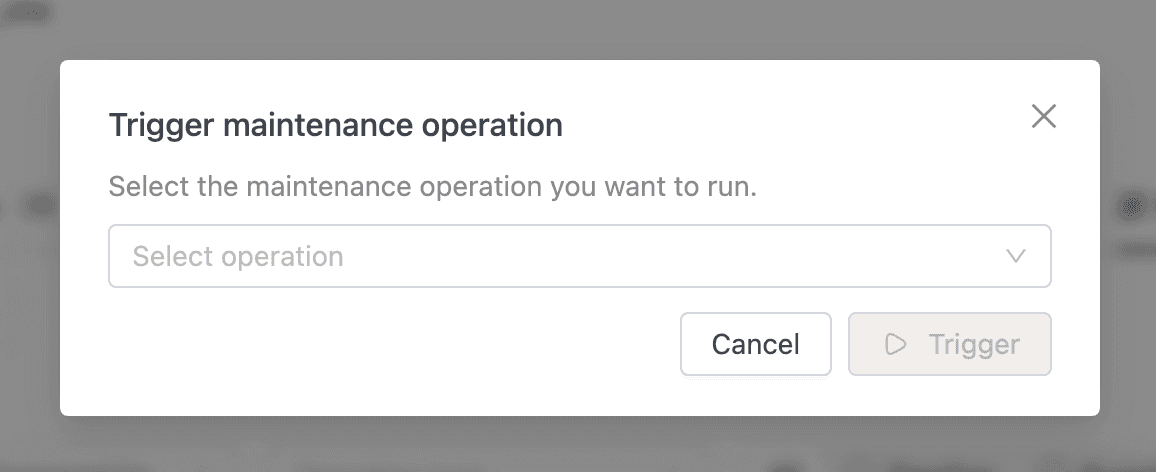
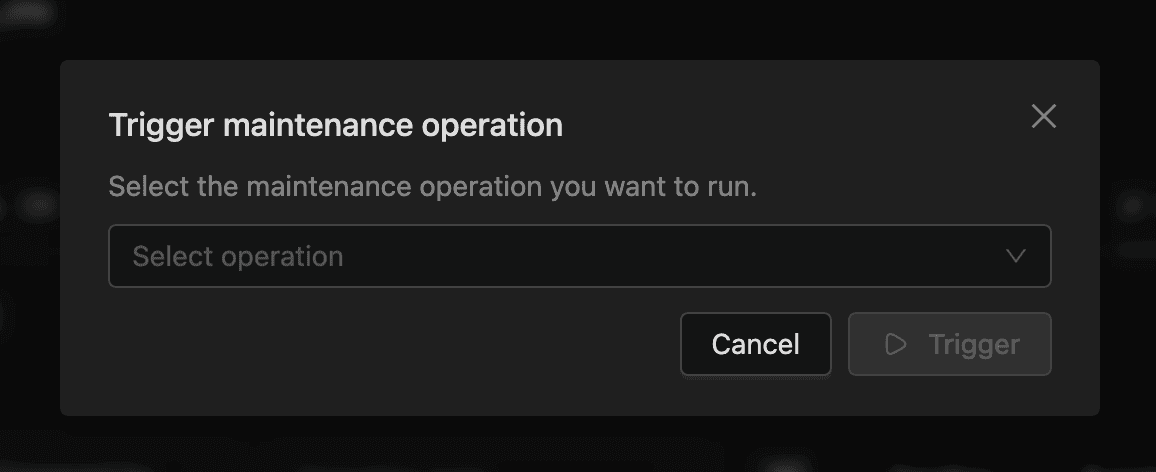
- Click Trigger to confirm.
The operation is queued immediately and shows up in the history list with a PENDING status. The history list refreshes automatically after the trigger succeeds.
- Both table maintenance and the specific operation must be enabled.
- If a job for the same table and operation is already pending or running, the trigger is rejected. Only one active job per table/operation is allowed at a time.