Monitoring - Grafana Dashboards
IOMETE comes equipped with a set of Grafana dashboards designed to monitor the platform's performance. These dashboards are available in the on-premises deployment GitHub repository. This document will guide you through the process of enabling monitoring on the IOMETE data plane, deploying the necessary components, and using the Grafana dashboards.
Prerequisites
Before setting up monitoring with IOMETE, ensure you have the following:
- Grafana: Installed and configured in your environment.
- Prometheus: Set up and running to collect metrics.
Enabling Monitoring
Before you can begin monitoring with Grafana, you must ensure that monitoring is enabled in your IOMETE data plane deployment. This is done by setting the monitoring.enabled flag to true.
monitoring:
  enabled: true
Enabling monitoring in IOMETE serves several purposes:
- Metrics Exposure: Once monitoring is enabled, all services within IOMETE begin exposing their metrics.
- Service Monitor and Pod Monitor: These are Prometheus-specific custom resources that are deployed when monitoring is enabled. If you're using the Prometheus Operator, it will automatically detect and configure itself to monitor these services.
- Prometheus Annotations: For those who use a plain Prometheus setup without the Prometheus Operator, IOMETE provides annotations that Prometheus can check instead of relying on service and pod monitors.
Deploying Grafana Dashboards
When monitoring is enabled, IOMETE automatically deploys Grafana dashboards as a ConfigMap. The deployment behavior varies depending on your setup:
For Prometheus Operator Setup:
If you are using the Prometheus Operator, the dashboards are automatically discovered and added to Grafana. No additional steps are required.
For Non-Prometheus Operator Setup:
If you are not using the Prometheus Operator, follow these steps to manually install the Grafana dashboards:
- Download the dashboard JSON files from the IOMETE GitHub repository.
- Access your Grafana instance.
- Navigate to "Dashboards" -> "Import" in the Grafana UI.
- Click on "Upload JSON file" and select the downloaded dashboard file.
- Configure the data source to point to your Prometheus instance.
- Click "Import" to finalize the process.
- Repeat these steps for each dashboard you want to install.
Grafana Dashboards
IOMETE provides the following Grafana dashboards for monitoring
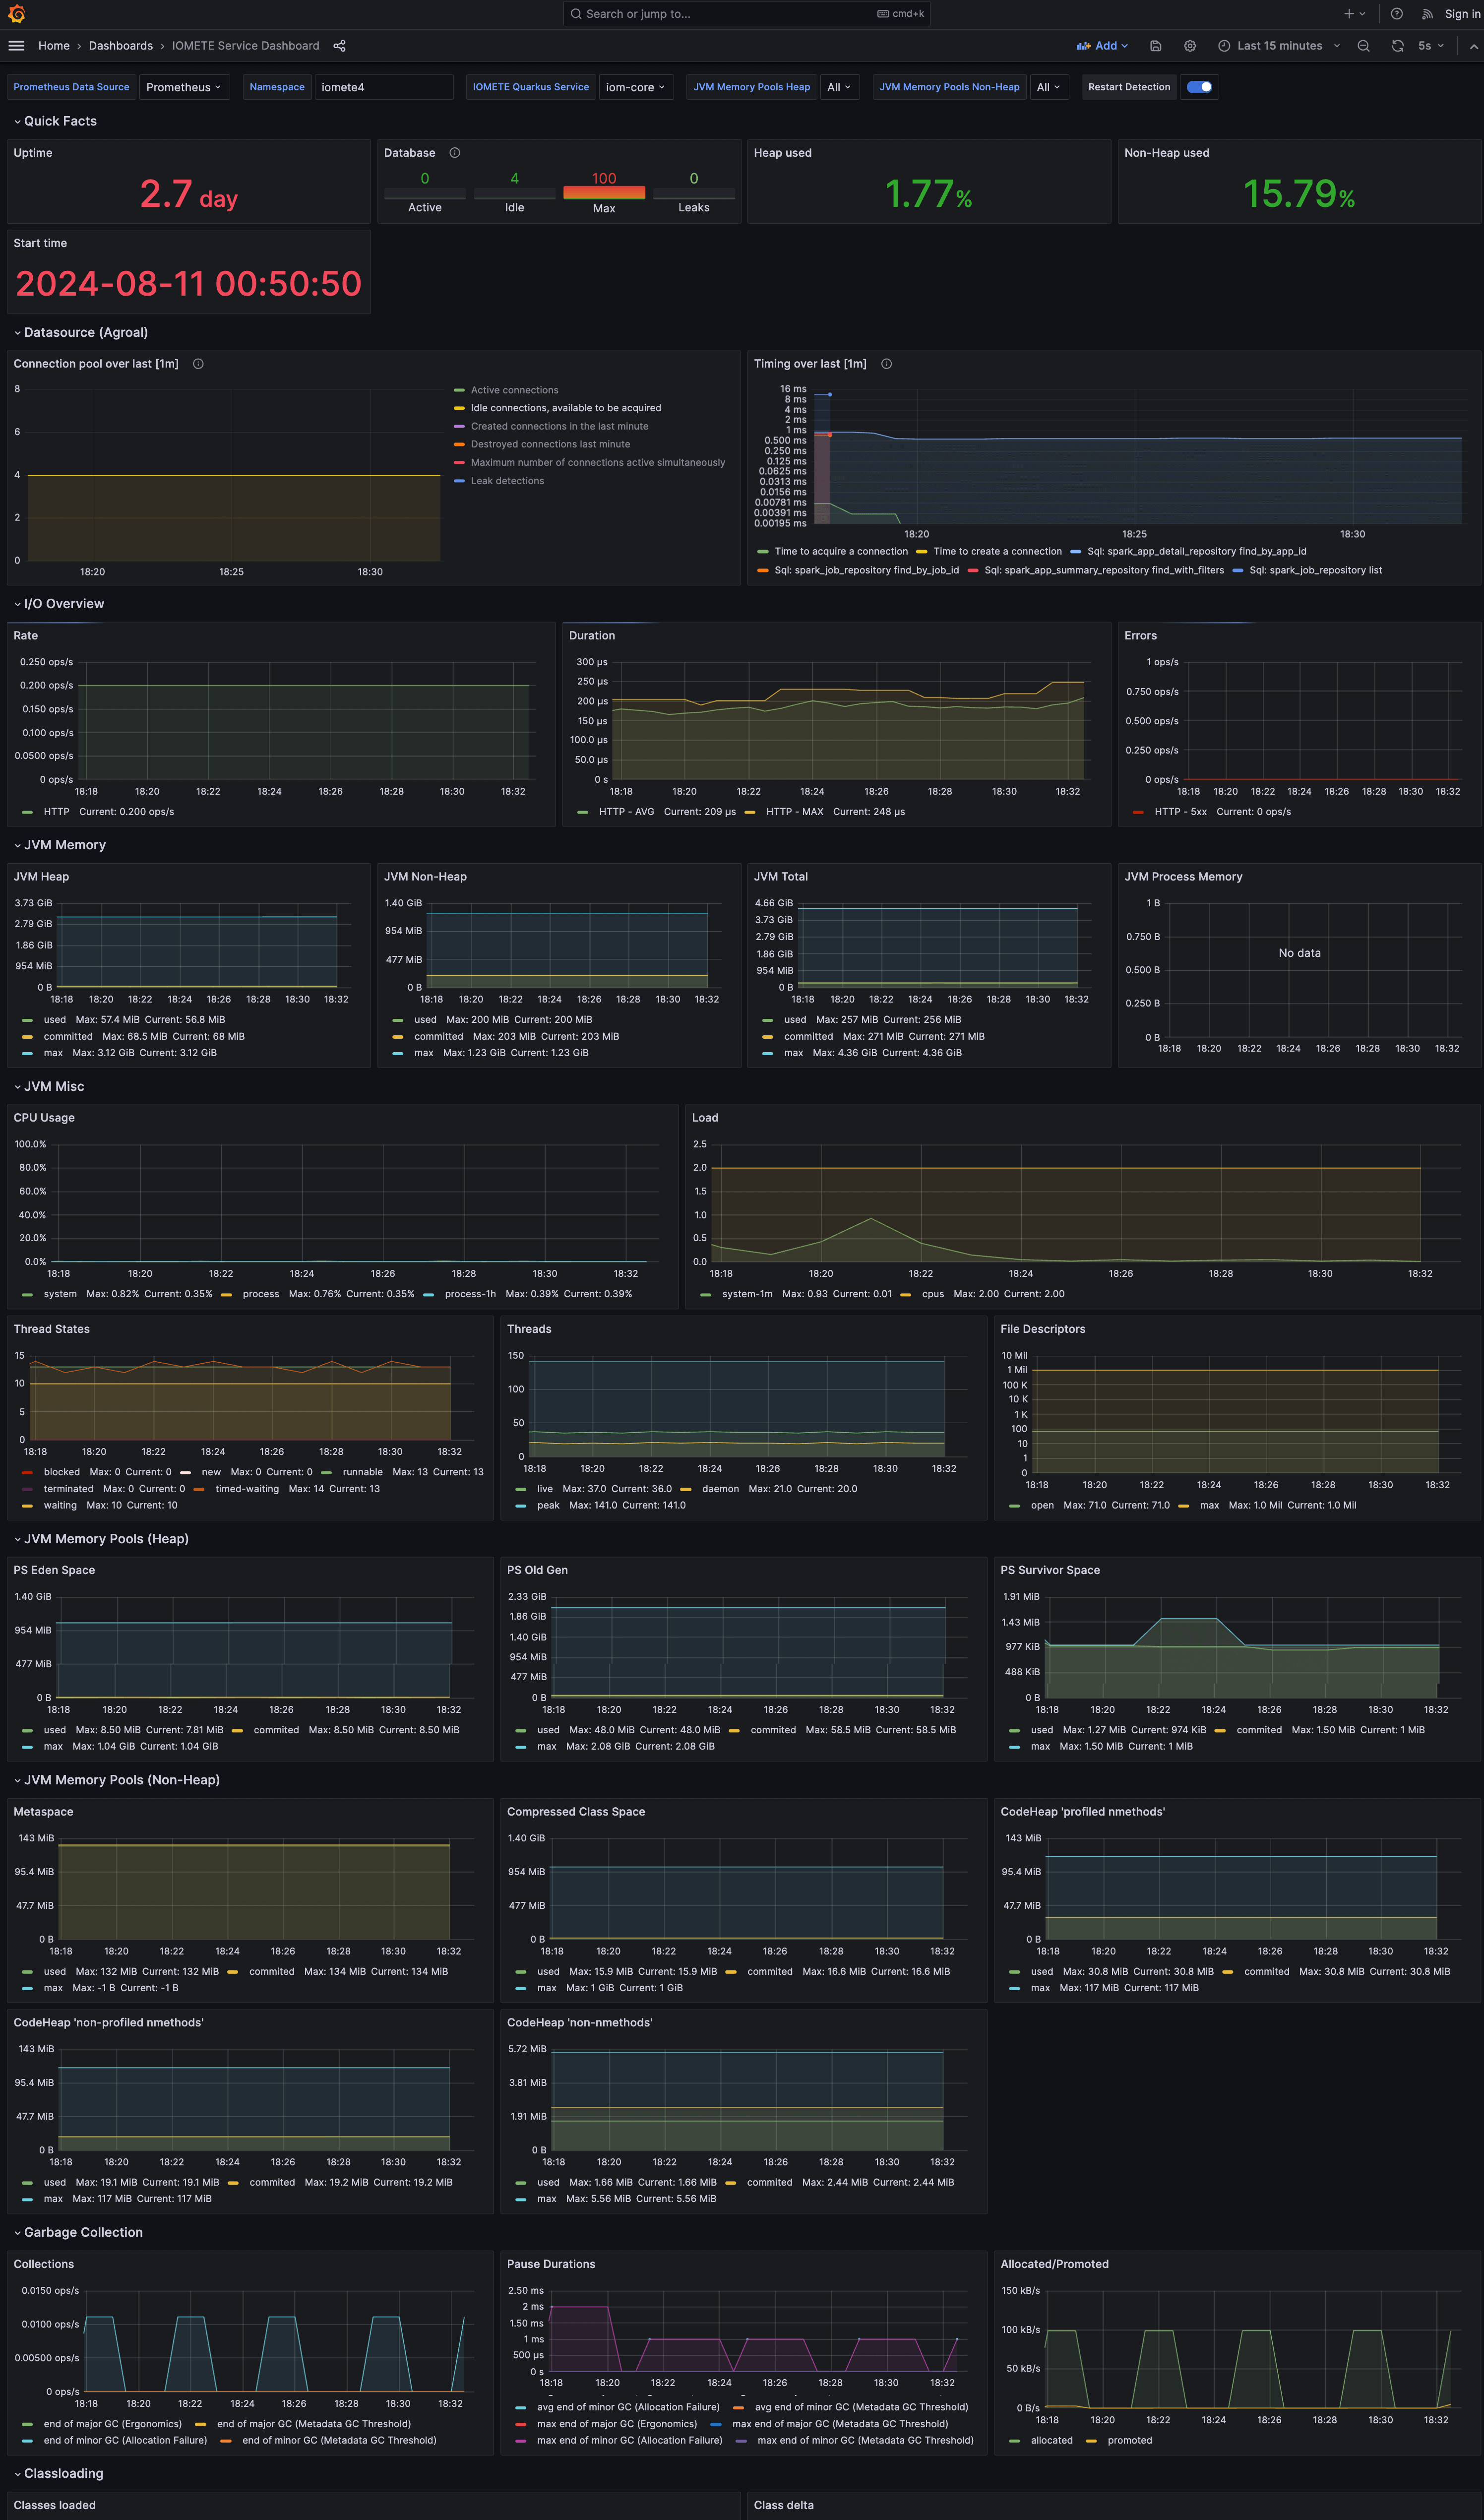
IOMETE Service Dashboard
This is a generic dashboard for monitoring all internal IOMETE services. It provides detailed information about the core services, including IOMETE Core Service, IOMETE SQL Service, and IOMETE Identity Service. Download the Grafana json file from IOMETE Service Dashboard.
To install the IOMETE Service Dashboard
If you are not using the Prometheus Operator, you can manually install the IAM Service Dashboard by following these steps:
- Download the Grafana json file from the link provided above.
- Go to your Grafana -> Dashboards -> Import.
- Upload the downloaded json file and click
Import.
You can see the IOMETE Service Dashboard in your Grafana dashboard list.

Spark Operator Dashboard
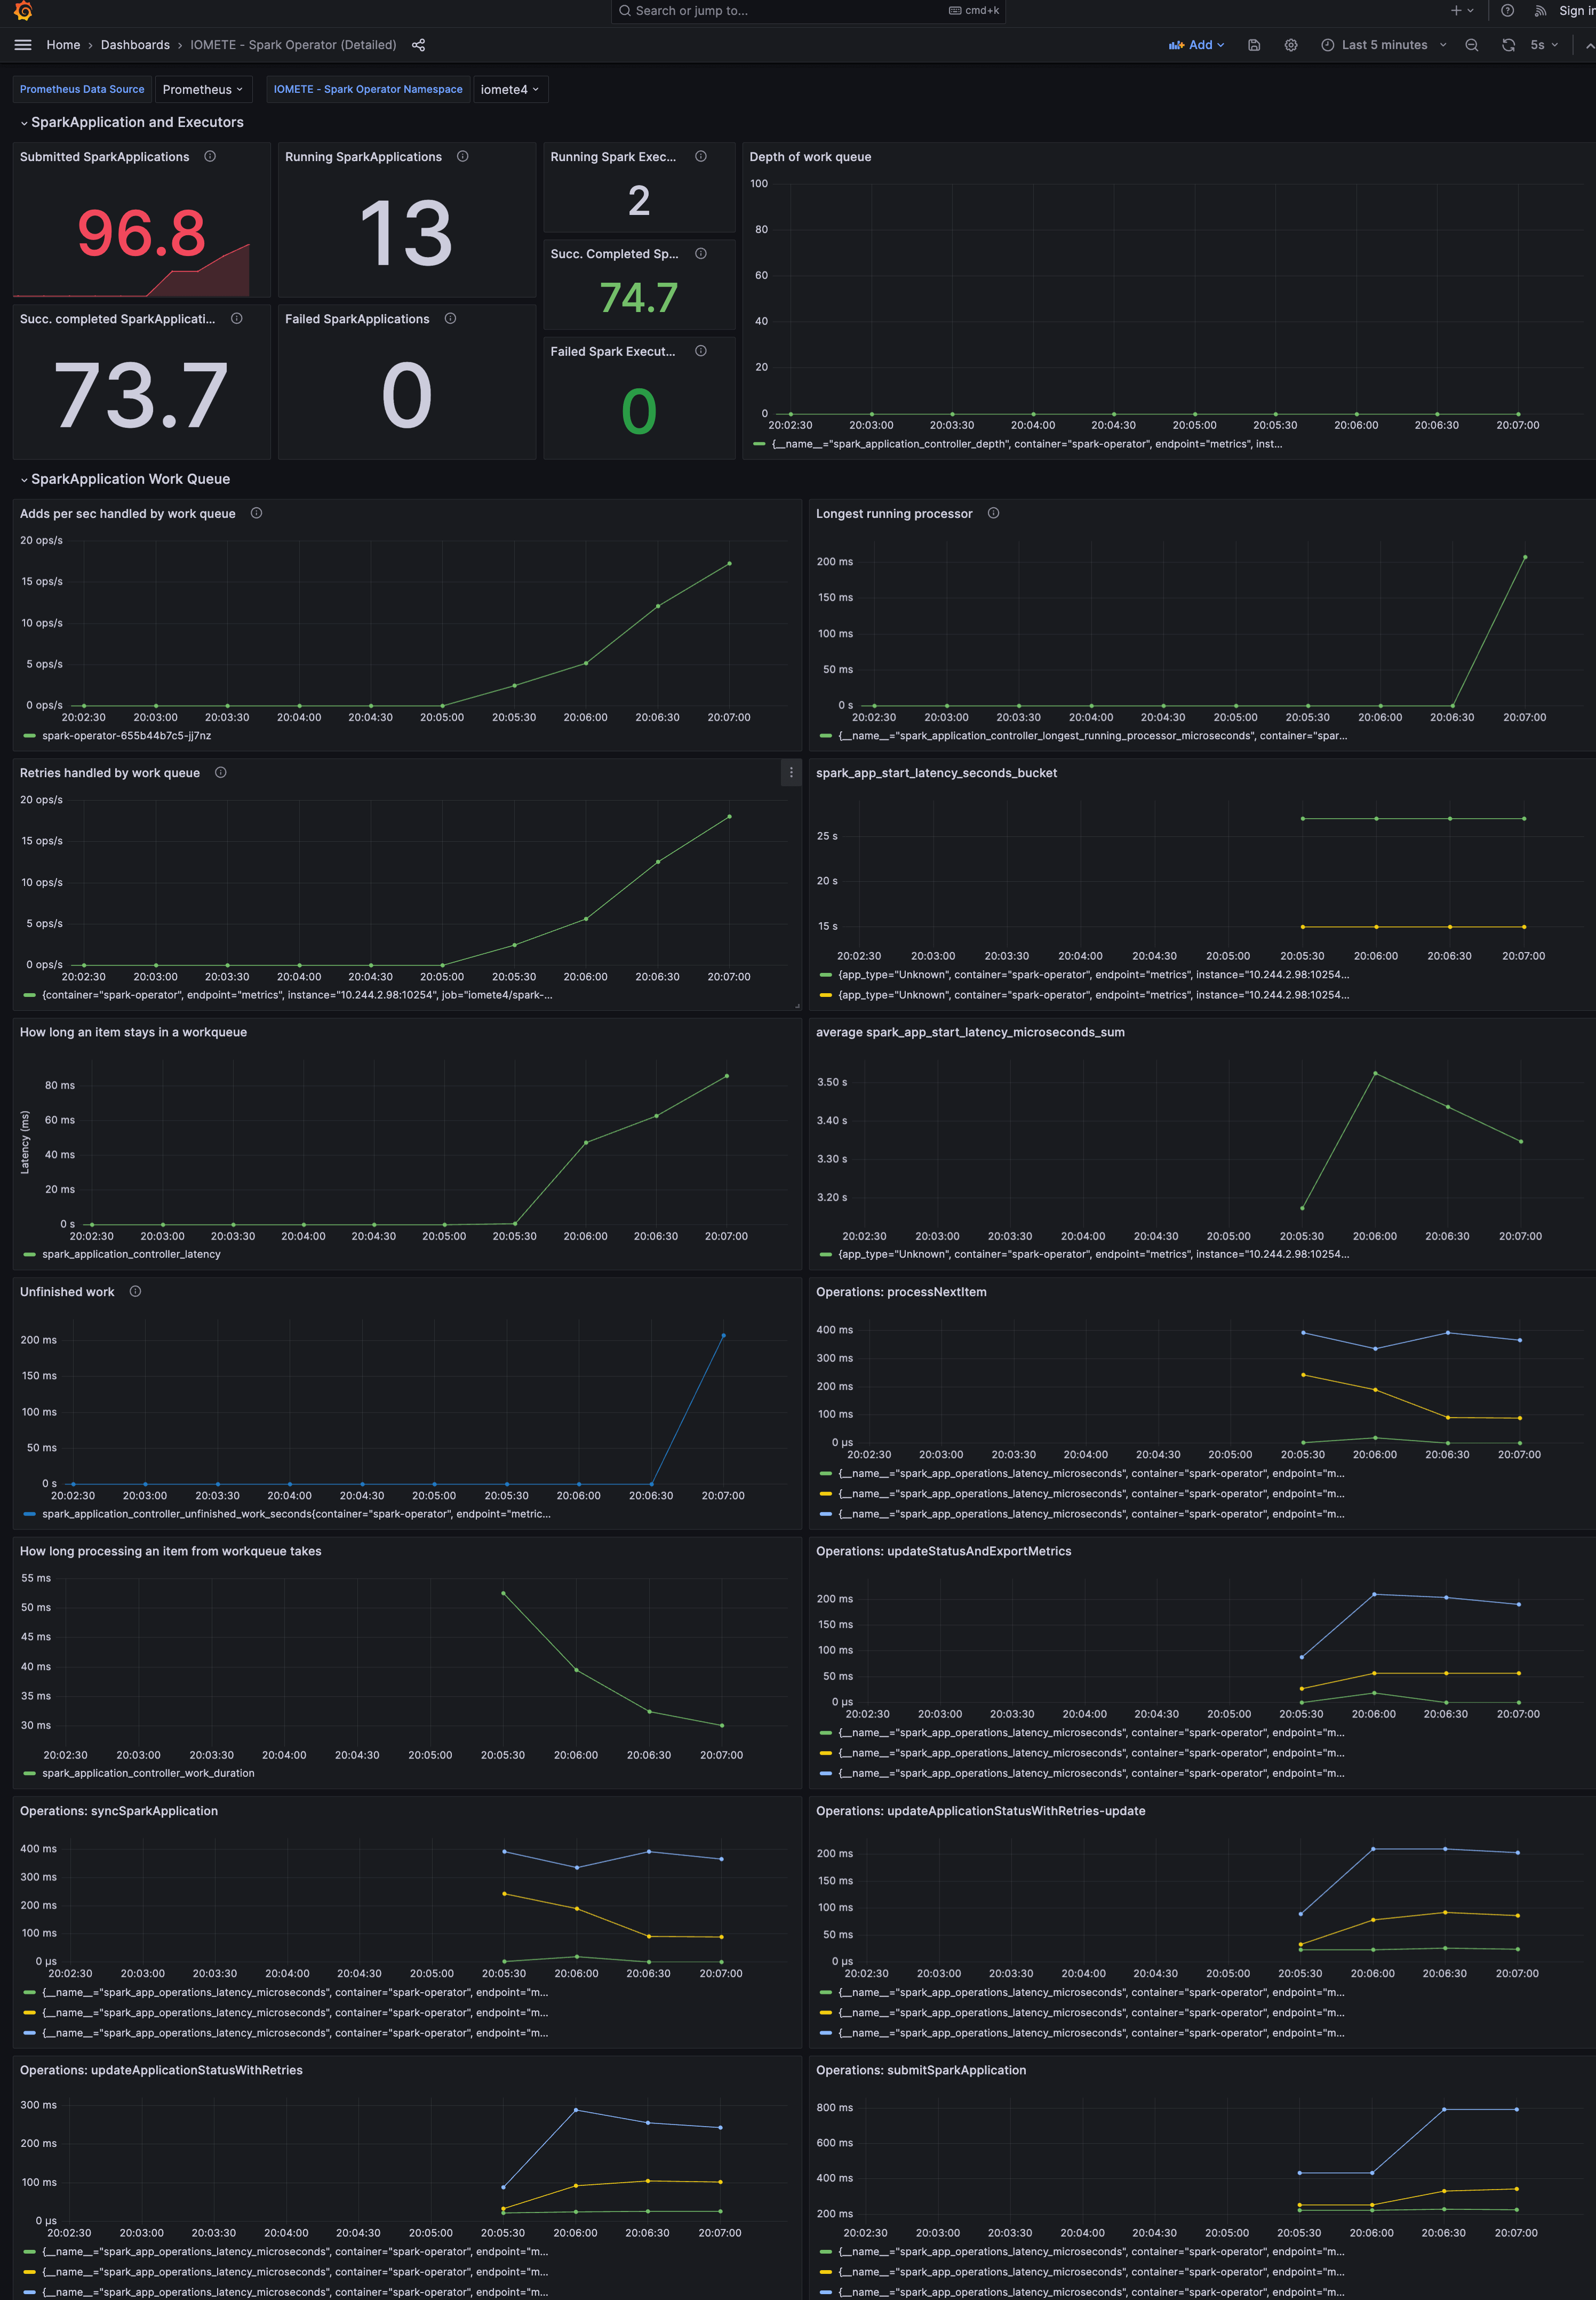
This dashboard provides in-depth details about the Spark Operator. It is crucial for monitoring the performance and behavior of Spark operations within IOMETE.
Download the Grafana json file from Spark Operator Dashboard.
Install the Spark Operator Dashboard by following the same steps as the IOMETE Service Dashboard. Once installed, you can see the Spark Operator Dashboard as shown below.

IOMETE Job Metrics Dashboard
The IOMETE Job Metrics Dashboard is a unique tool in our monitoring suite, designed with a specific purpose in mind. Unlike our other dashboards that give you a broad view of the system, this one zooms in on individual Spark jobs. It's like having a magnifying glass that lets you examine each job up close.
When you're working with IOMETE, you might find yourself wondering about the performance of a particular Spark job. Maybe it's running slower than you expected, or you're just curious about how efficiently it's using resources. This is where the Job Metrics Dashboard comes into play.
You won't find this dashboard useful by simply browsing through Grafana. Instead, it's seamlessly integrated into the IOMETE application itself. When you're looking at the details of a Spark job in IOMETE, you'll see a "Metrics" link. Clicking this link is like opening a window into that job's performance world.


What makes this dashboard special is how it automatically adapts to the job you're viewing. You don't need to fiddle with time ranges or search for the right job name. The dashboard knows exactly which job you're interested in and adjusts itself accordingly.
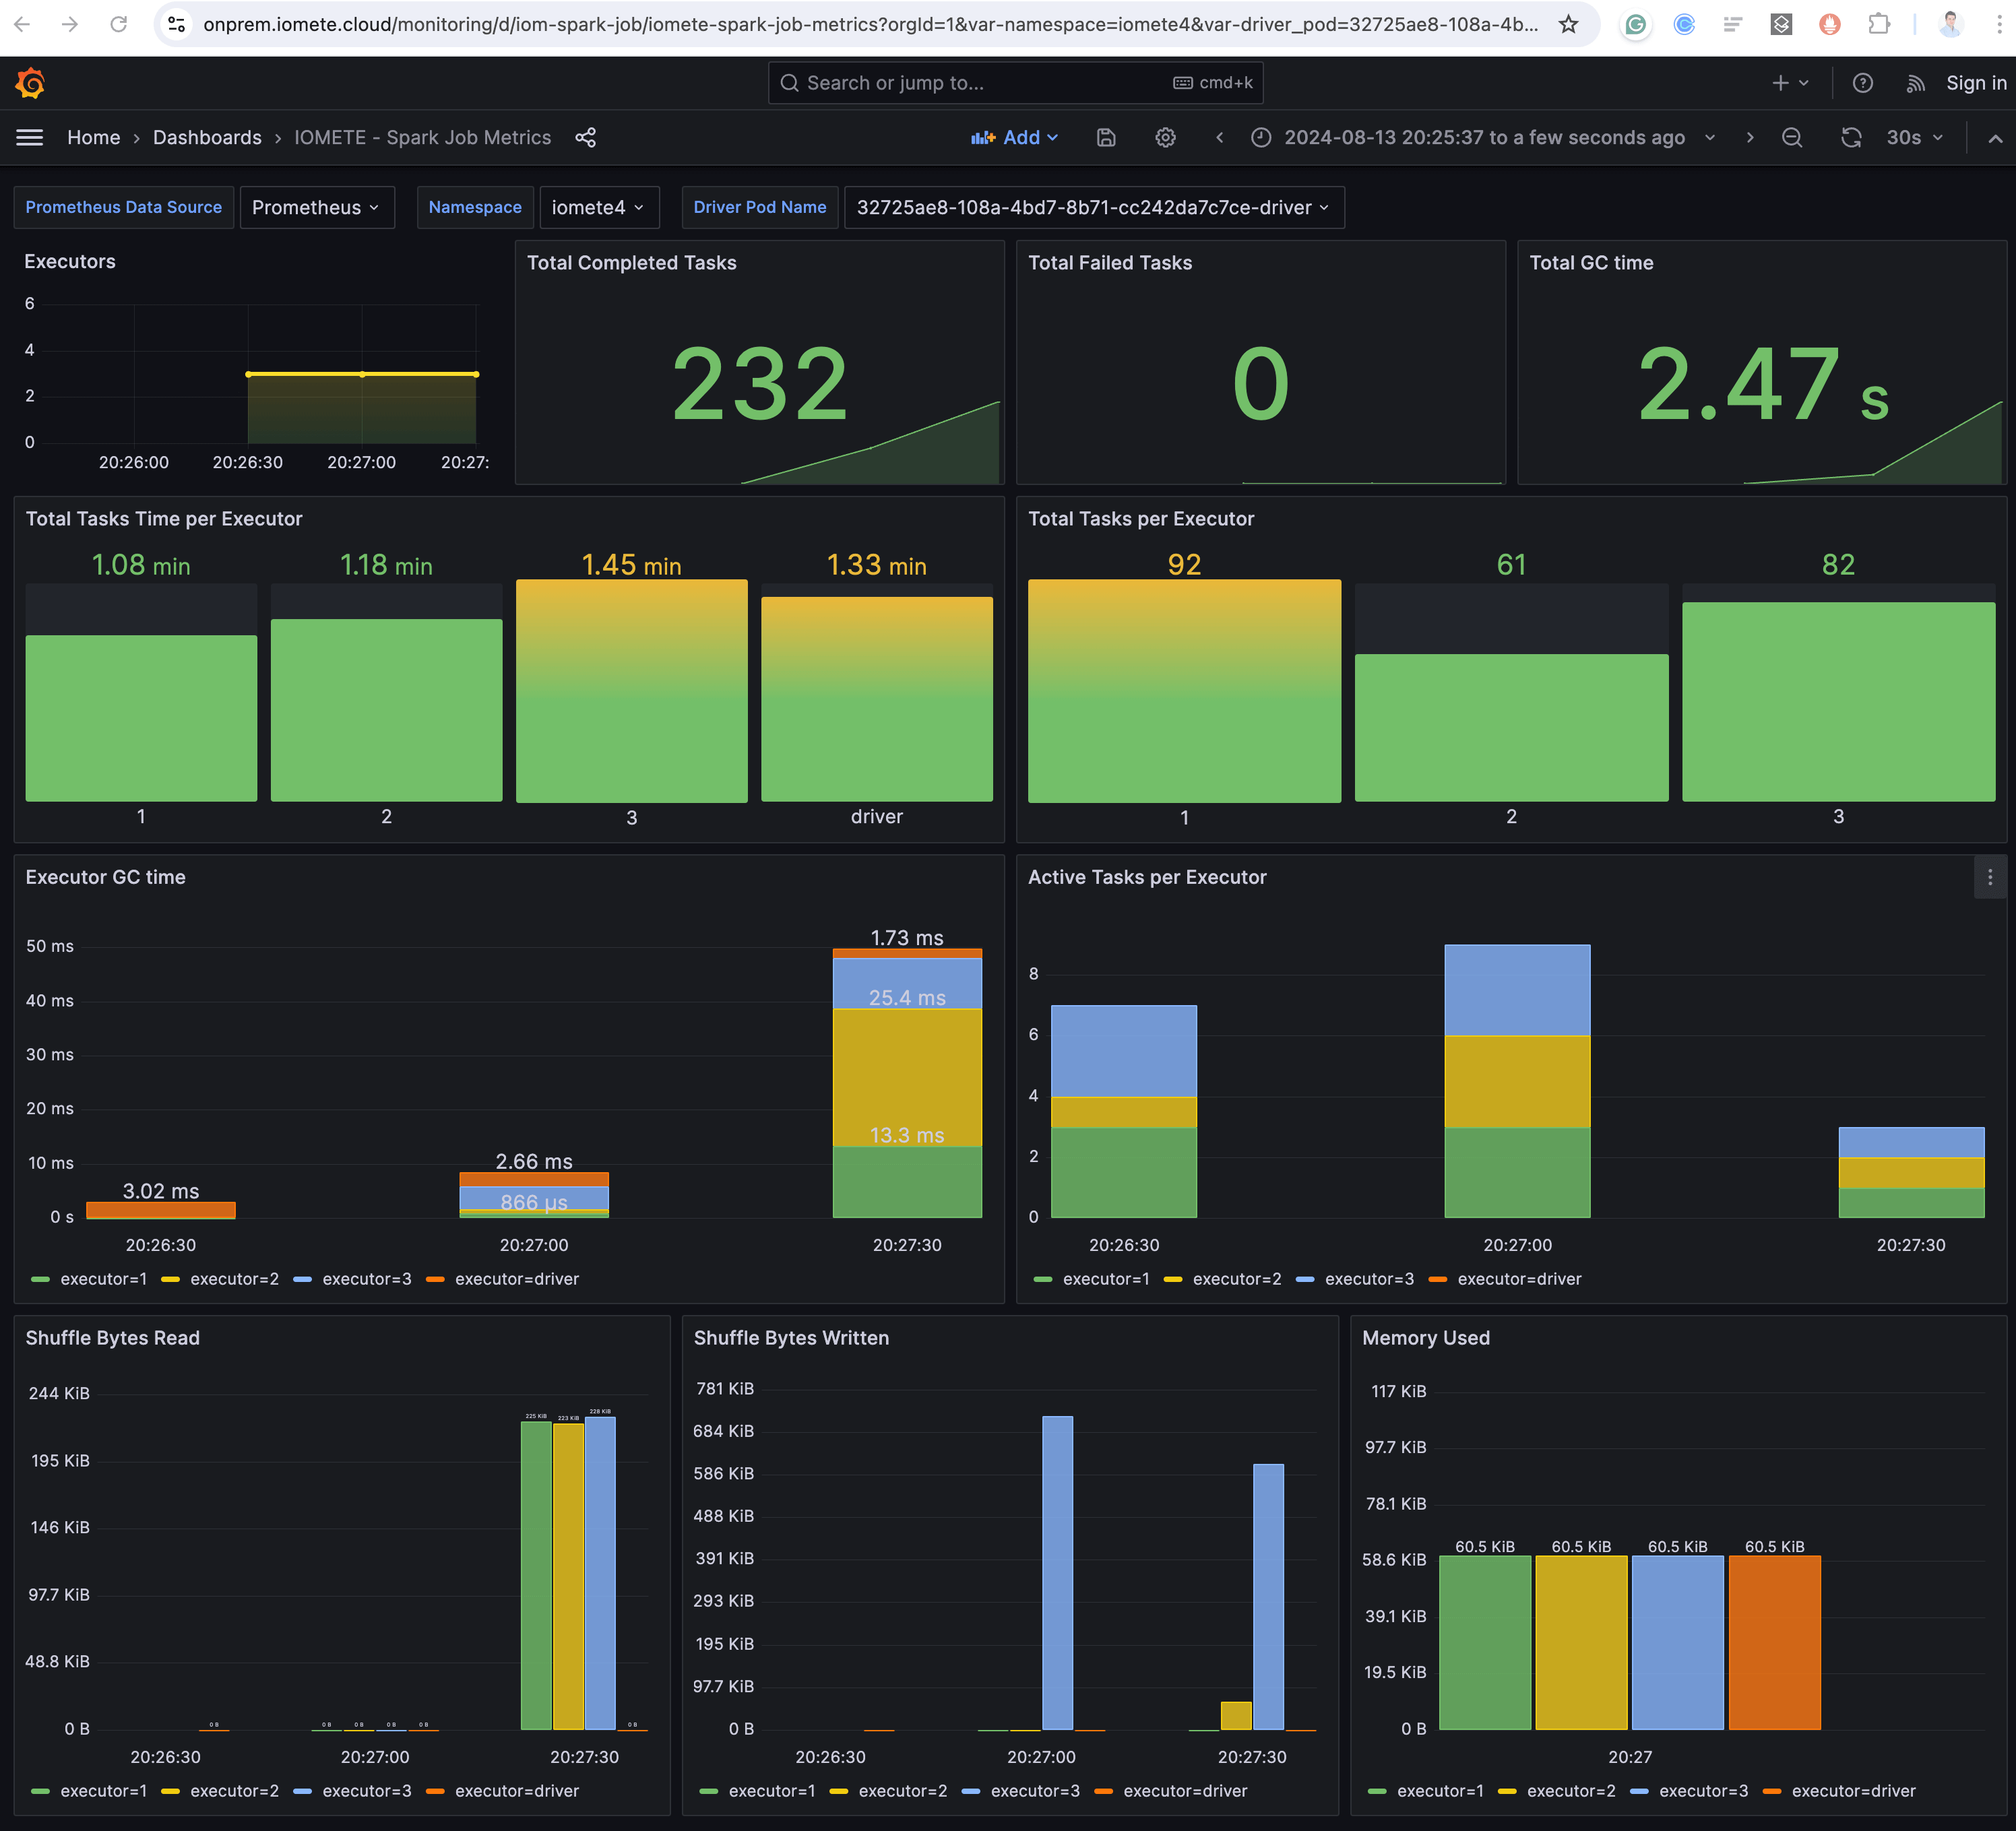

The dashboard is divided into several panels, each showing different aspects of your job's performance:
-
Overview Metrics:
- Executors: Shows how many executors are running for your job.
- Total Completed Tasks: A big number showing how many tasks have finished successfully.
- Total Failed Tasks: Ideally, this should be zero, indicating no tasks have failed.
- Total GC Time: This shows how much time has been spent on garbage collection.
-
Executor Performance:
- Total Tasks Time per Executor: A bar chart showing how long each executor has been working.
- Total Tasks per Executor: Another bar chart displaying how many tasks each executor has processed.
-
Detailed Metrics:
- Executor GC Time: A graph showing garbage collection time for each executor over time.
- Active Tasks per Executor: A stacked bar chart indicating how many tasks are actively running on each executor.
-
I/O and Memory Metrics:
- Shuffle Bytes Read: A graph showing how much data each executor has read during shuffle operations.
- Shuffle Bytes Written: Similar to the read graph, but for data written during shuffles.
- Memory Used: A bar chart displaying memory usage across all executors and the driver.
All these metrics are updated in real-time, giving you a live view of your job's performance.
You may encounter situations where the dashboard appears to be empty, particularly for Spark jobs that are short-running or complete in less than 1-2 minutes. This occurs because the job finishes so quickly that there isn’t enough data collected to populate the dashboard effectively.


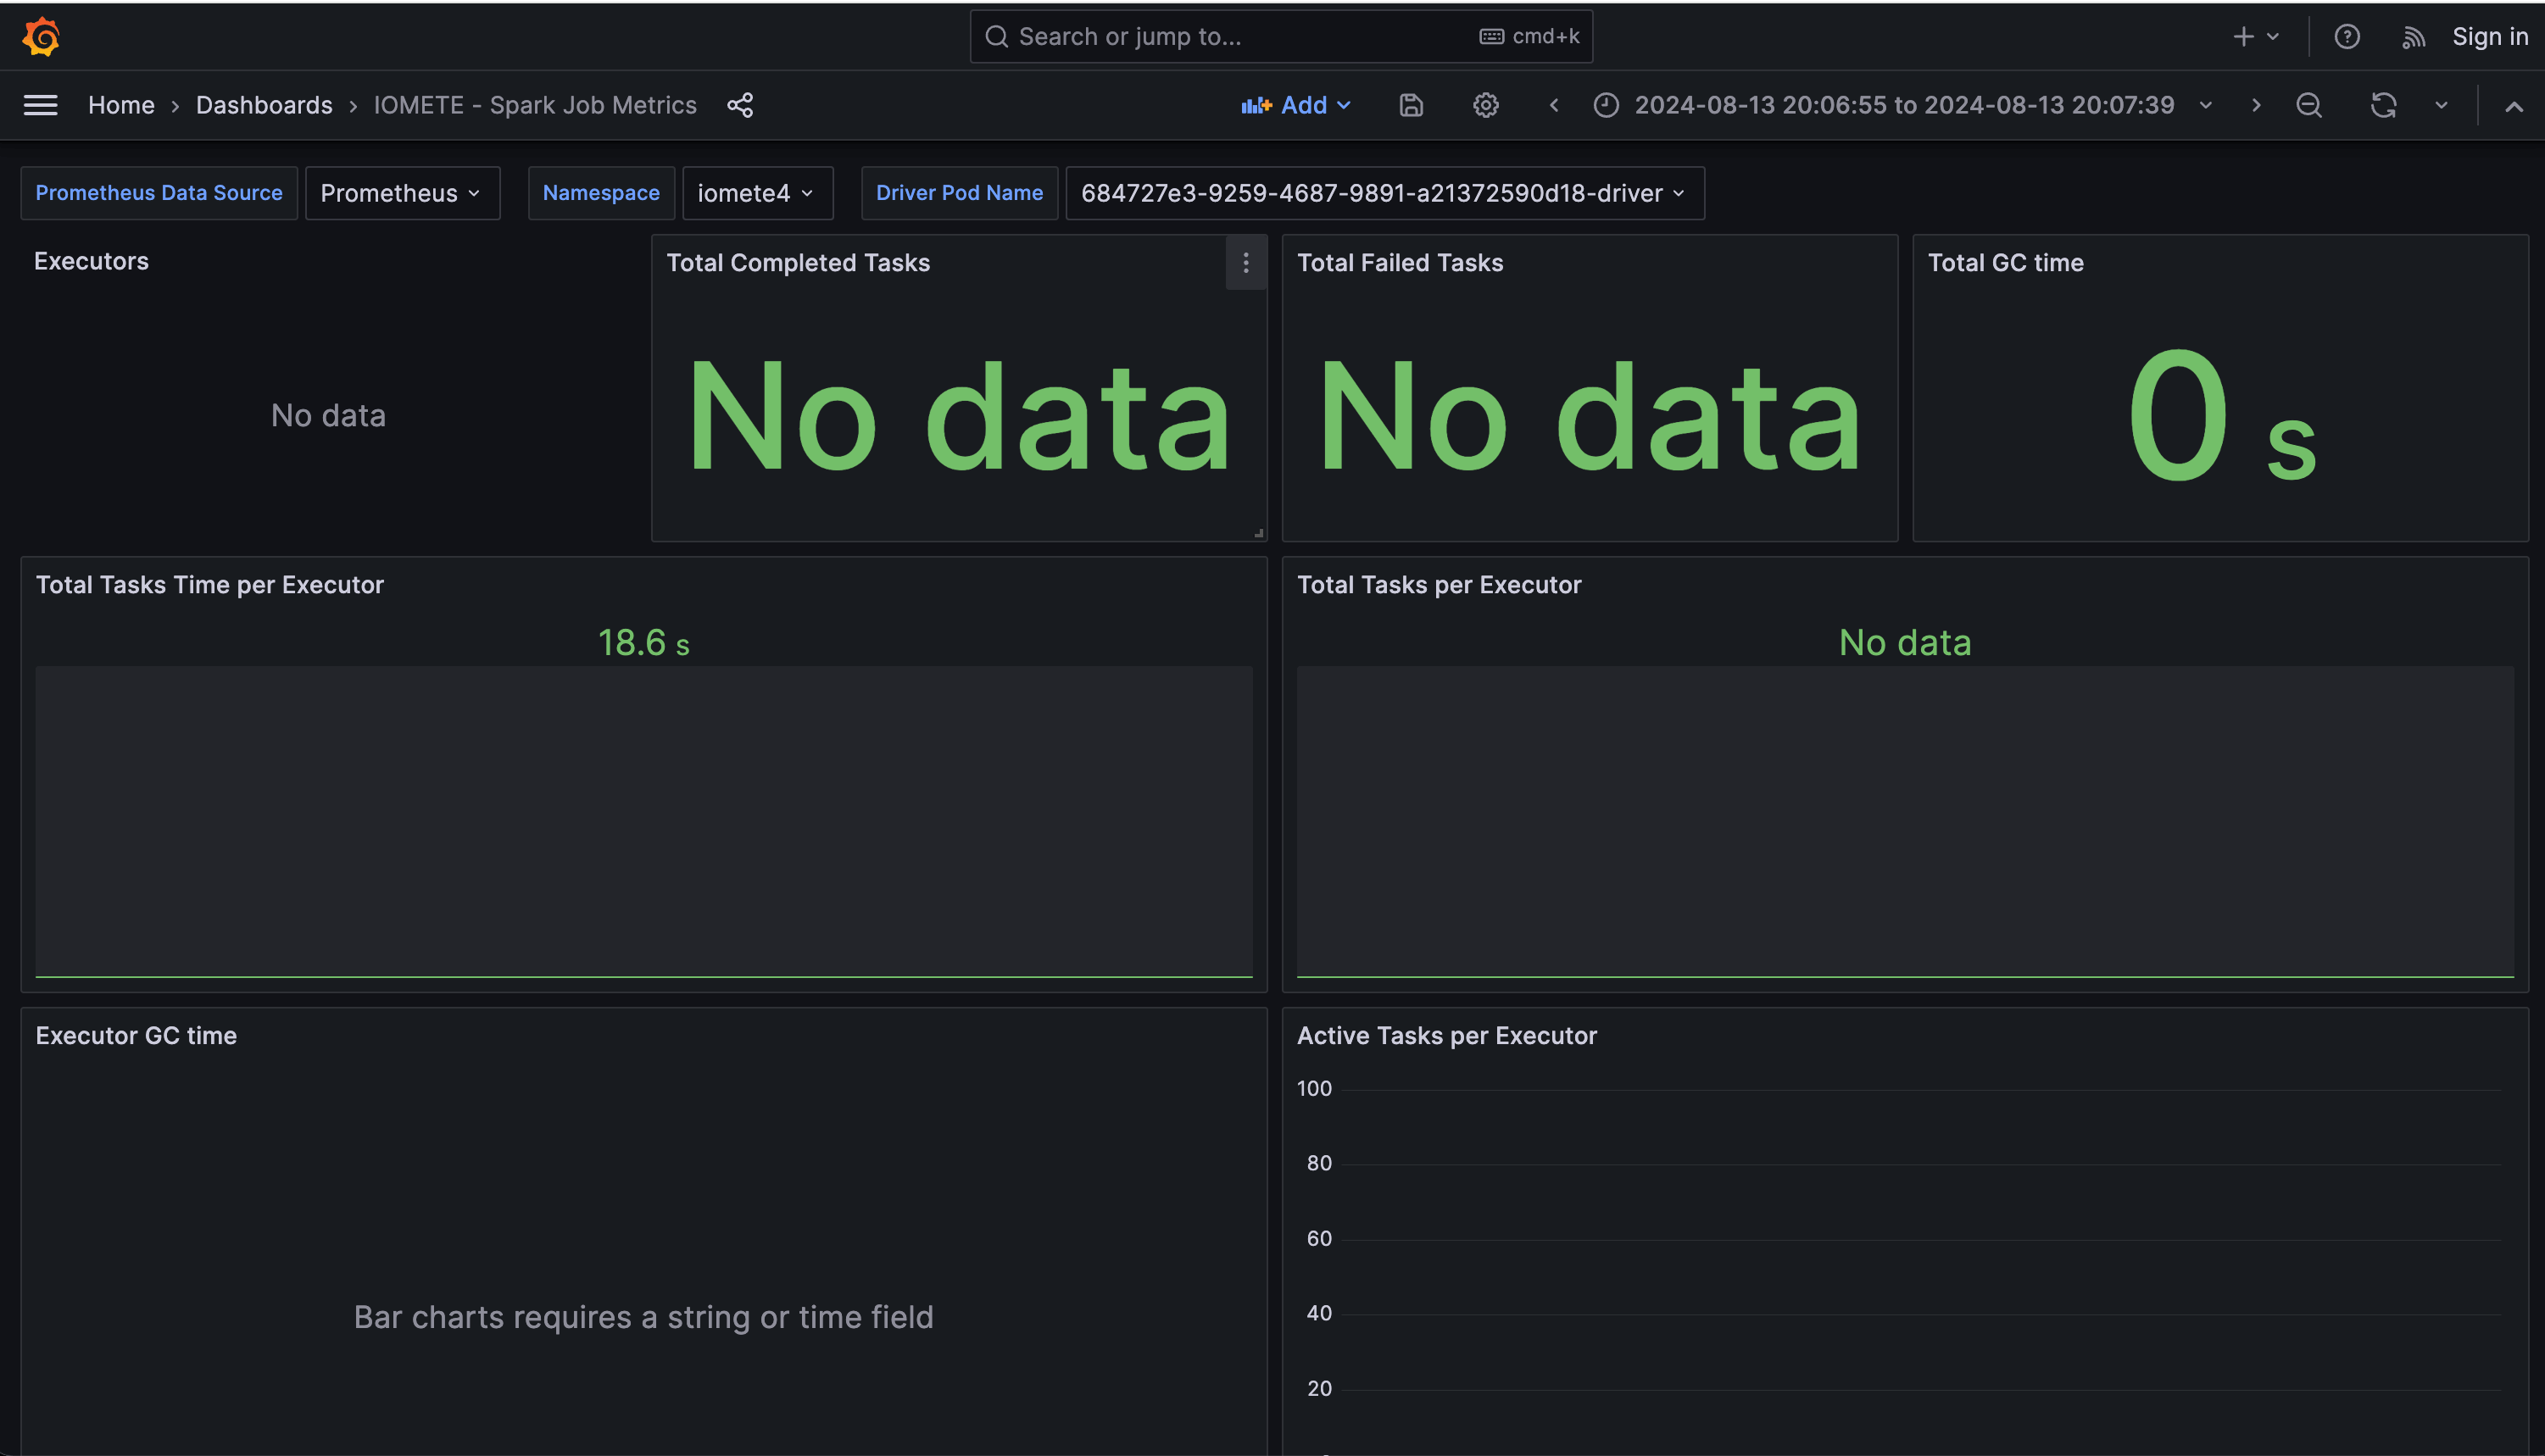

This isn’t a problem, as jobs that complete quickly are generally not the focus of detailed performance analysis. These jobs are already optimized for speed, and their rapid completion means there’s typically little to investigate. The primary value of this dashboard lies in analyzing longer-running jobs, where understanding detailed performance metrics is crucial for optimization and troubleshooting.
Setting Up the Job Metrics Dashboard
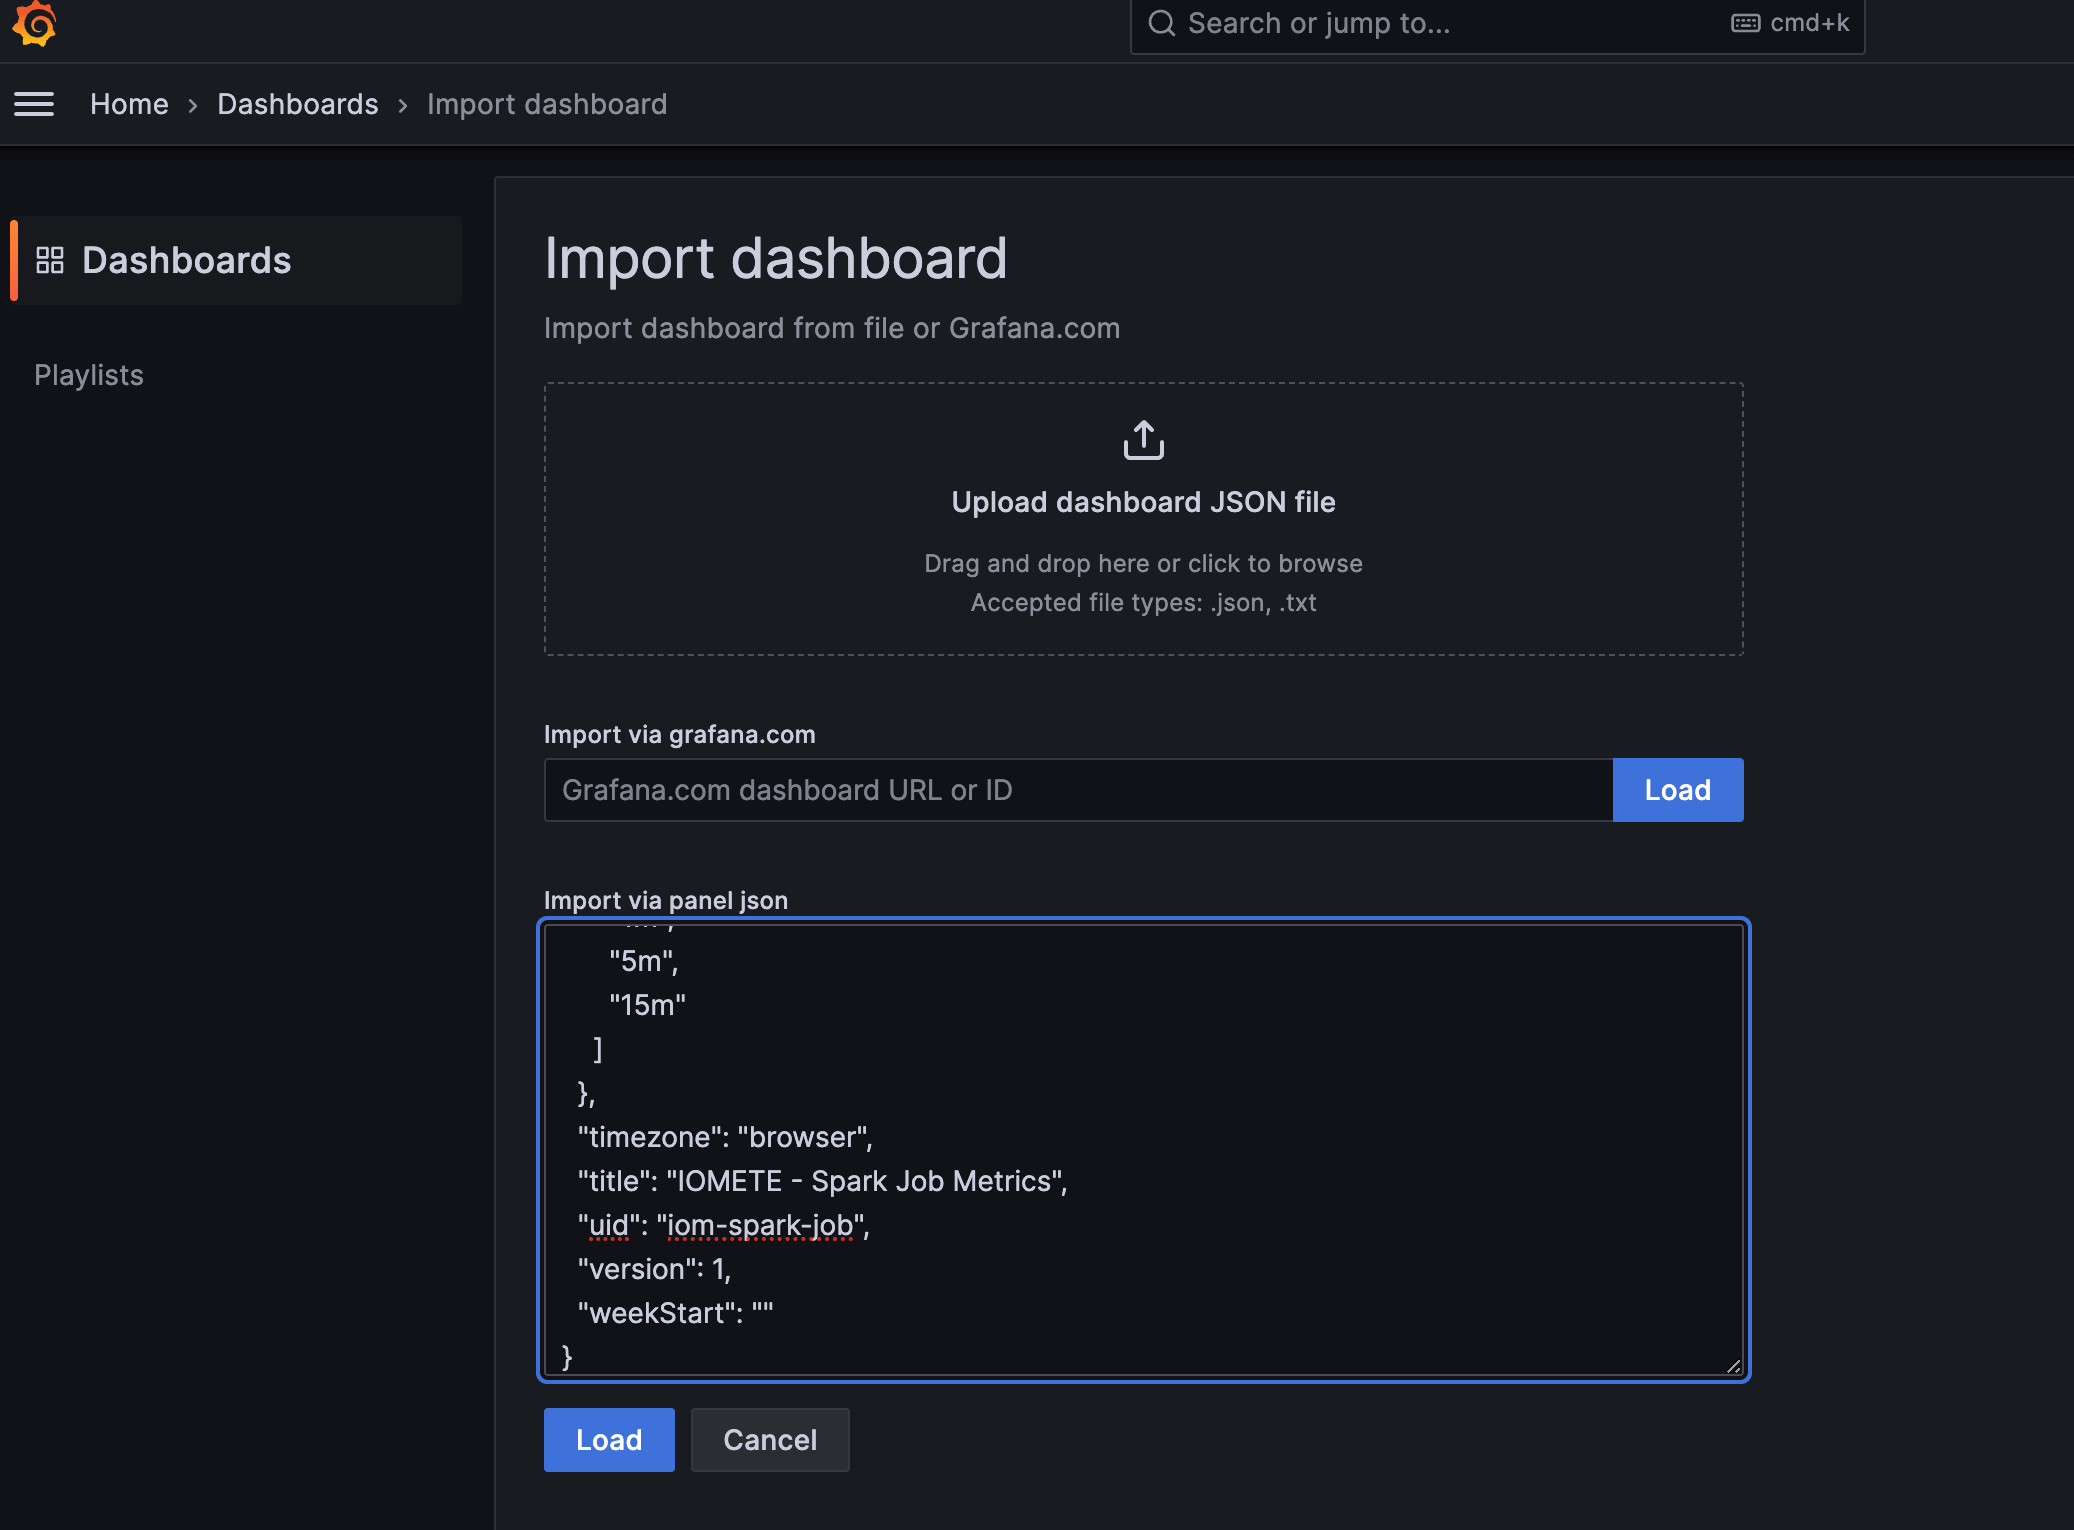
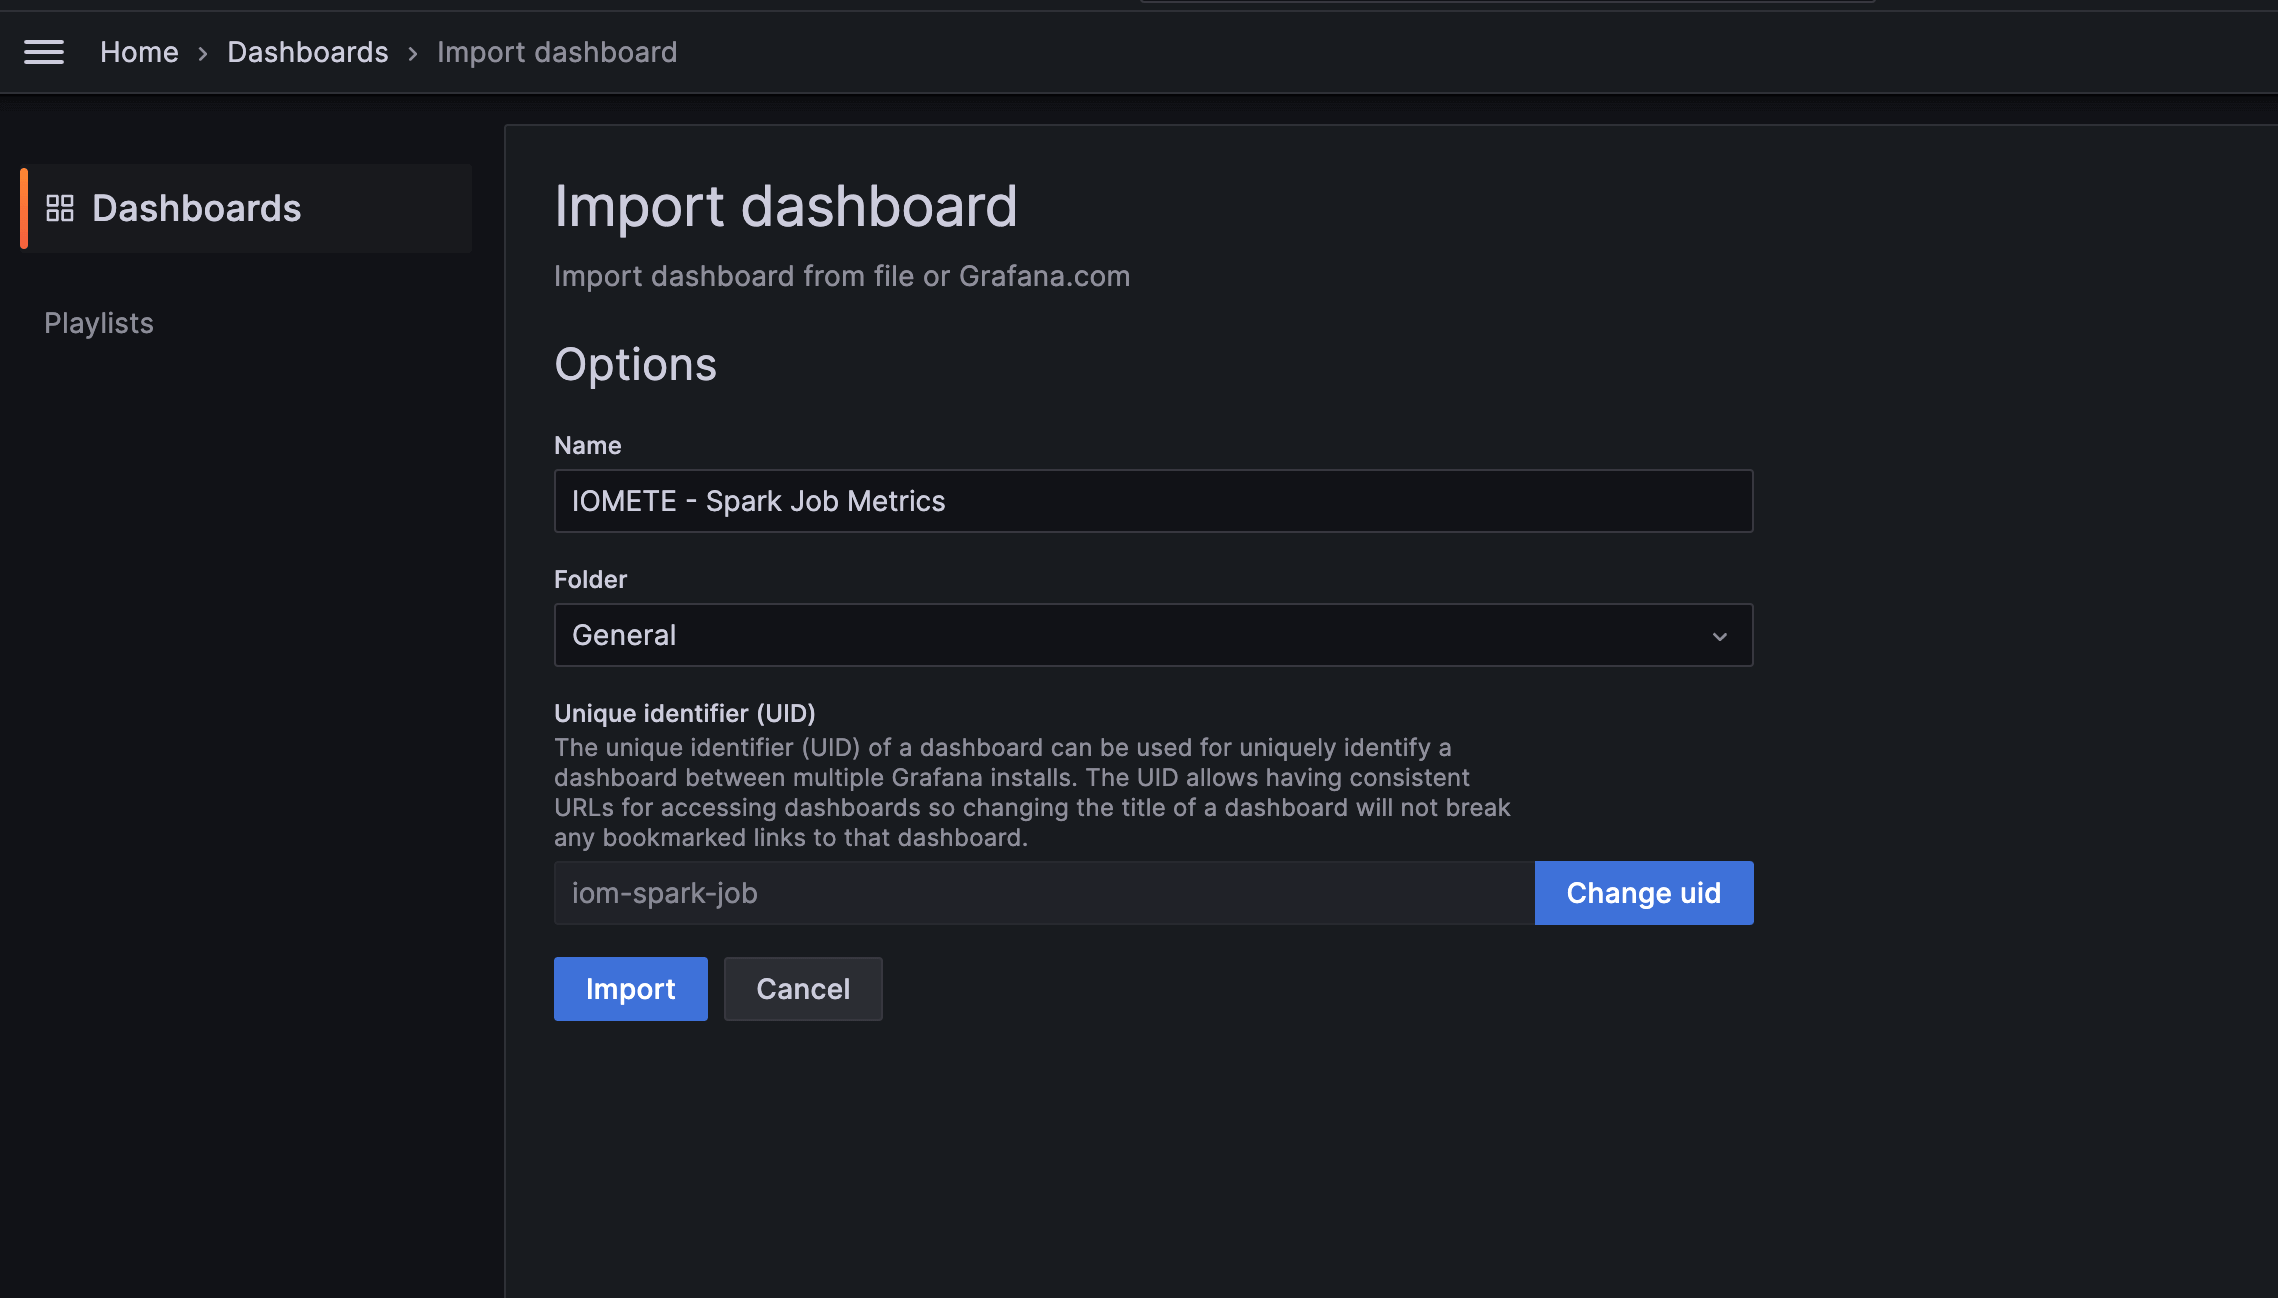
1. Import the Grafana
Import the Grafana json file from IOMETE Job Metrics Dashboard


2. Register the Dashboard in IOMETE
We need tell IOMETE where to find the Spark job metrics dashboard. In this way, when you click the "Metrics" link in IOMETE, it will open the Grafana dashboard with the correct job details.
2.1. Copy Grafana Dashboard URL


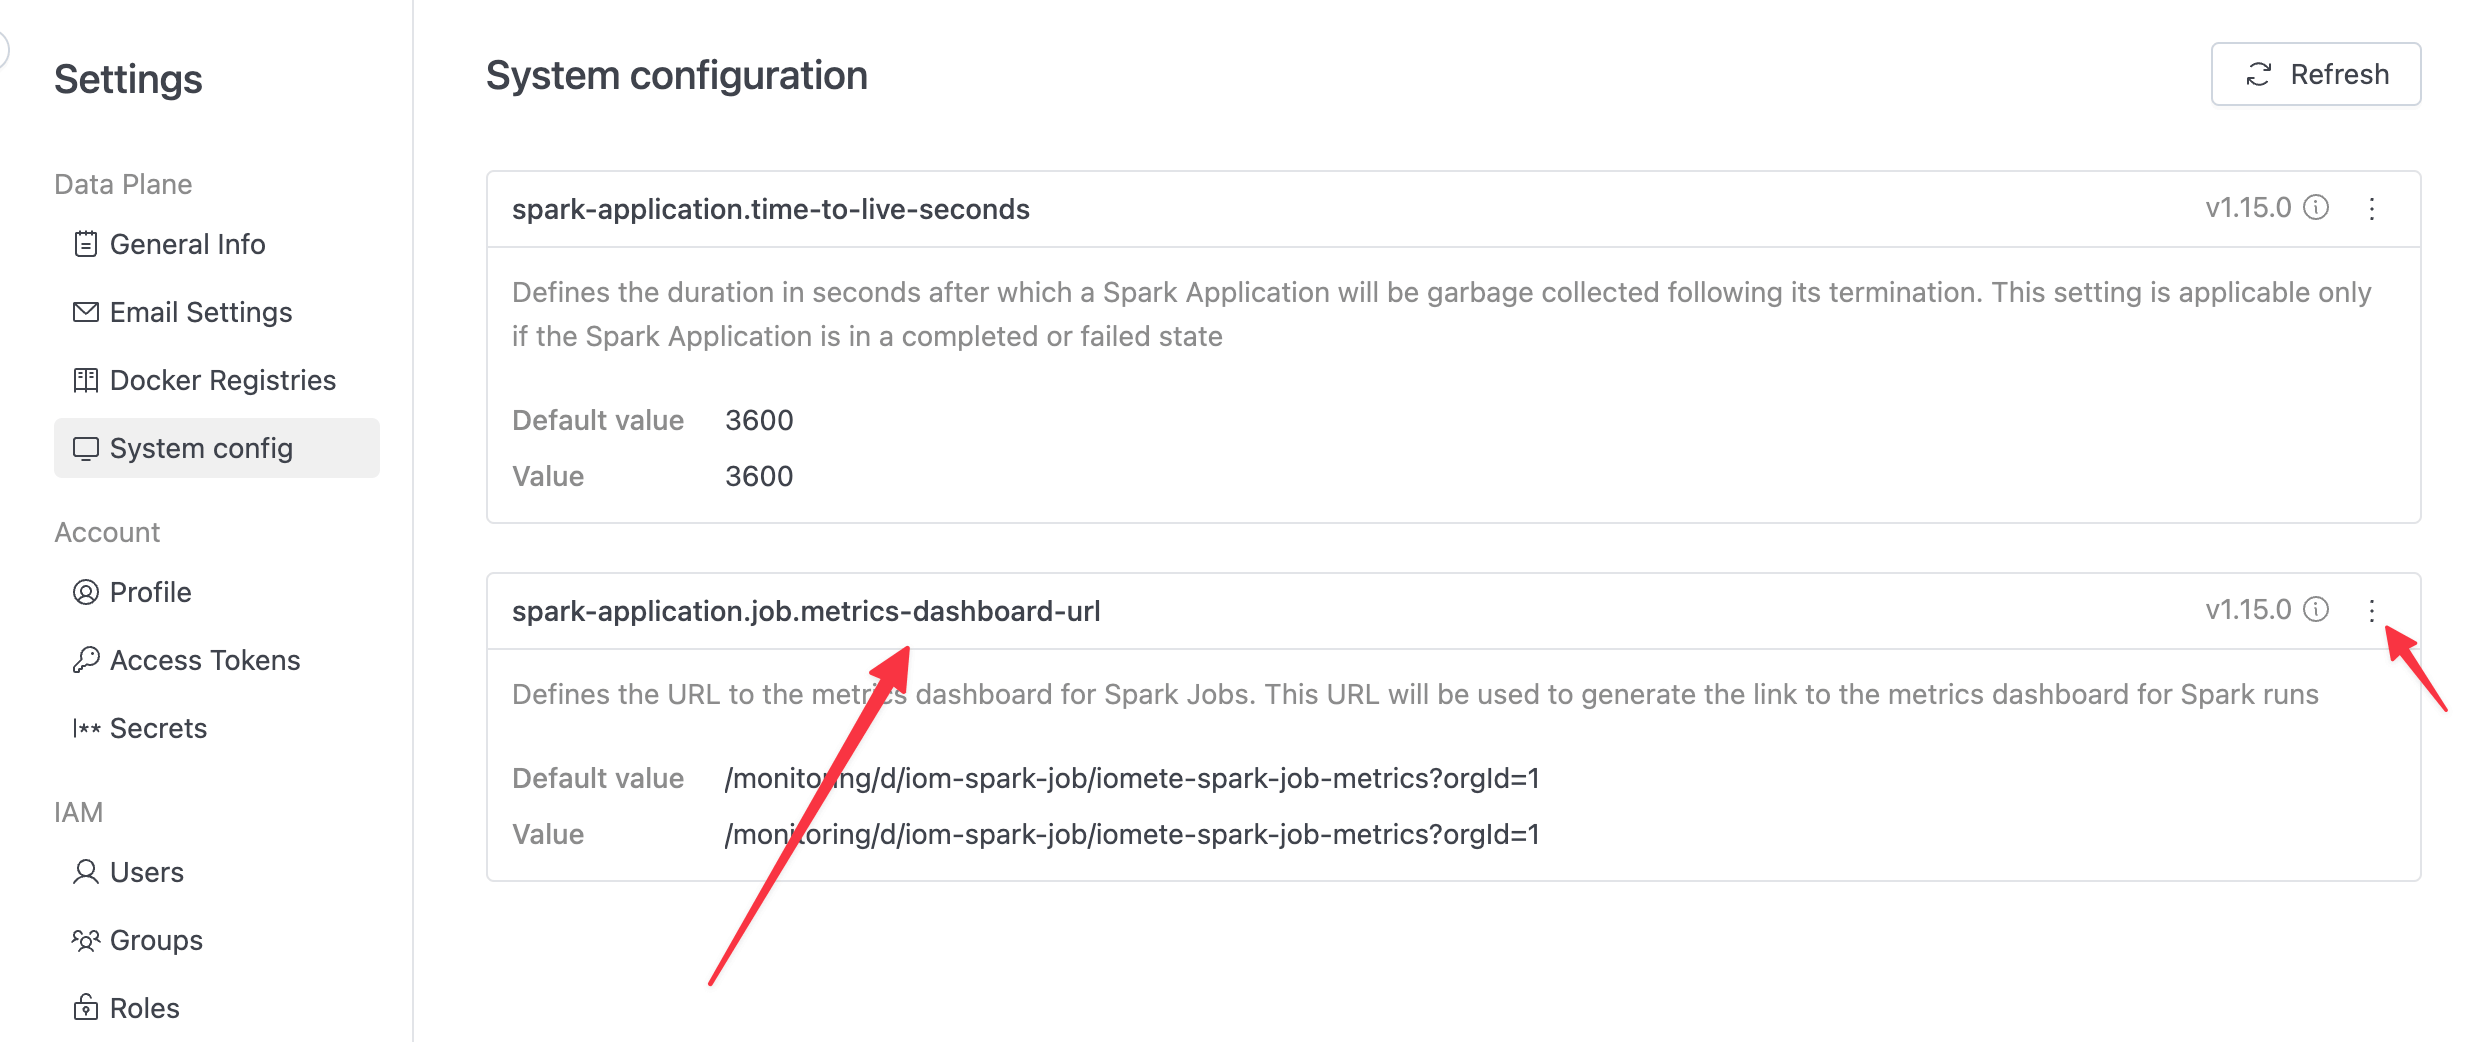
2.2. Register in IOMETE
Go to IOMETE -> Settings -> System Config -> spark-application.job.metrics-dashboard-url and update the URL to external grafana dashboard you copied from the previous step

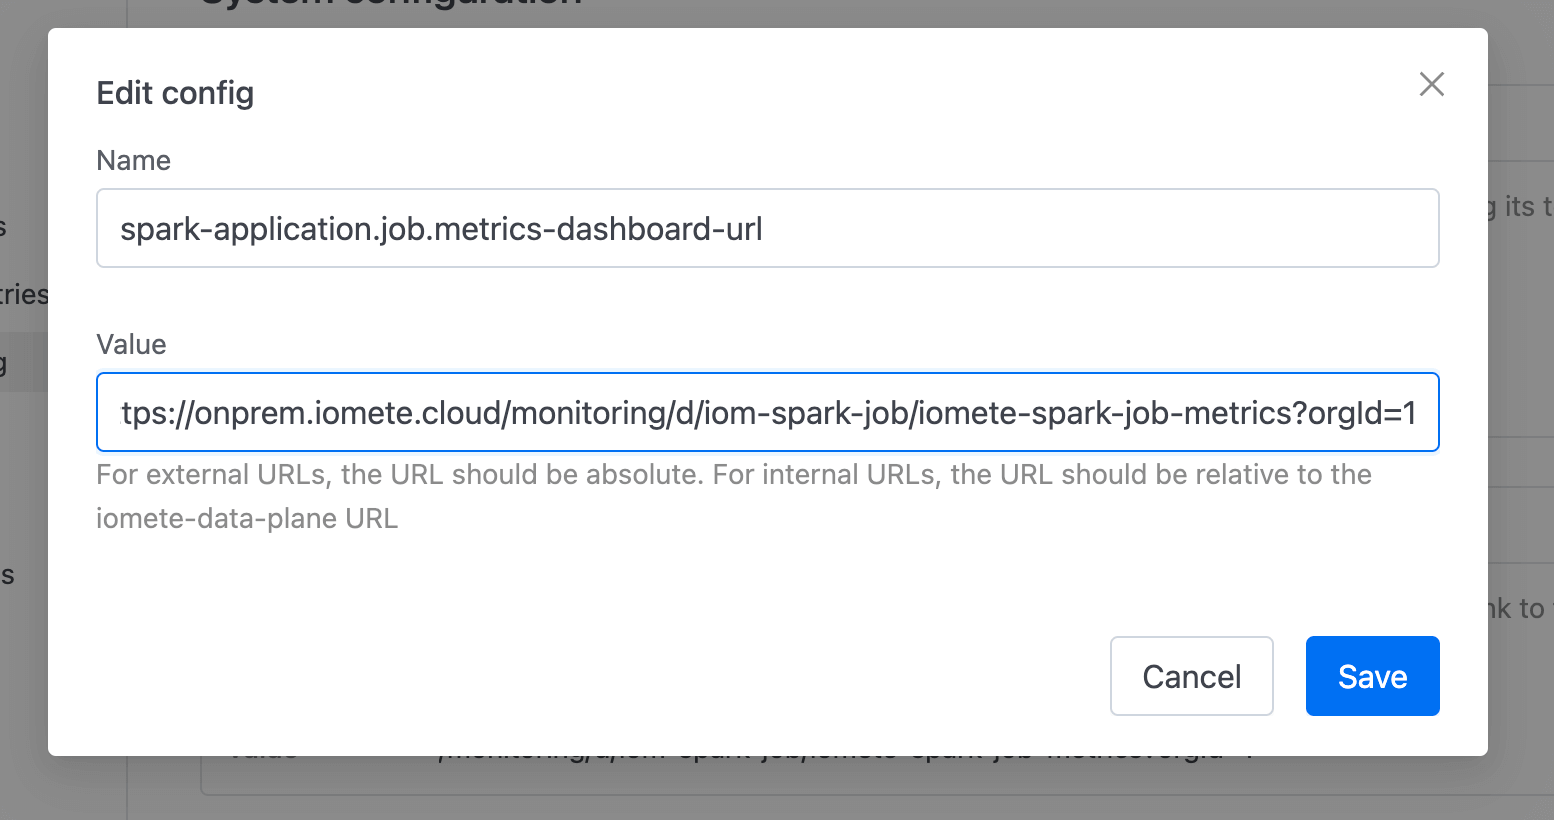

Now, when you click on the "Metrics" link in any Spark job in IOMETE, it will open the Grafana dashboard with the relevant job metrics.
Troubleshooting
Here are some common issues you might encounter when setting up monitoring, along with their solutions:
-
Metrics Not Showing Up
- Issue: Dashboards are empty or not updating.
- Solution:
- Verify that
monitoring.enabledis set totruein your IOMETE Helm Deployment (values). - Check Prometheus is correctly scraping metrics from IOMETE services.
- Ensure the Grafana data source is correctly configured to use your Prometheus instance.
- Verify that
-
Dashboard Import Fails
- Issue: Unable to import dashboards into Grafana.
- Solution:
- Check if you have the necessary permissions in Grafana.
- Ensure you're using a compatible version of Grafana (usually the latest stable version works best).
- Try importing the JSON manually by copying and pasting the content instead of uploading the file.
-
Job Metrics Dashboard Not Linking from IOMETE
- Issue: Clicking on "Metrics" in IOMETE doesn't open the Grafana dashboard.
- Solution:
- Double-check that you've correctly set the
spark-application.job.metrics-dashboard-urlin IOMETE settings. - Ensure the Grafana instance is accessible
- Double-check that you've correctly set the
-
High Latency or Missing Data
- Issue: Dashboards are slow to update or show gaps in data.
- Solution:
- Check the resource allocation for Prometheus and Grafana, they might need more resources.
- Verify network connectivity between IOMETE services, Prometheus, and Grafana.
- Adjust Prometheus scrape intervals if necessary.
If you encounter persistent issues, consult the IOMETE documentation or reach out to IOMETE support for further assistance.