Power BI - Connecting to IOMETE

This guide explains how to effortlessly integrate IOMETE with yet another popular BI tool: Power BI.
Let’s get started.
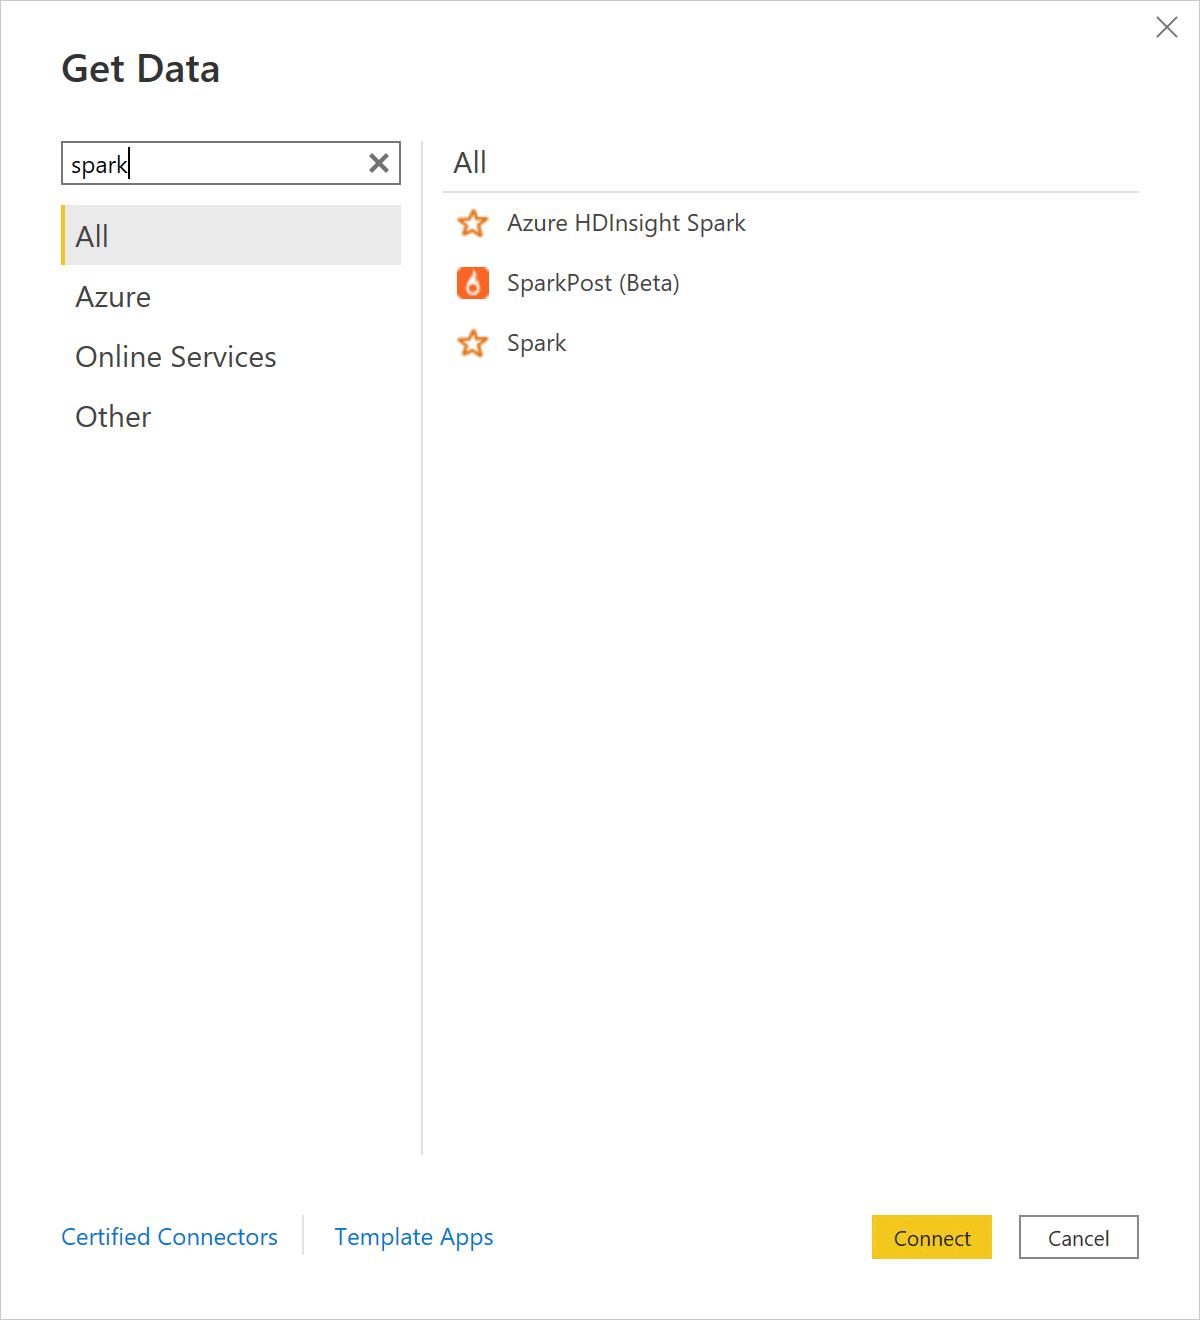
First, you have to add a new Data Source. Click “Get Data” from the menu and select Spark as a data source.
In the next Form, you will need to add connection details like in the screenshot below.
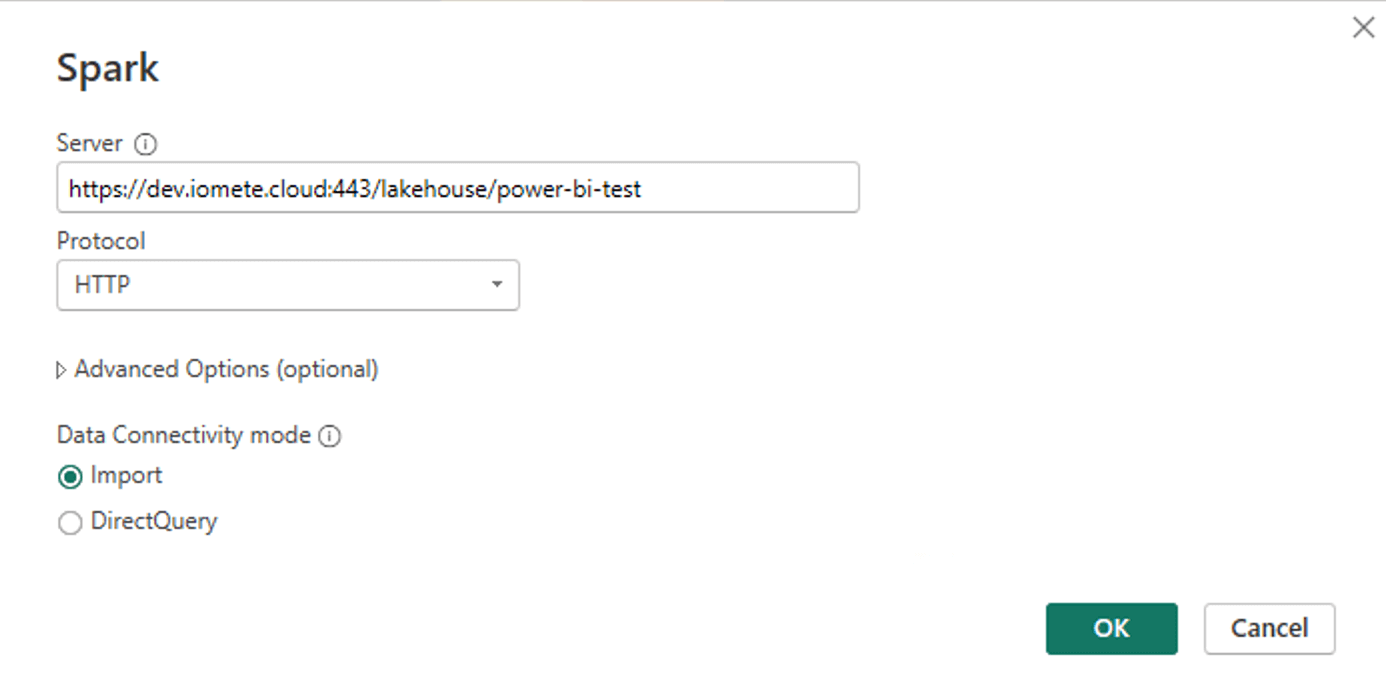
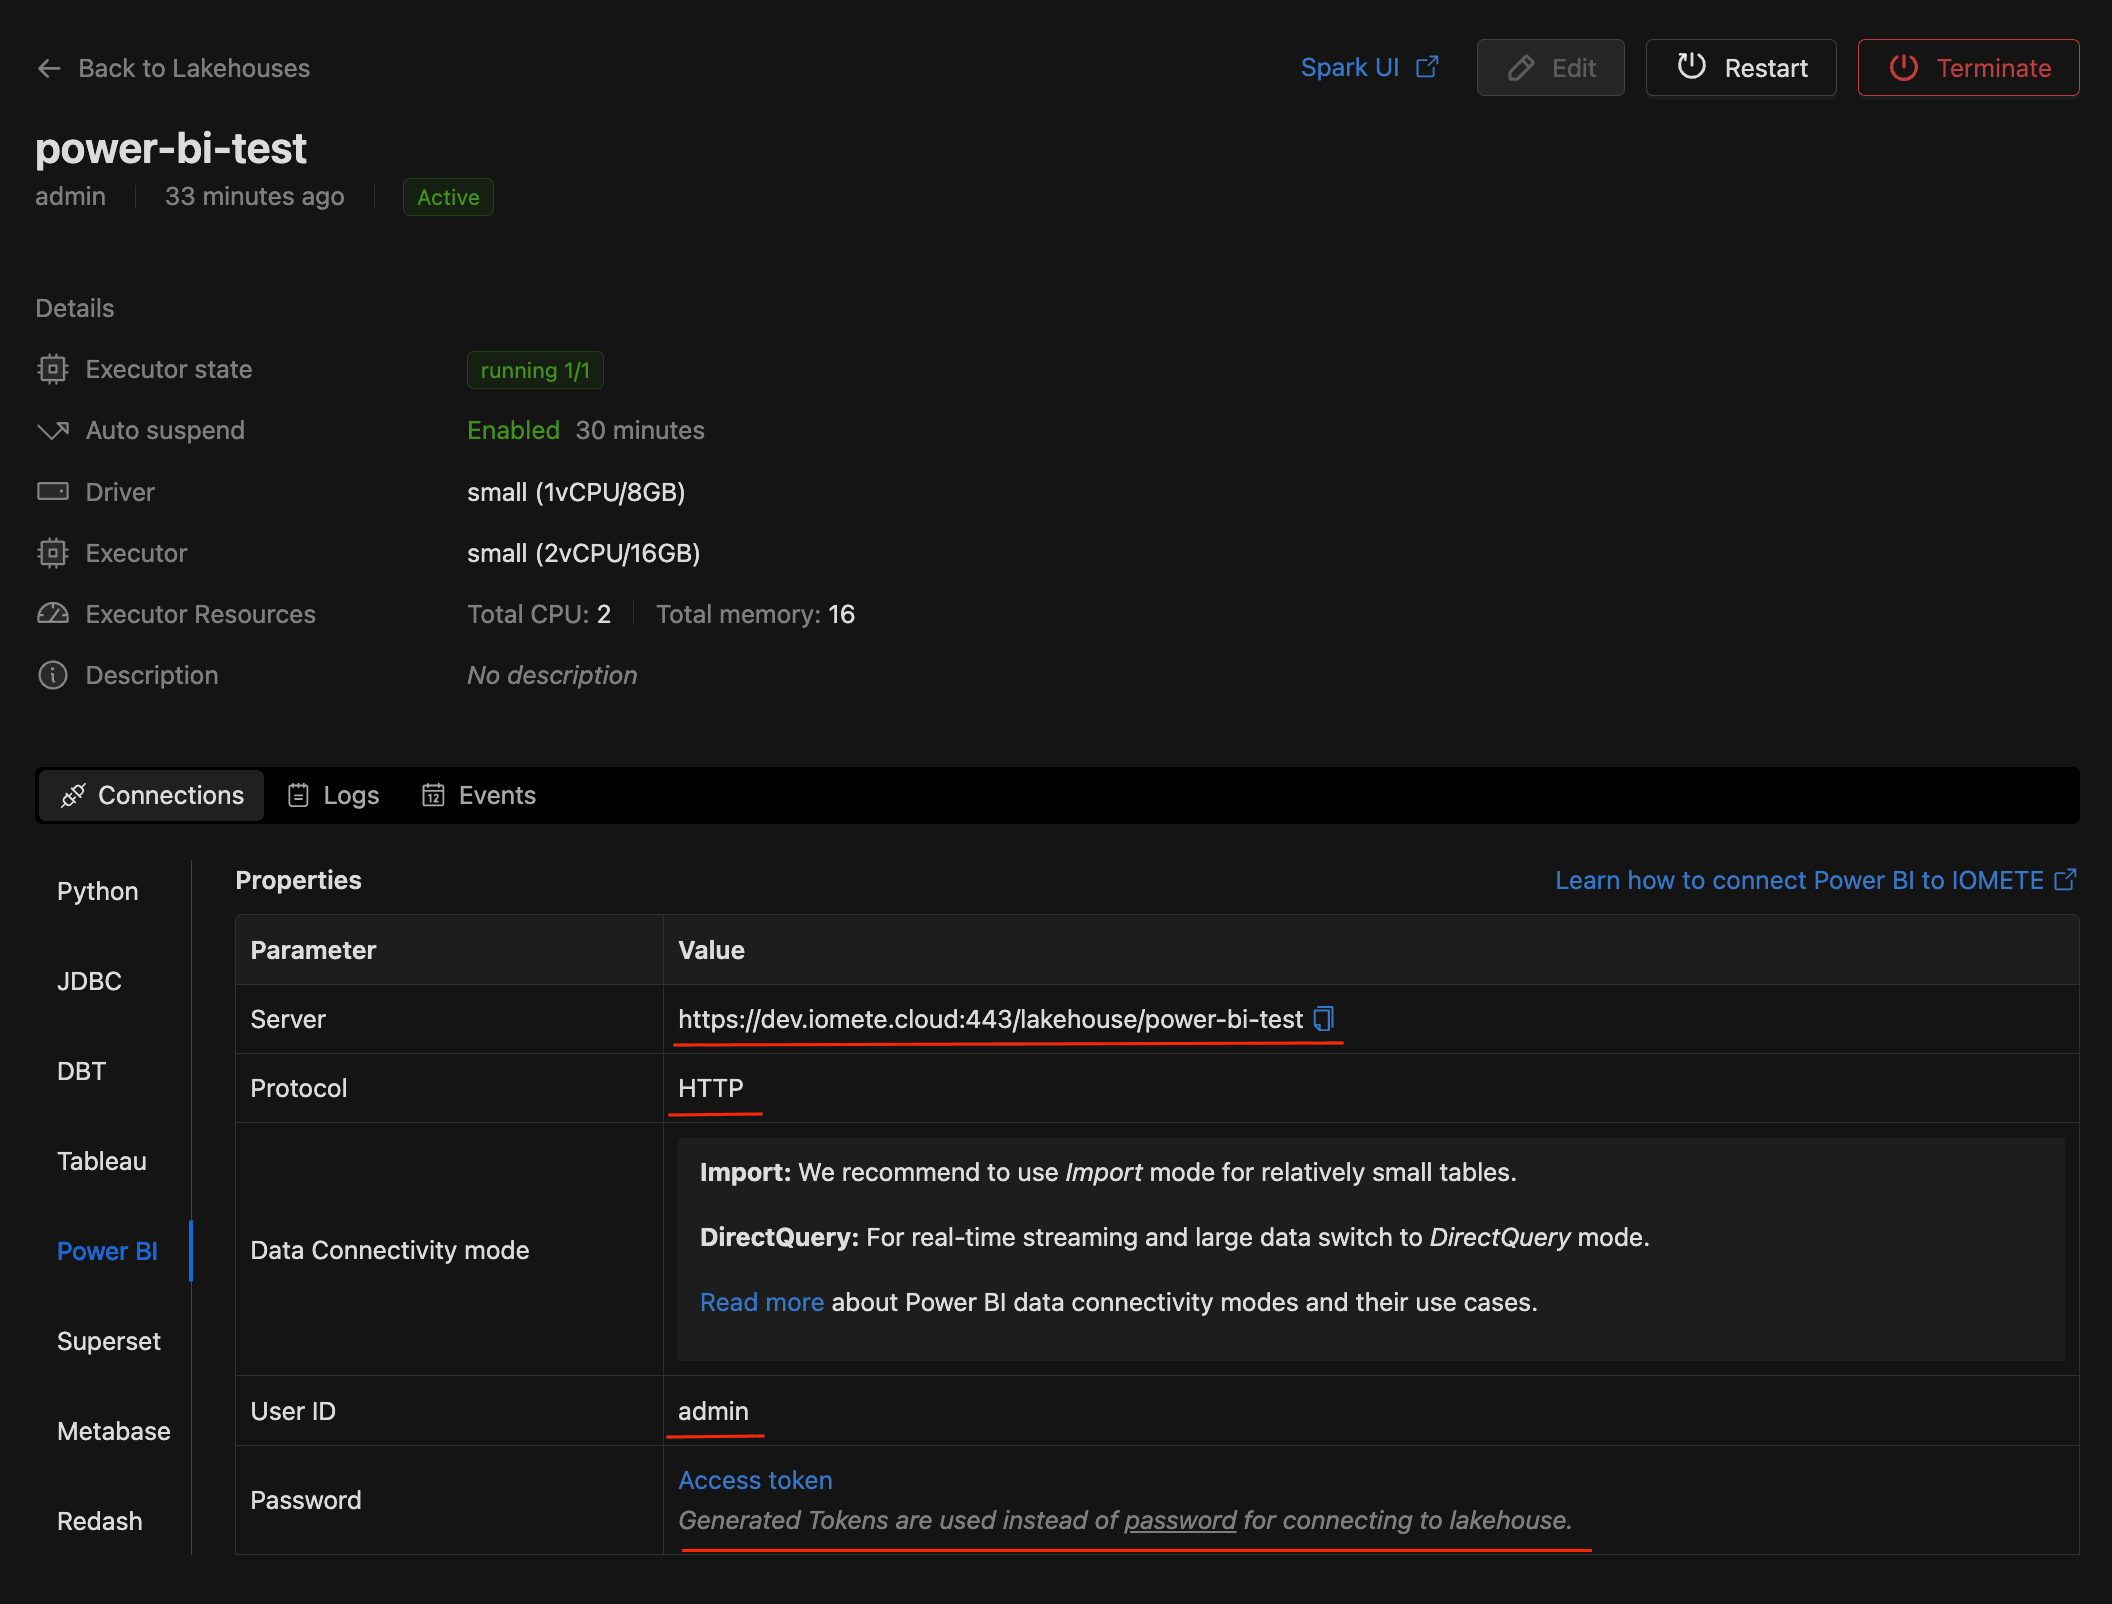
For protocol, select HTTP, and in Data Connectivity mode select Import.
Power BI recommends to use Import for connectivity mode. For relatively large data or real-time streaming switch to DirectQuery mode. Read more about connectivity modes and their use cases here.
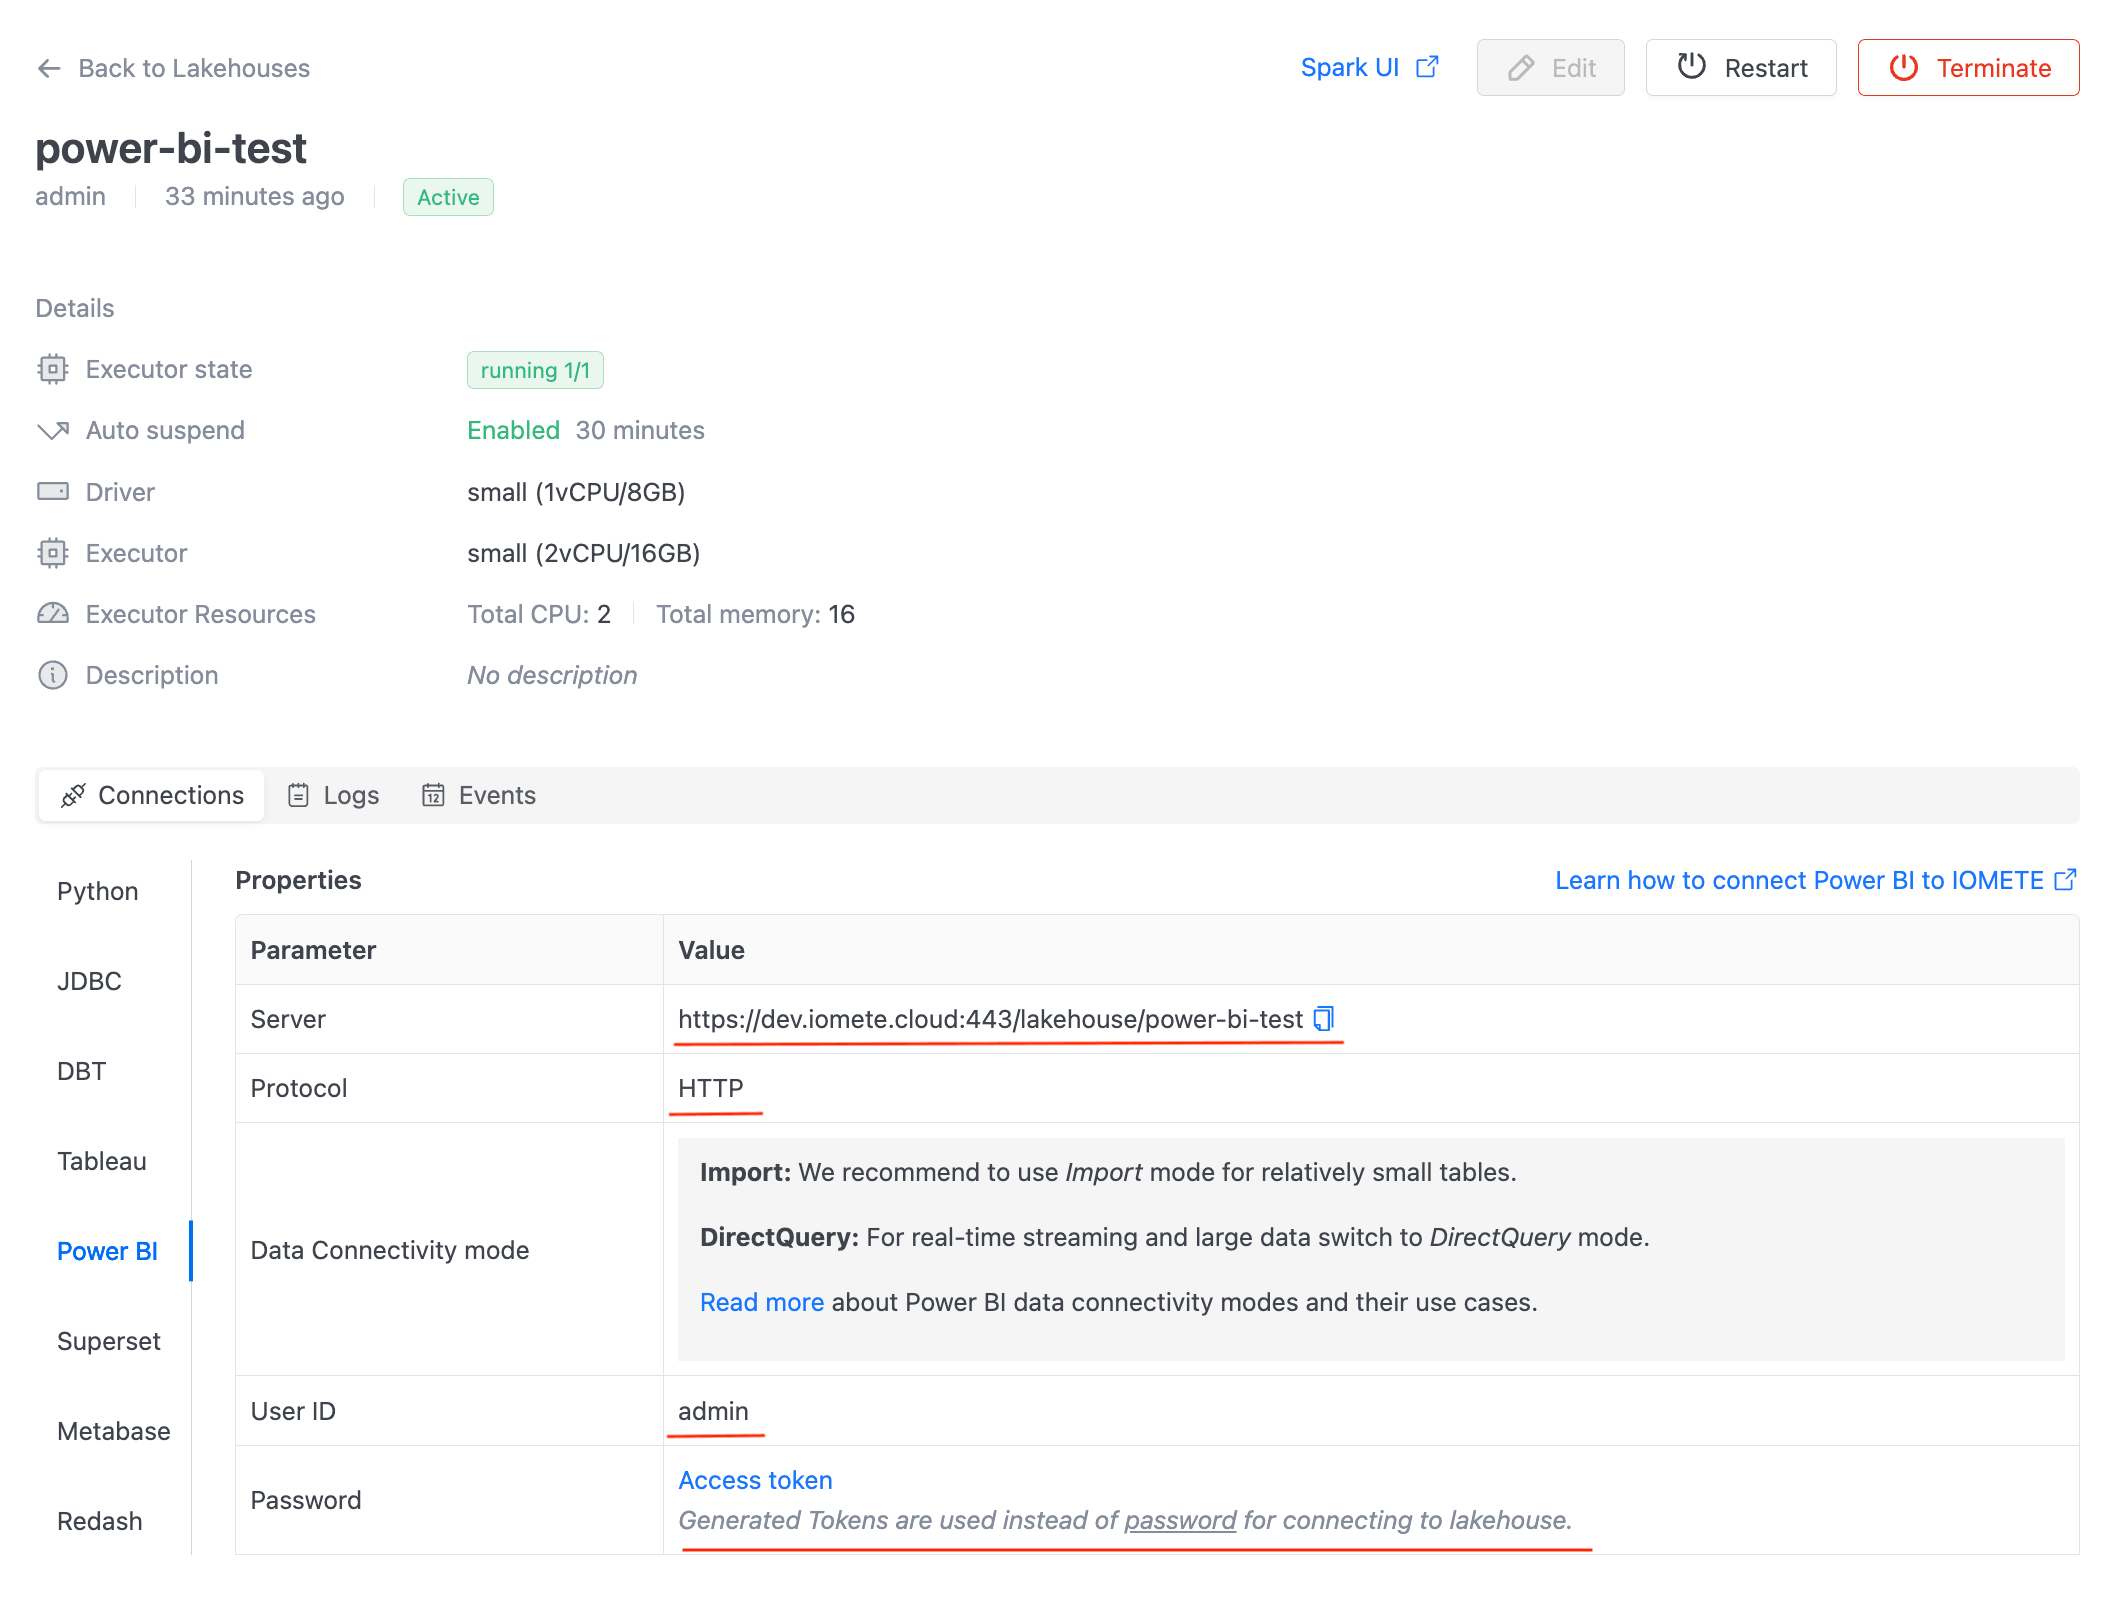
To fill in these values you can go to the IOMETE Platform and copy connection details from the lakehouse you are trying to connect. Switch to the Power BI tab in the Connections section and copy the Server parameter.
After clicking the OK button, you will be directed to an authentication page where you can establish a connection and input your username and password.
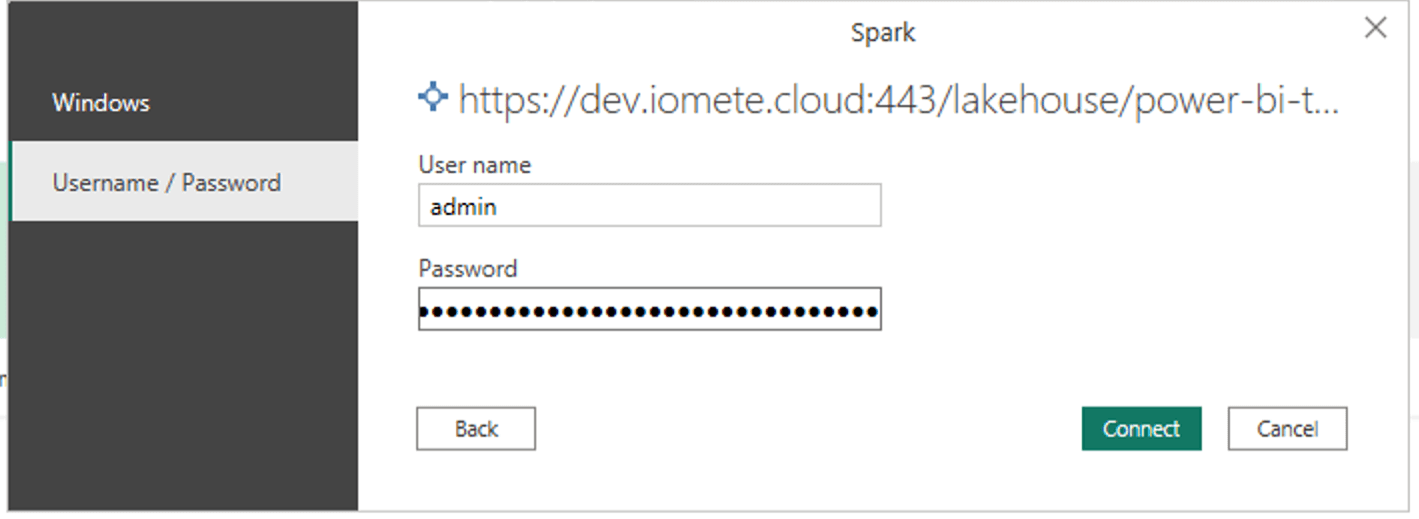
To fill in these values you can go to the IOMETE Platform and copy connection details from the lakehouse you are trying to connect. Switch to the Power BI tab in the Connections section and check the User ID and Password parameters.
Now in the next step, you will see your tables and views. Note that Power BI doesn’t provide the option to choose a database, but instead it will display all the tables across all of your databases.
Select the tables and views you want to use in Power BI.
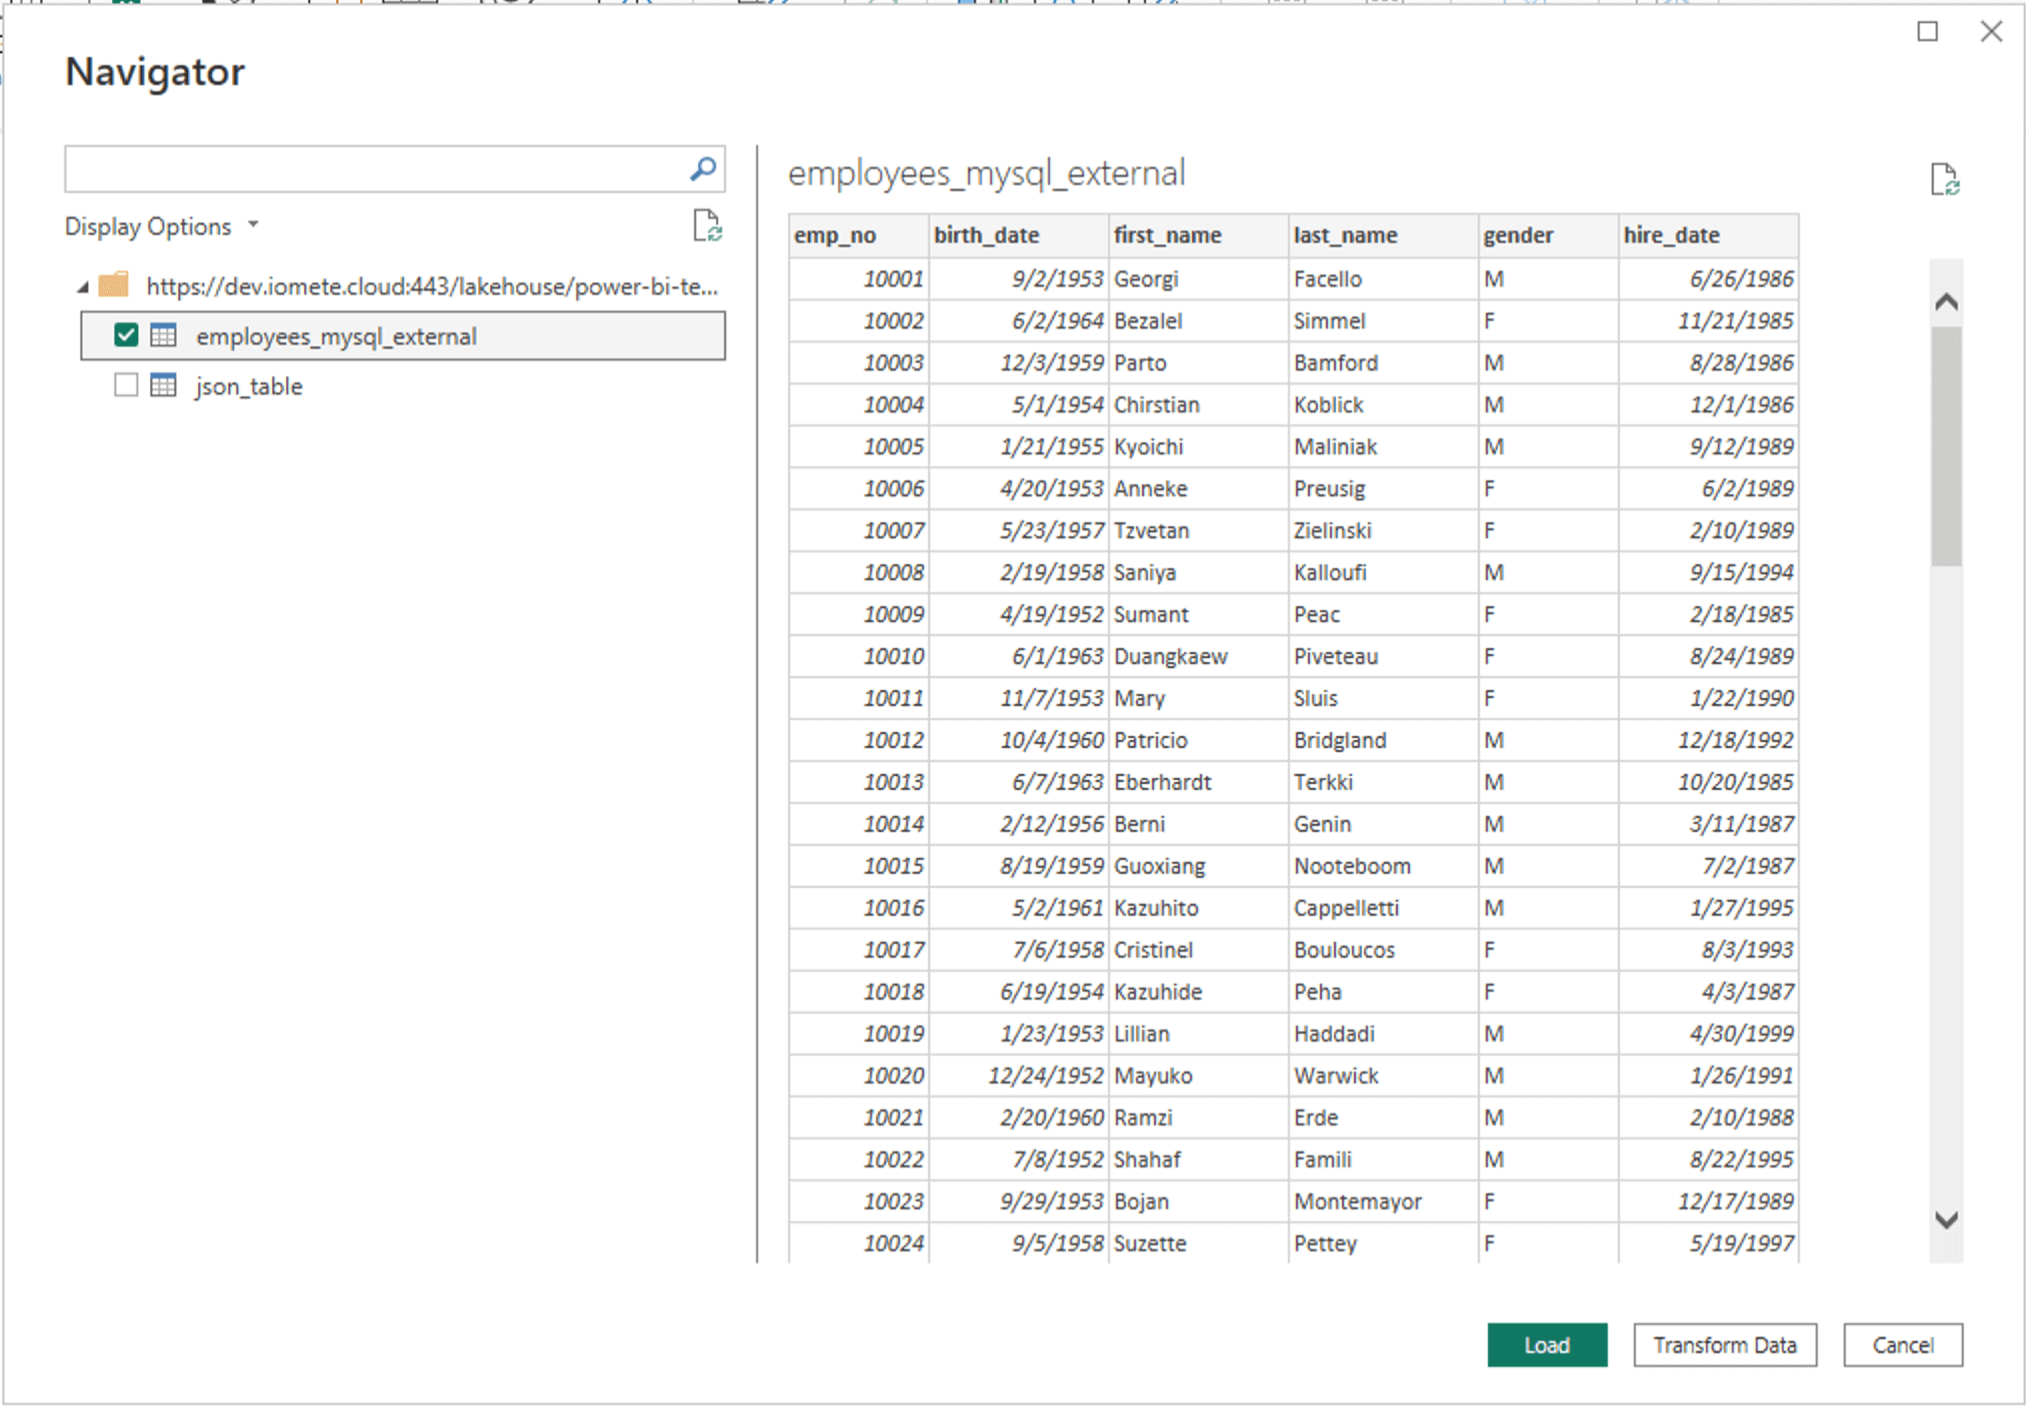
You will have to wait a couple of minutes before Power BI will load the data sets.
Congratulations, you have successfully connected Power BI to IOMETE.
Now you will see the data sources (tables/views) you have added displayed on the right side.
In this example, we created a simple pie chart to show the summary of emp_no by gender.
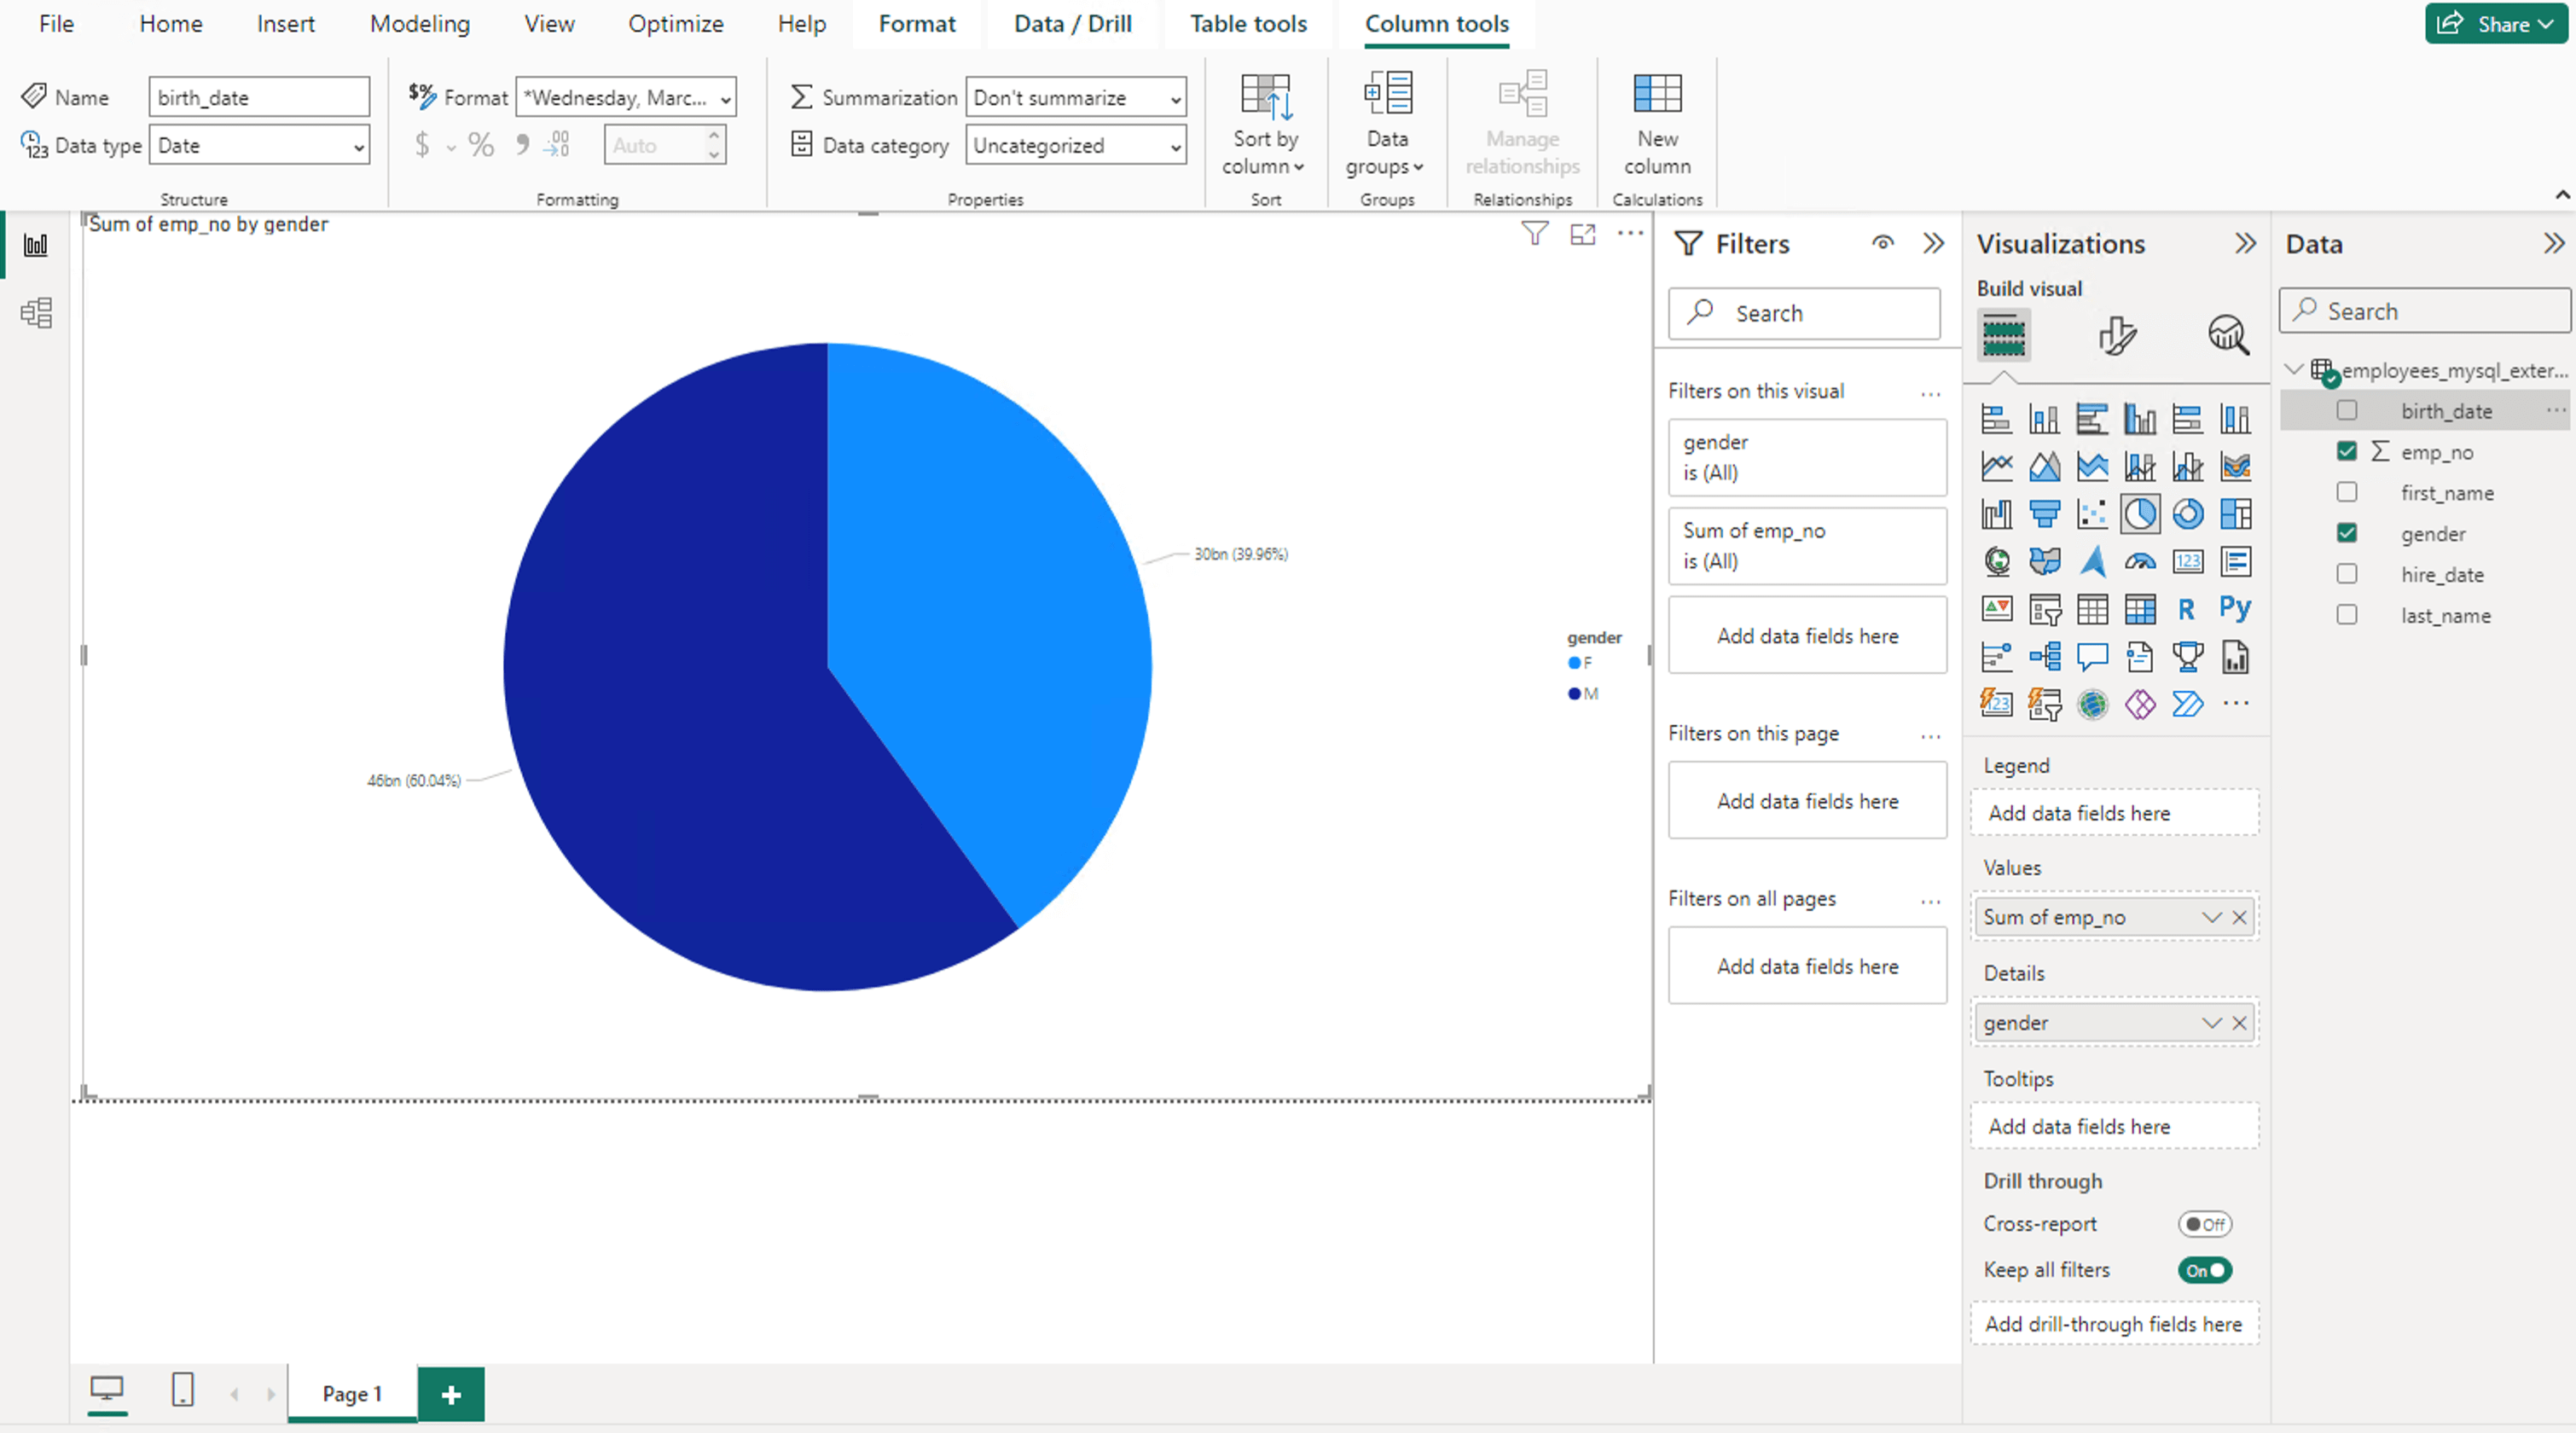
From this point, you can create, save and publish your reports. You can learn how to create dashboards and detailed visualizations with Power BI resources.
Thanks.