Platform Tour
The IOMETE interface has three areas:
- User Menu (top-left): manage your account, access platform administration, and get help.
- Navigation Menu (left sidebar): move between sections like Engine, Workspace, and Governance, covered below.
- Content (center): where the selected section's page loads and where you do your work.
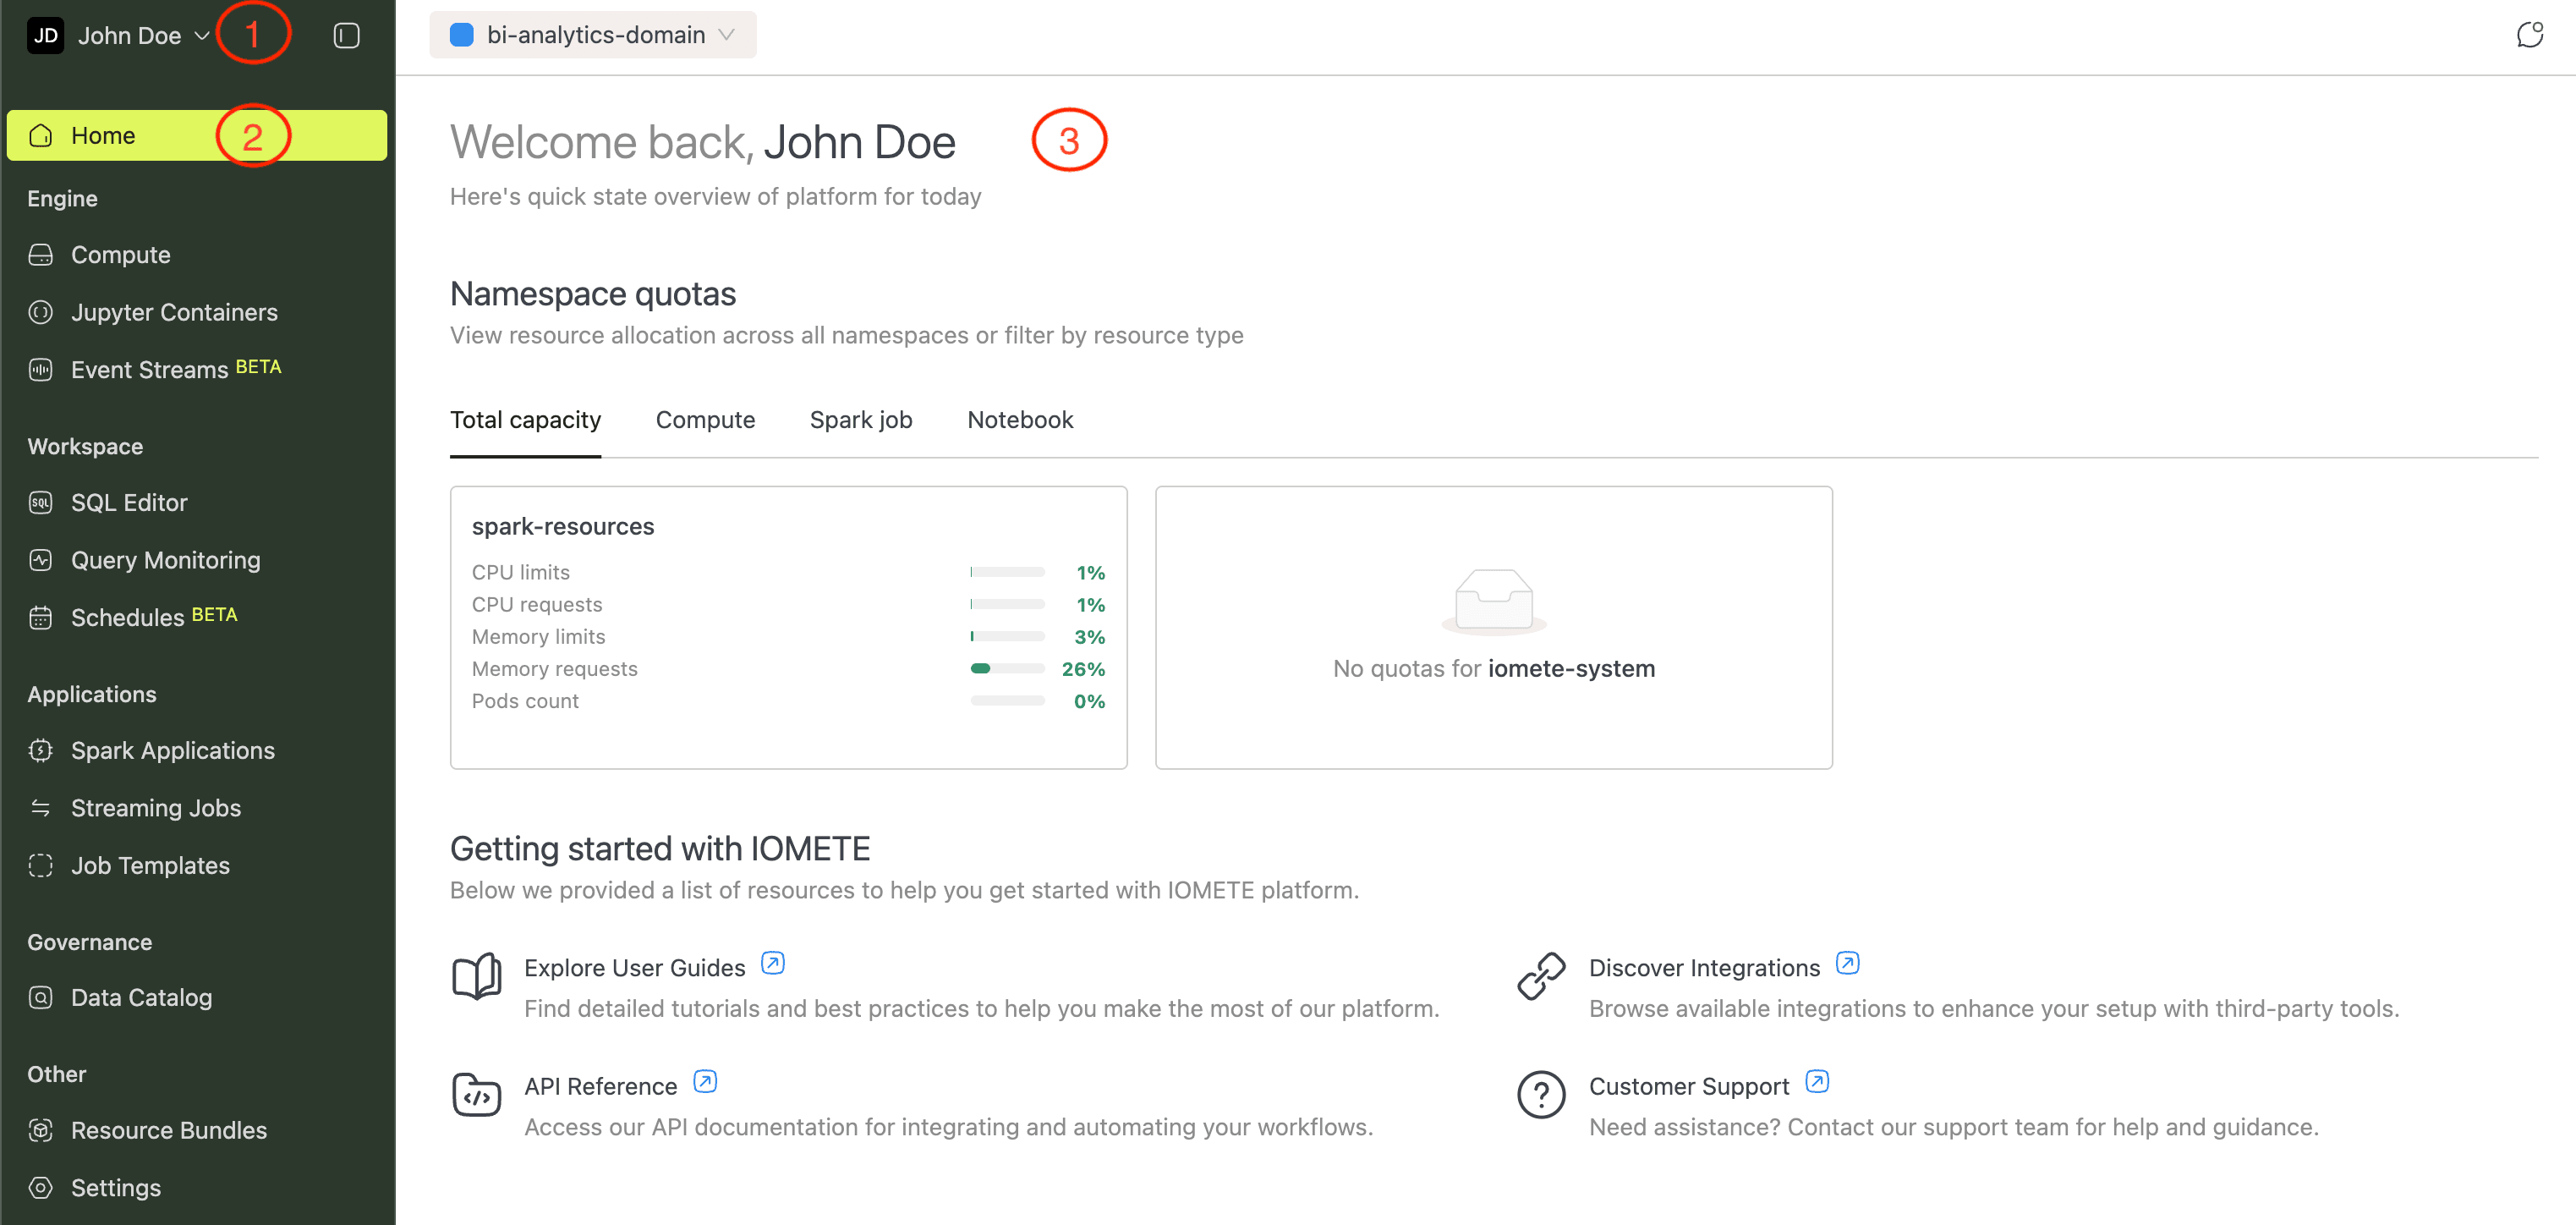
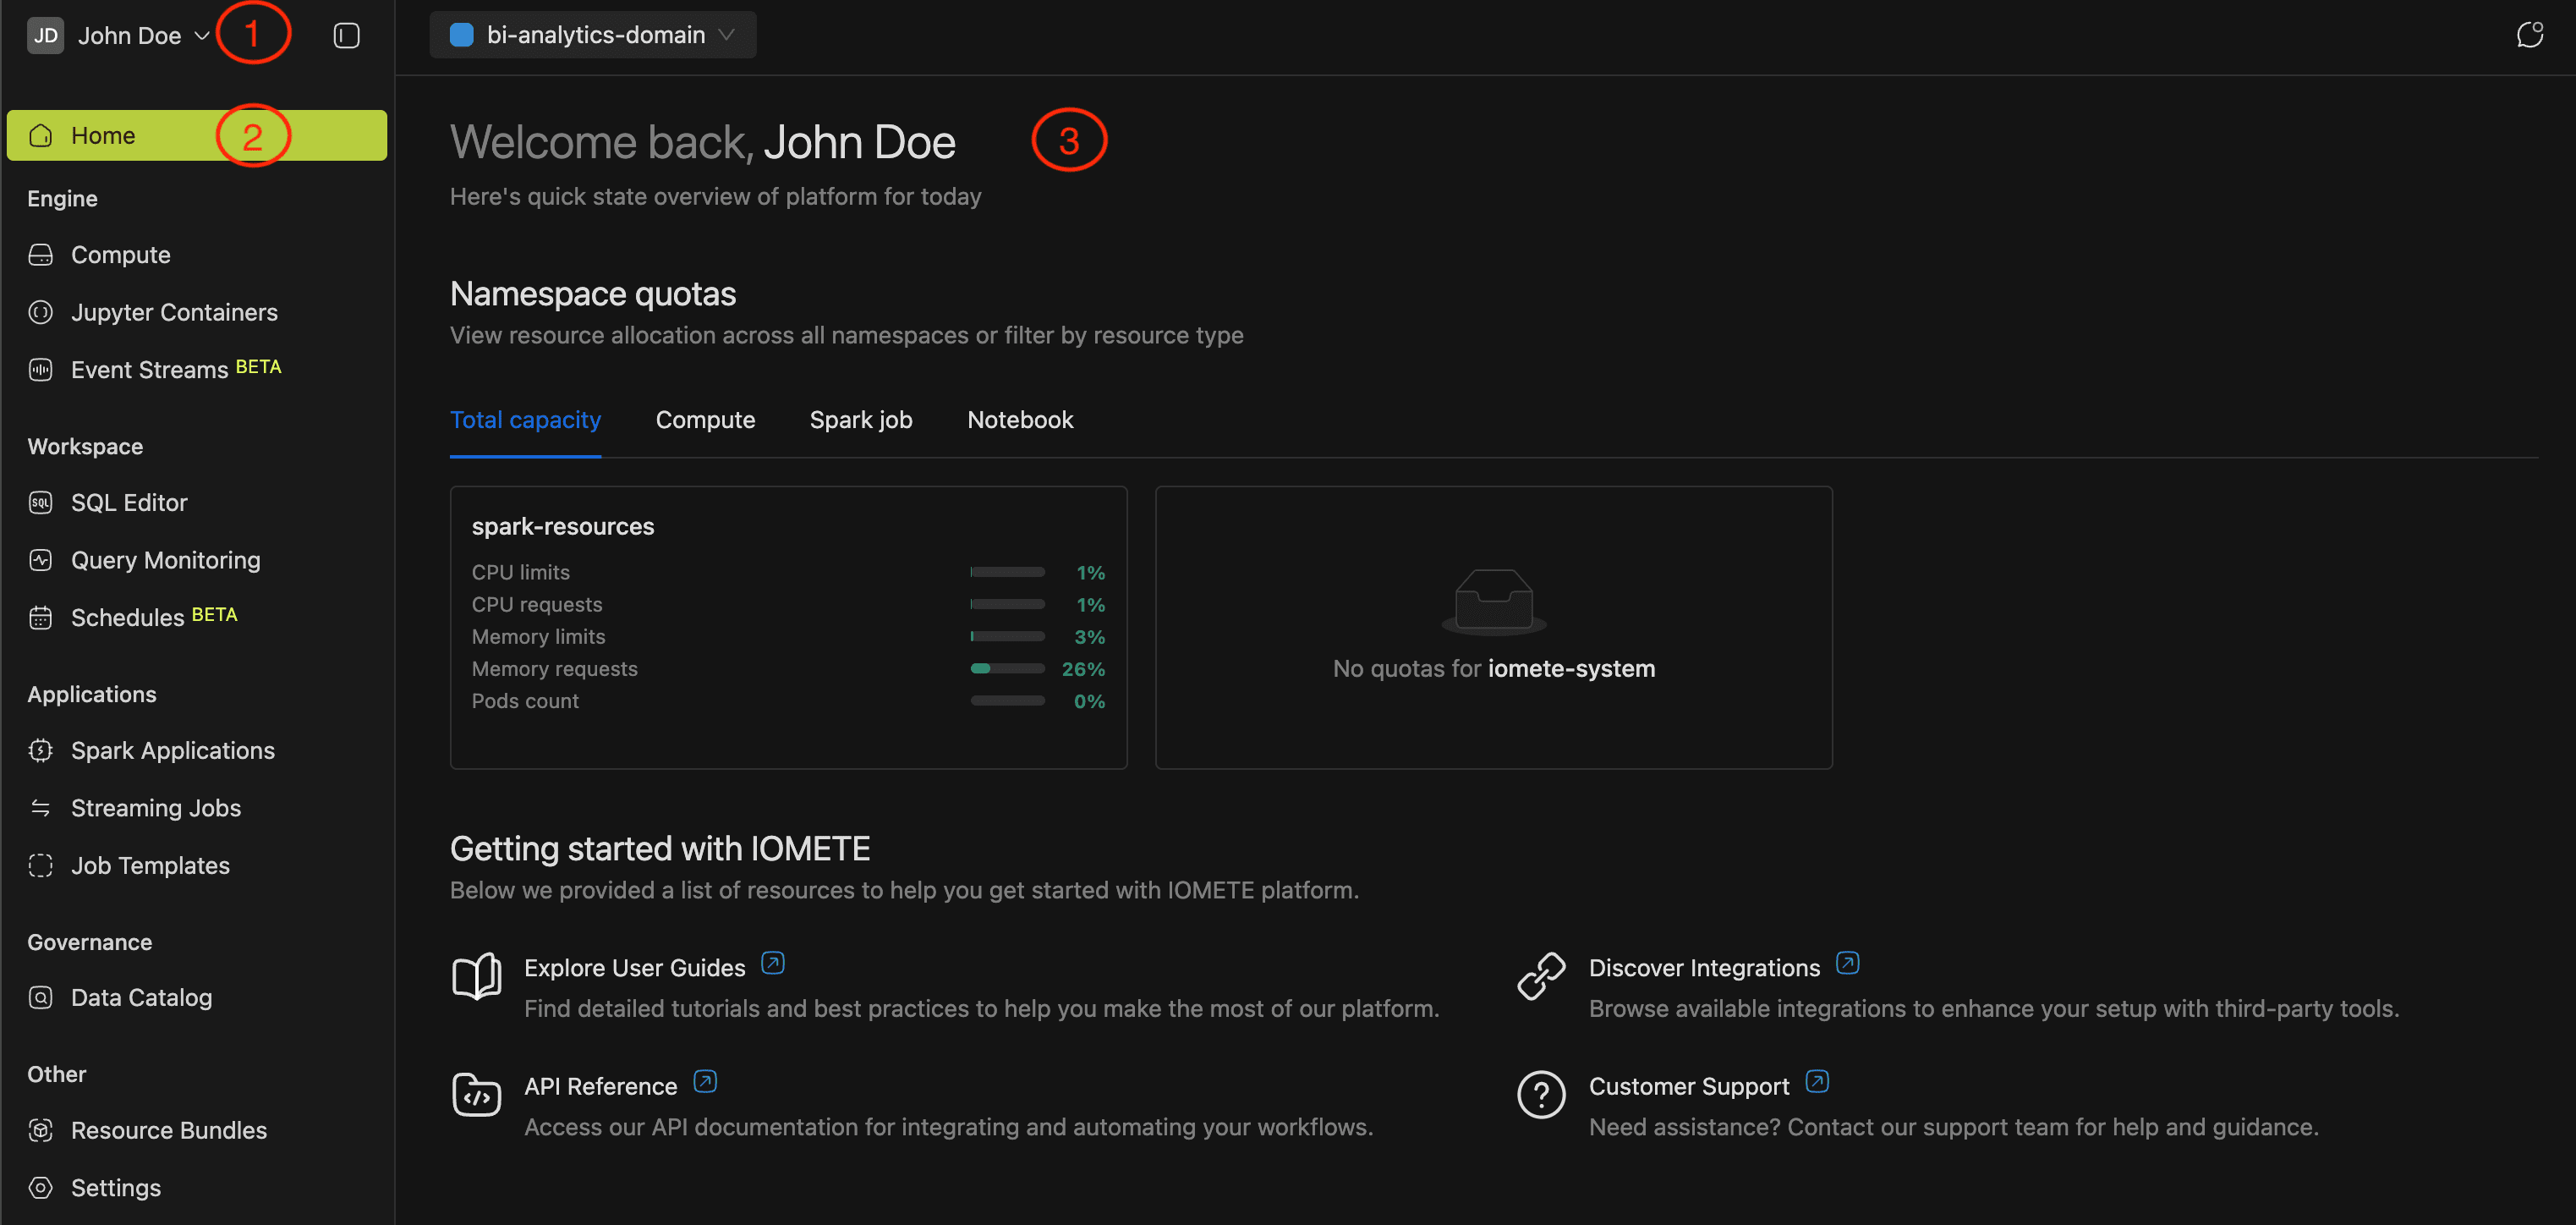
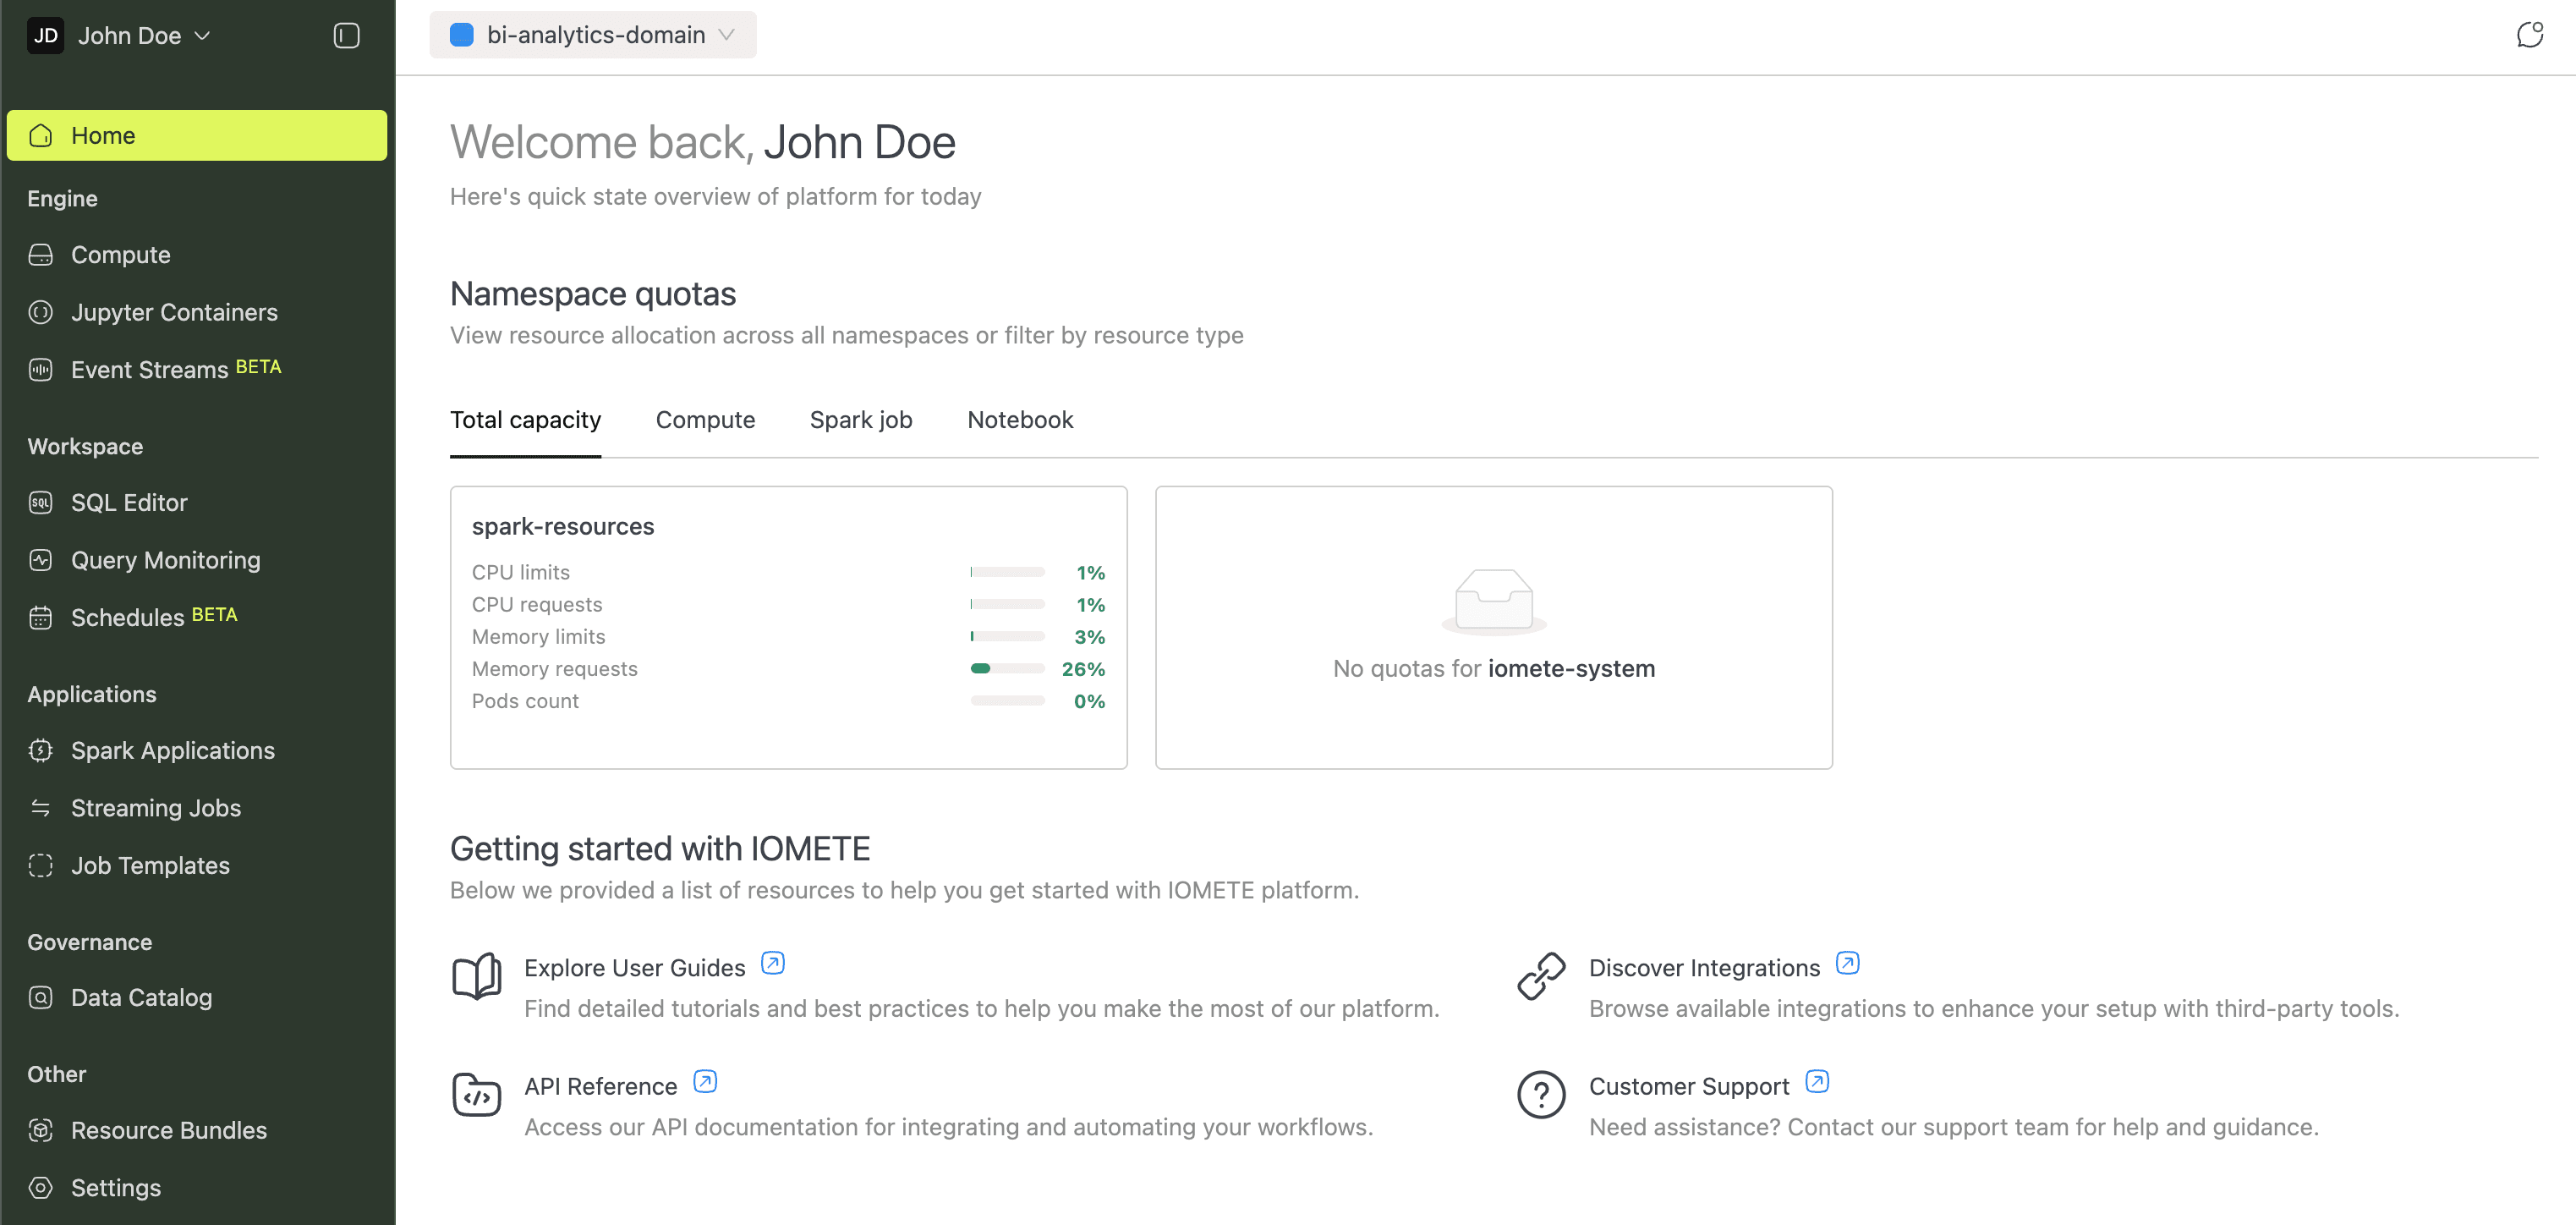
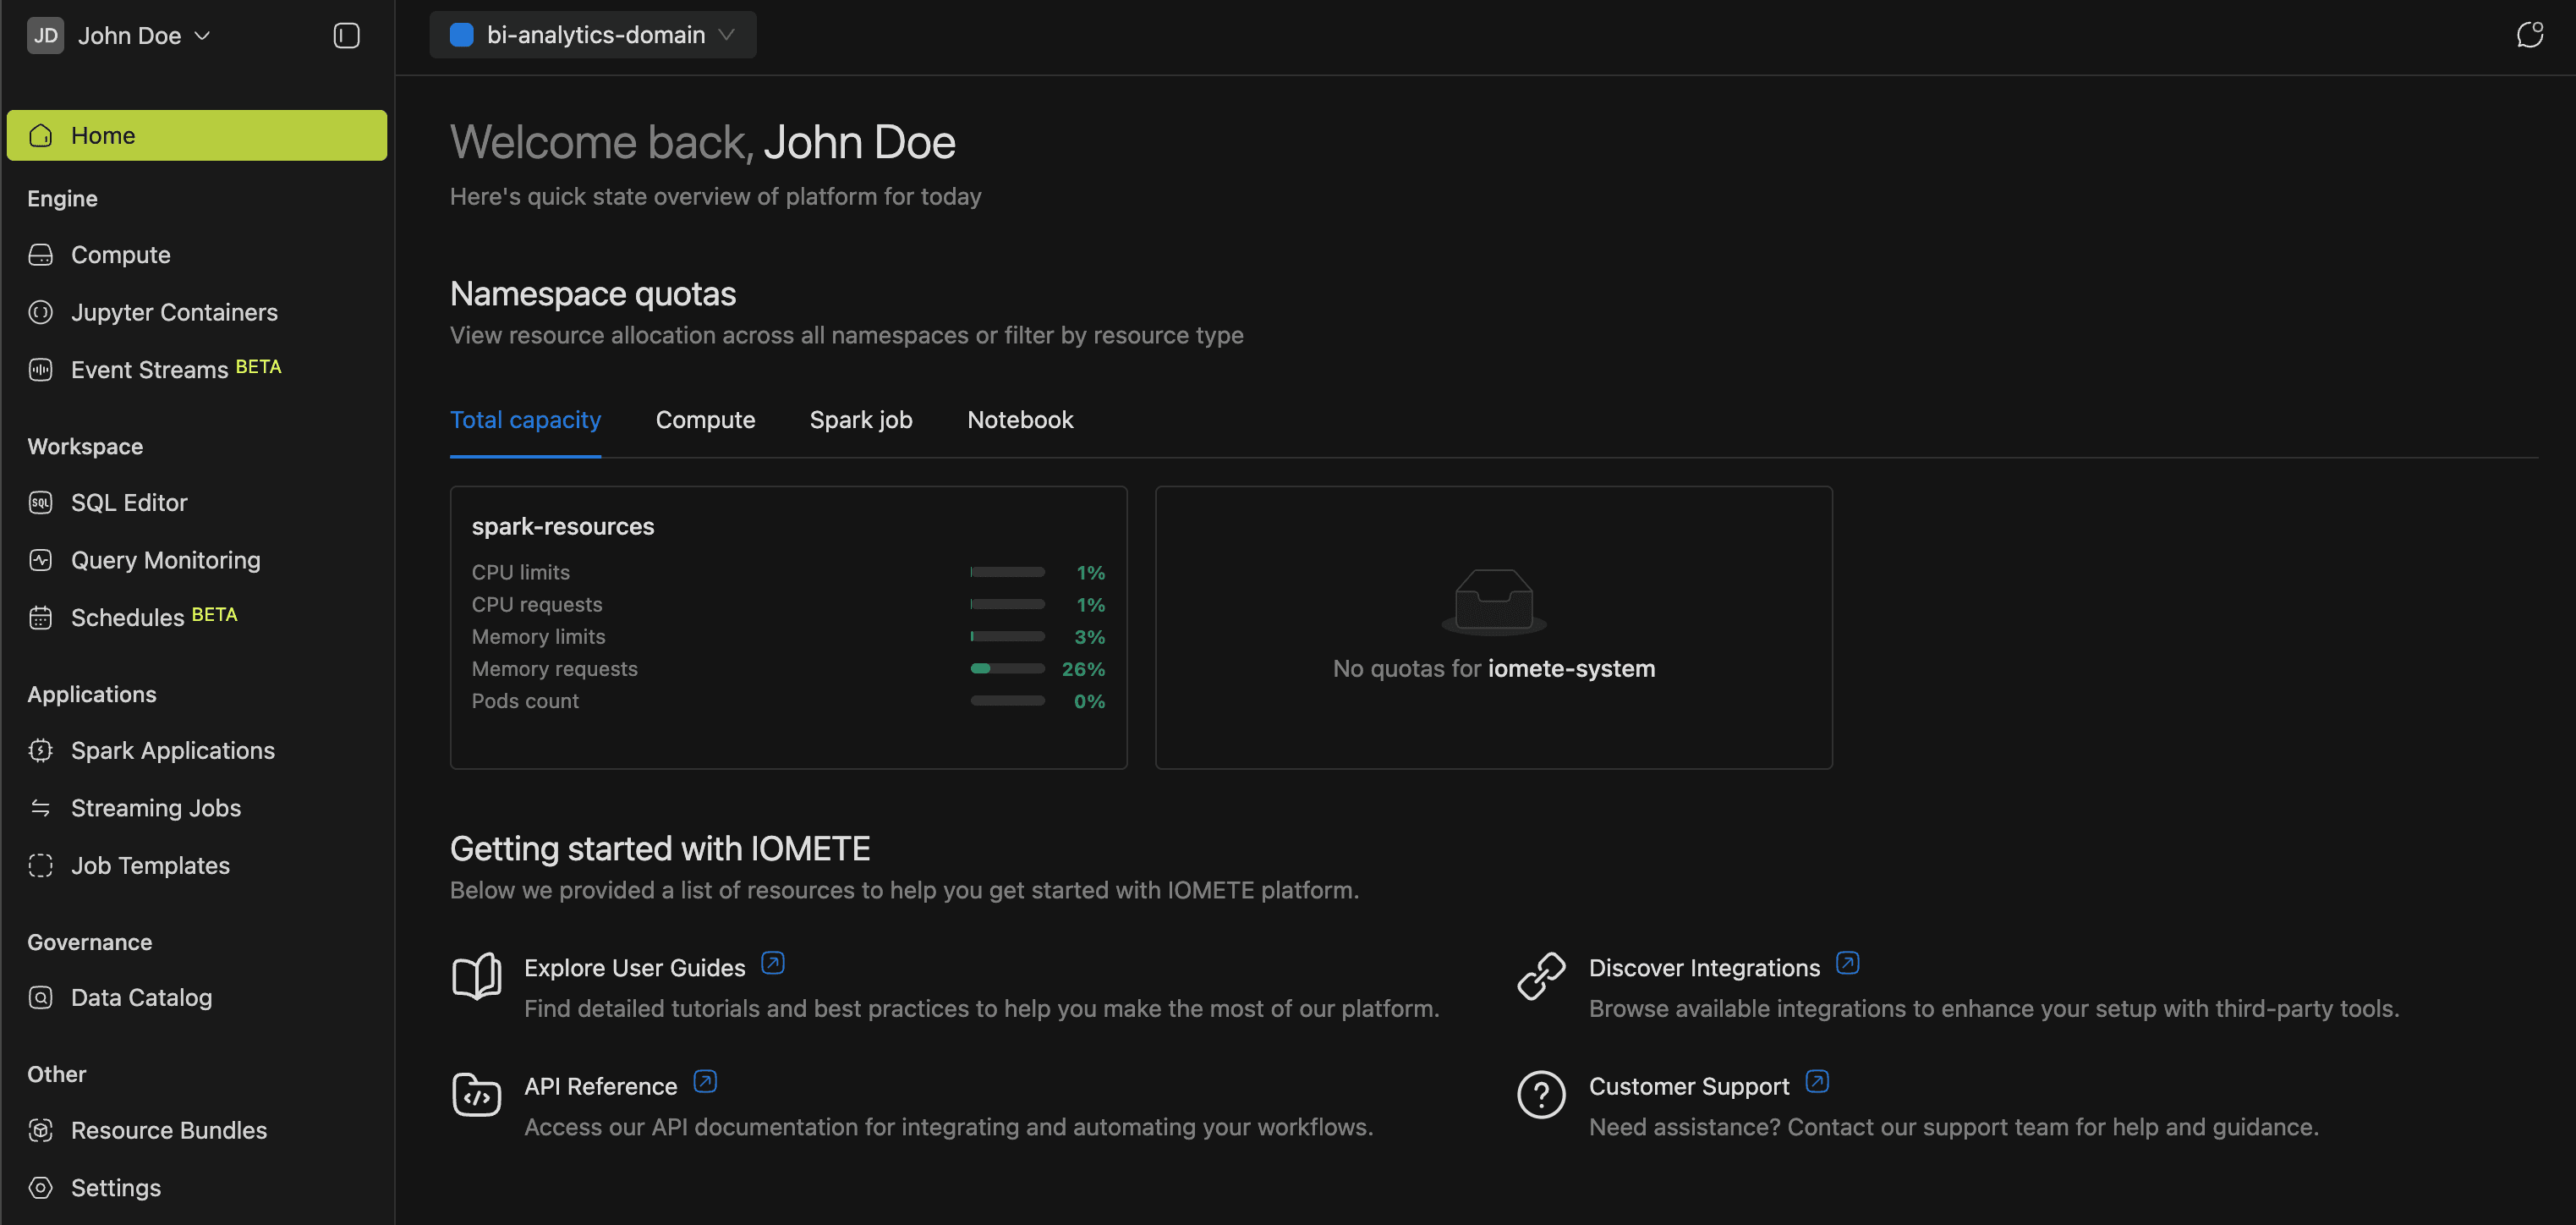
Home
The Home page is your starting point after login. It displays a resource quota overview and quick access cards for user guides, integrations, the API reference, and support.
Engine
Every workload on IOMETE needs compute resources. The Engine section is where you provision and manage them.
Compute
Compute clusters are pools of dedicated resources (CPU and memory) that run your queries. You'll need at least one before using the SQL Editor.
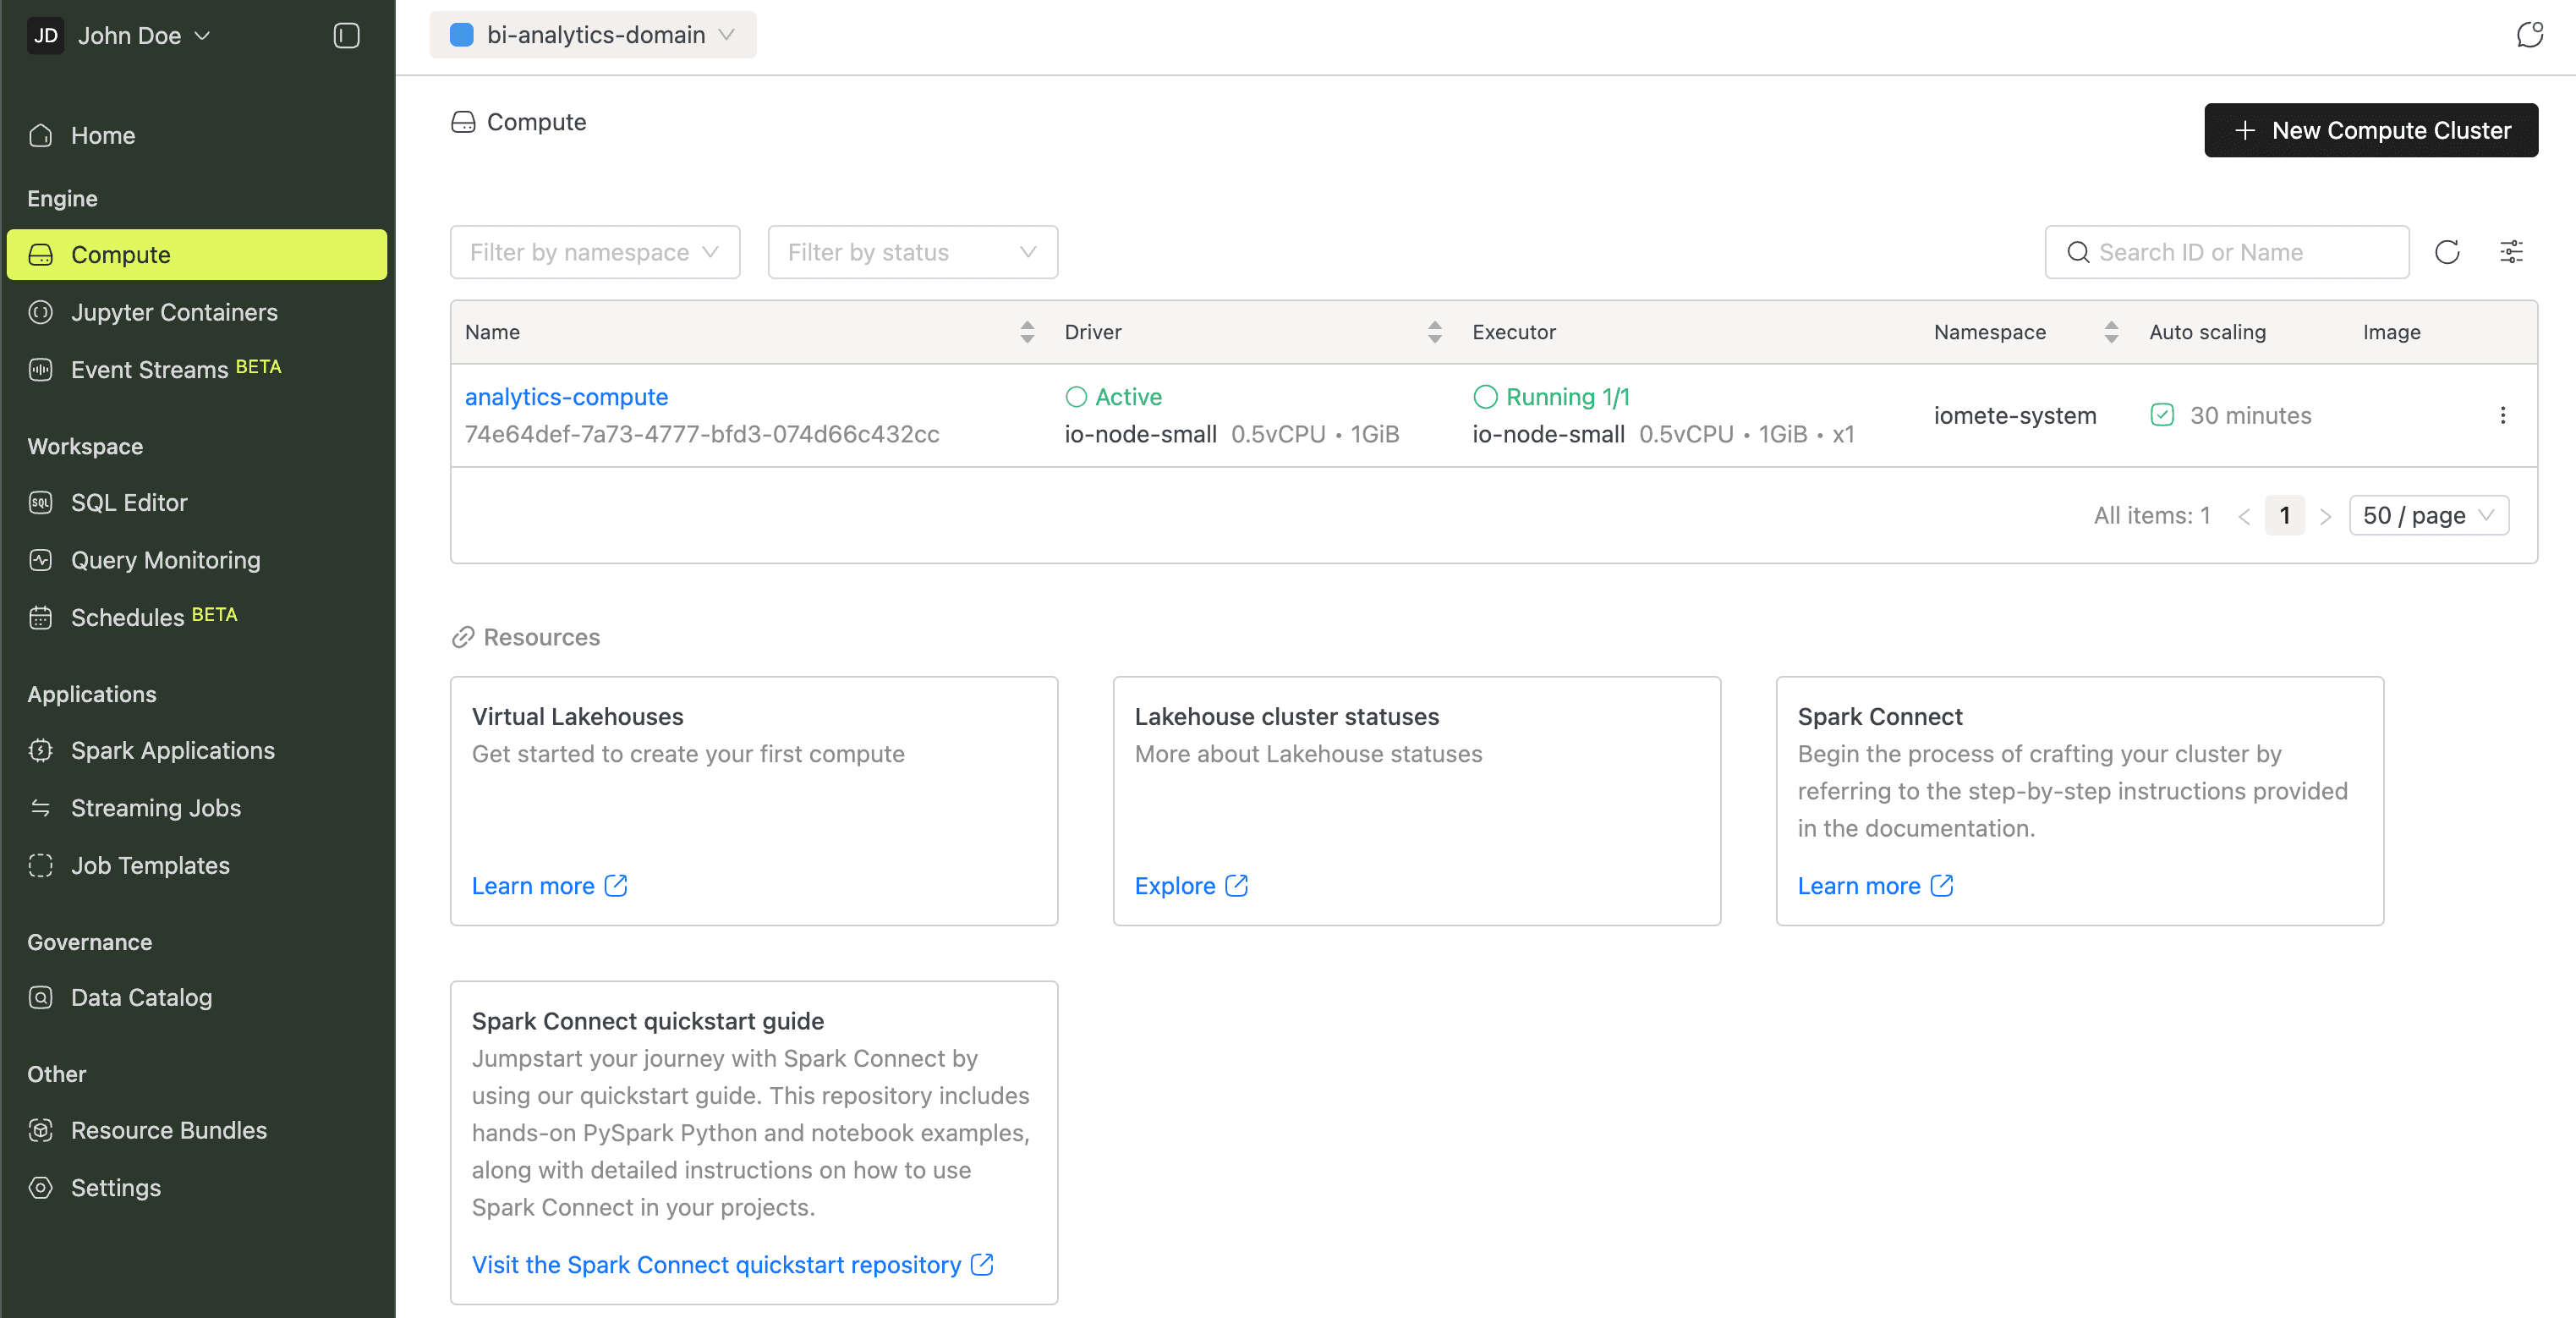
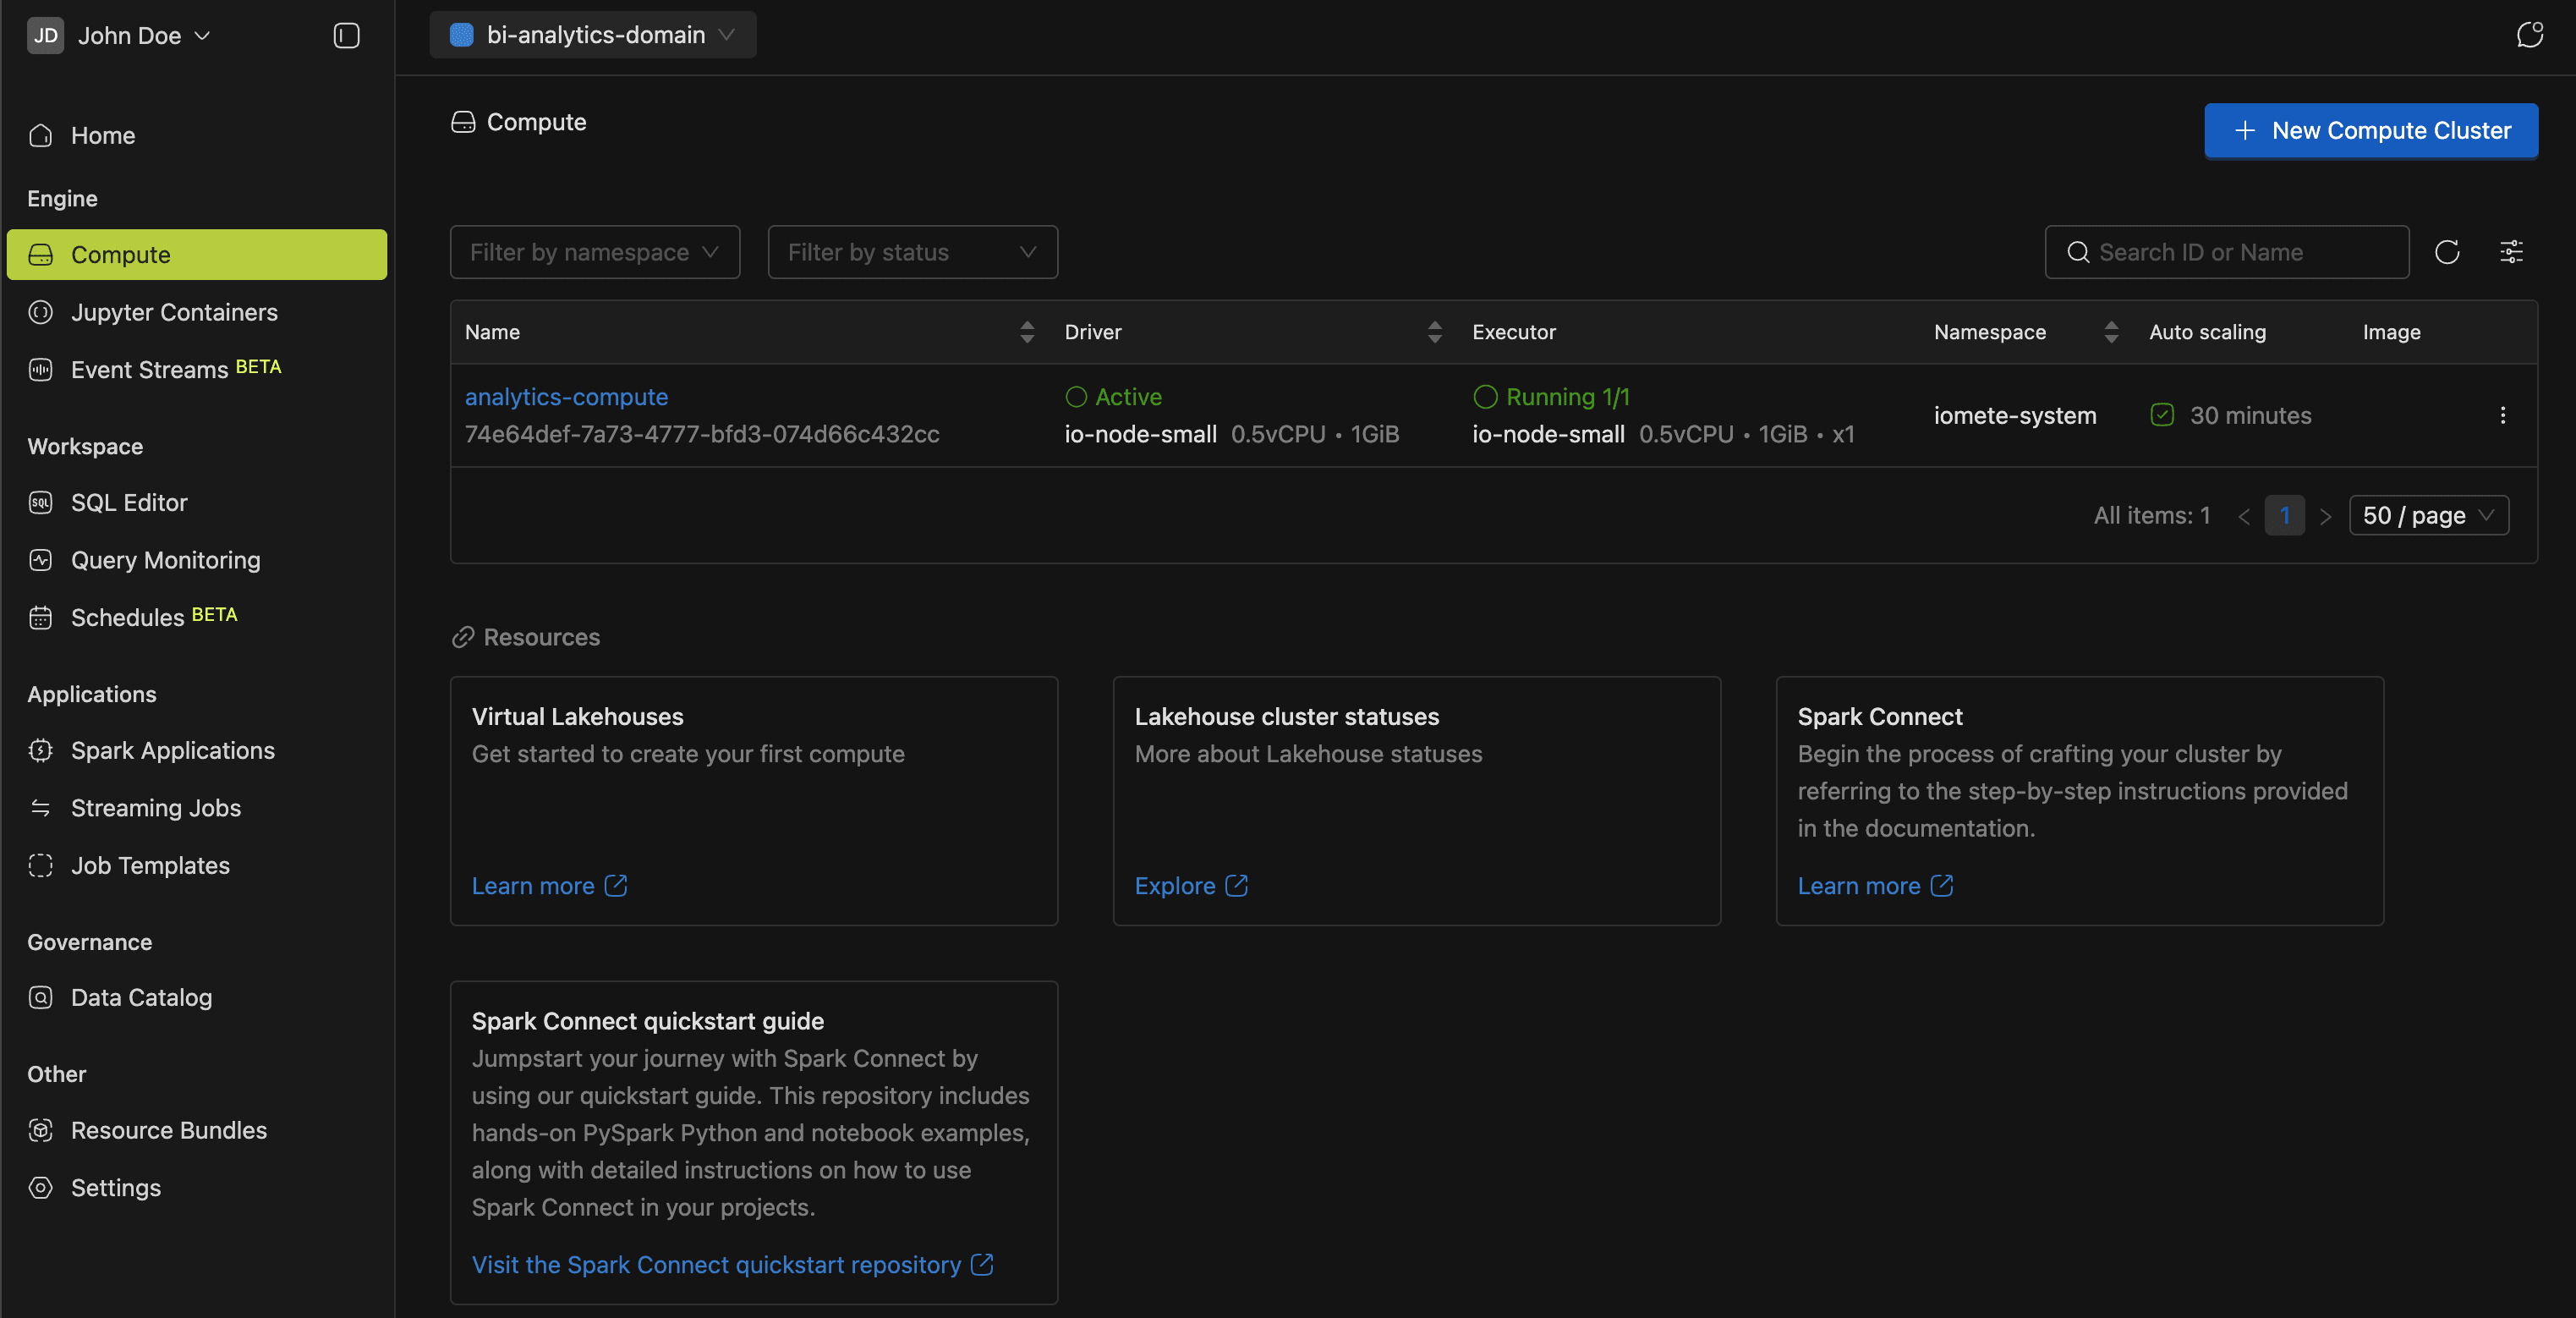
The Compute Clusters guide covers configuration in detail.
Jupyter Containers
Jupyter Containers provide containerized JupyterLab environments inside the platform. Each container has persistent storage and connects to compute clusters via Spark Connect, so you can explore data, prototype ETL pipelines, and develop ML models interactively.
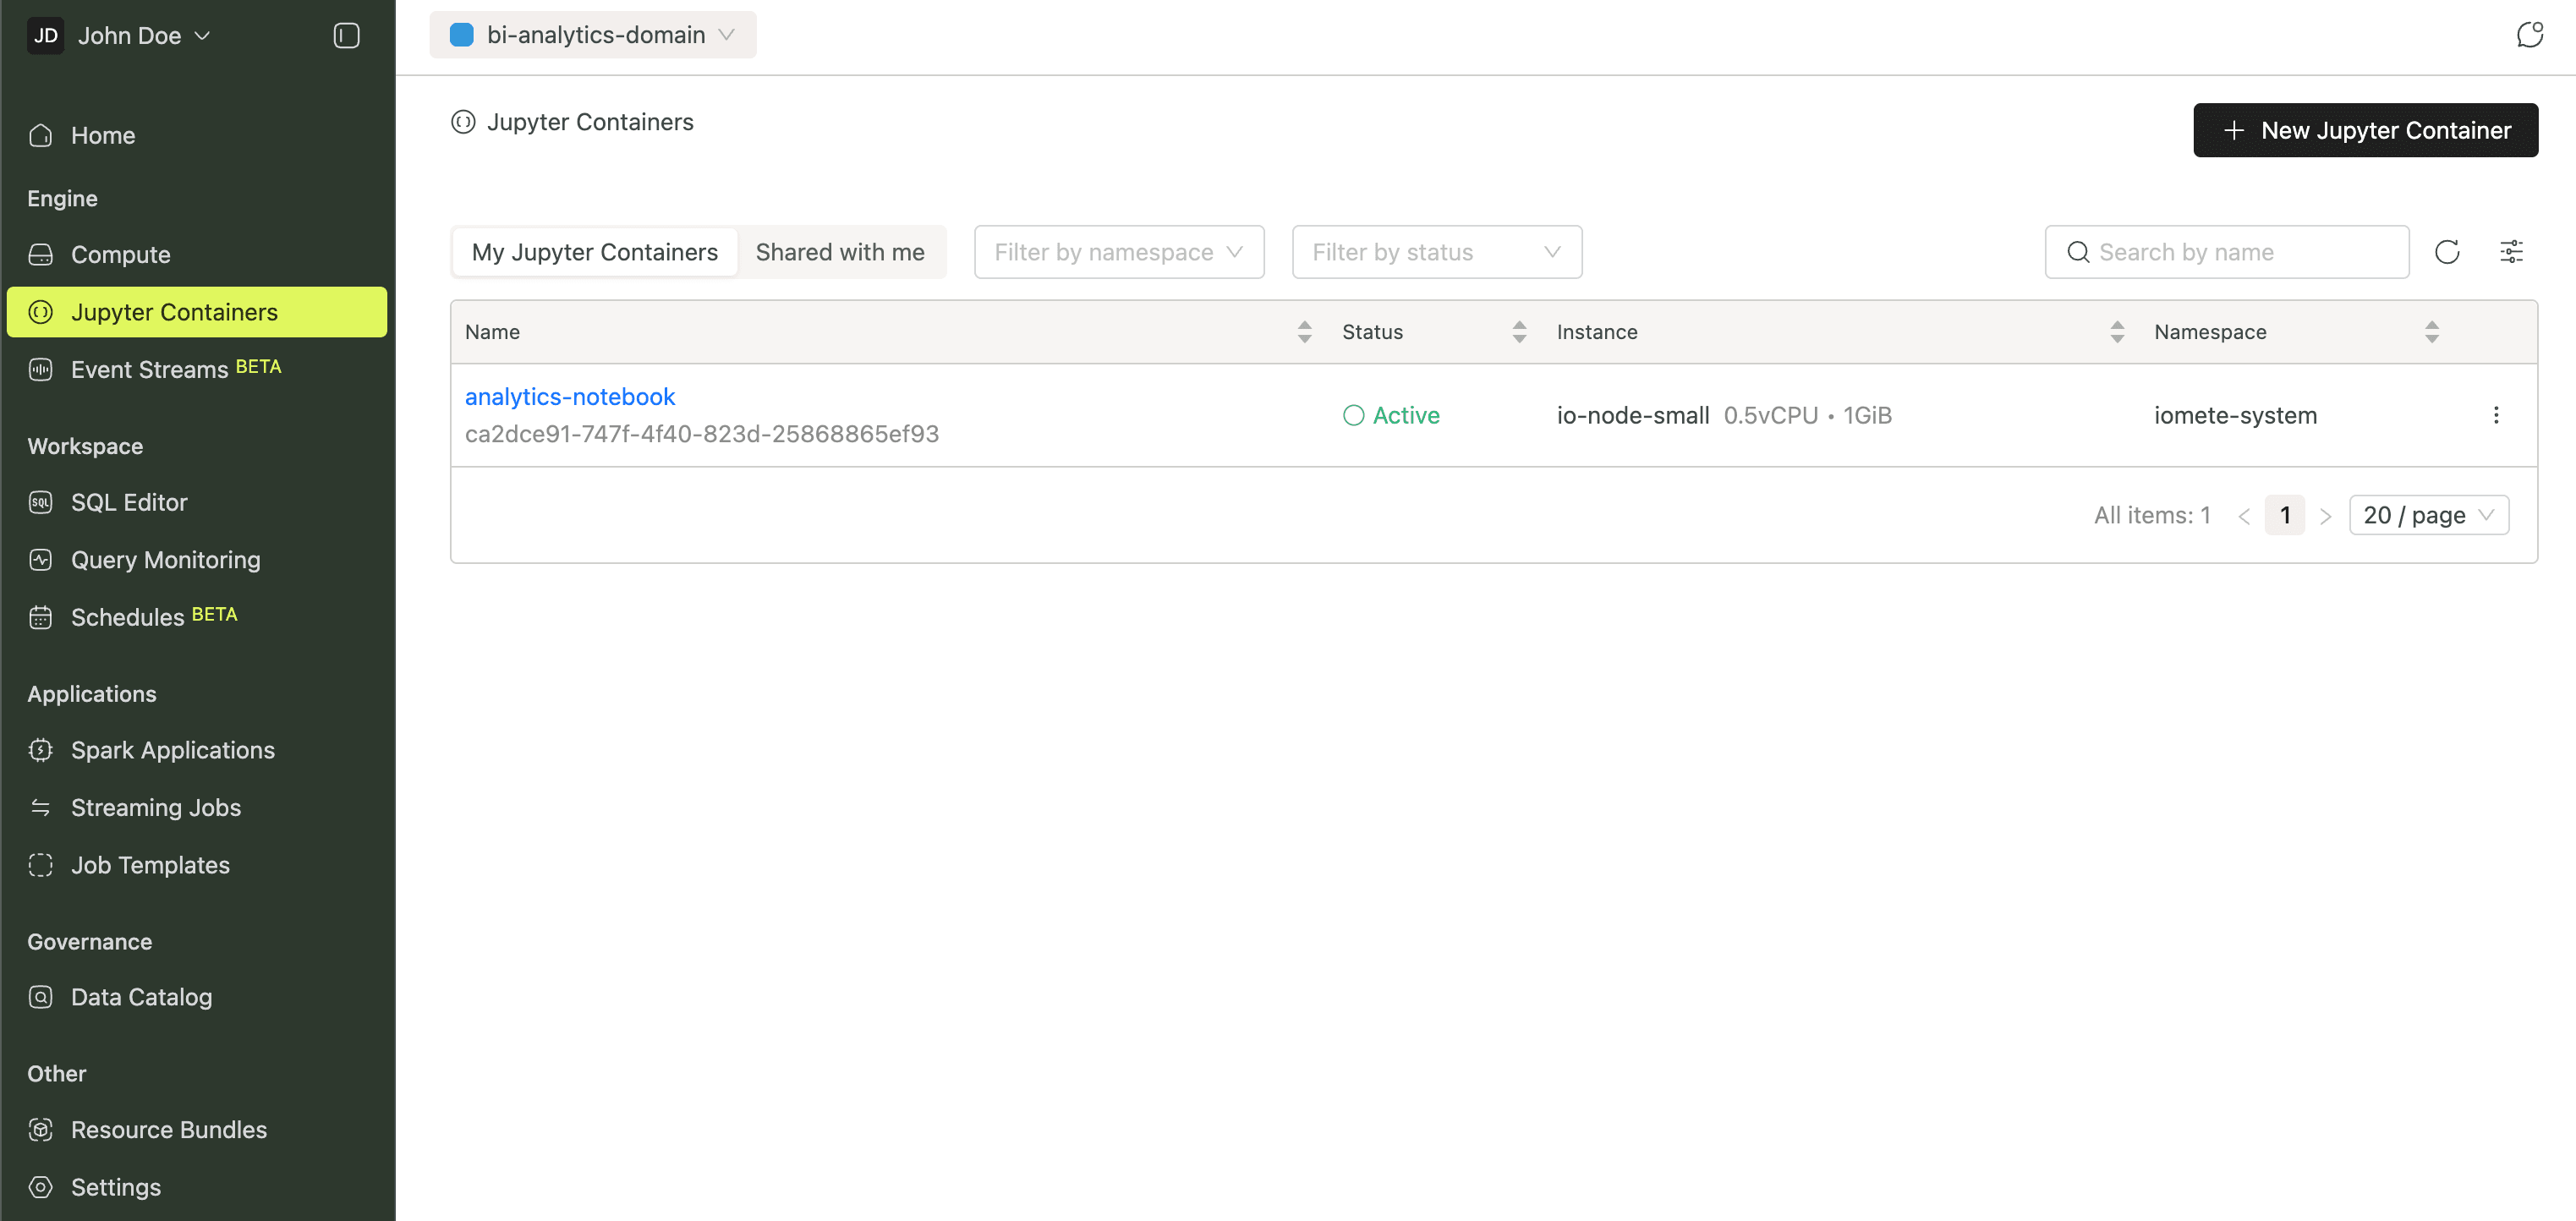
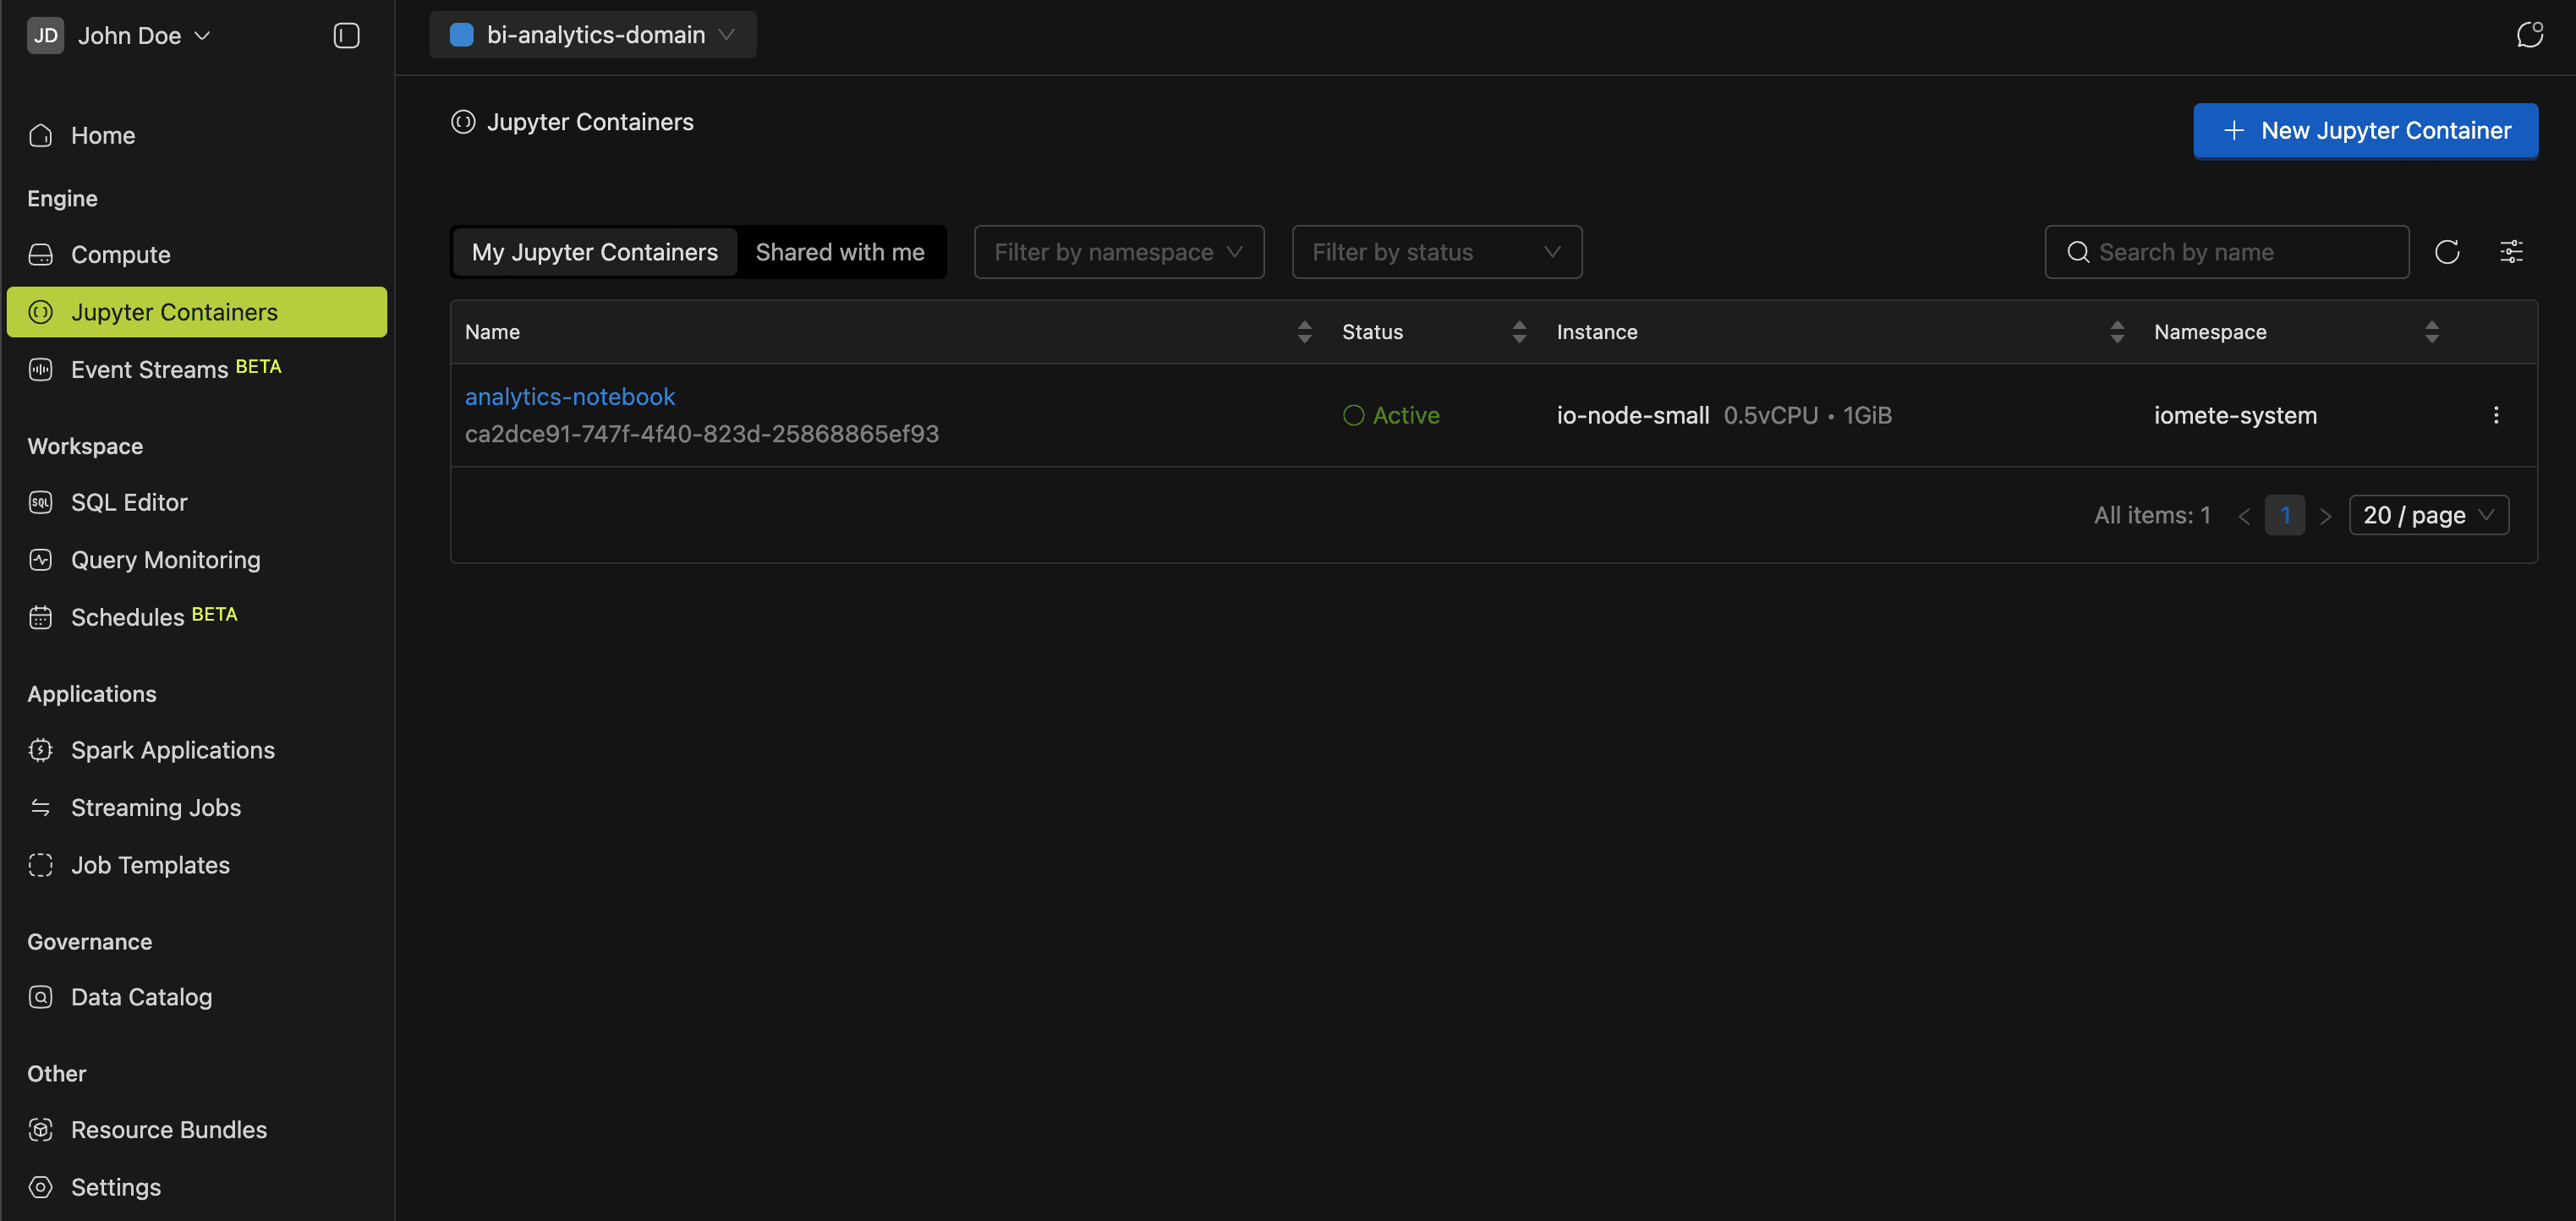
More in the Jupyter Containers guide.
Event Streams
Event Streams ingest events over HTTP and write them to Apache Iceberg tables in near real time. Deploy an ingestion endpoint, point your applications at it, and query the data with SQL. No message queues or extra infrastructure required.
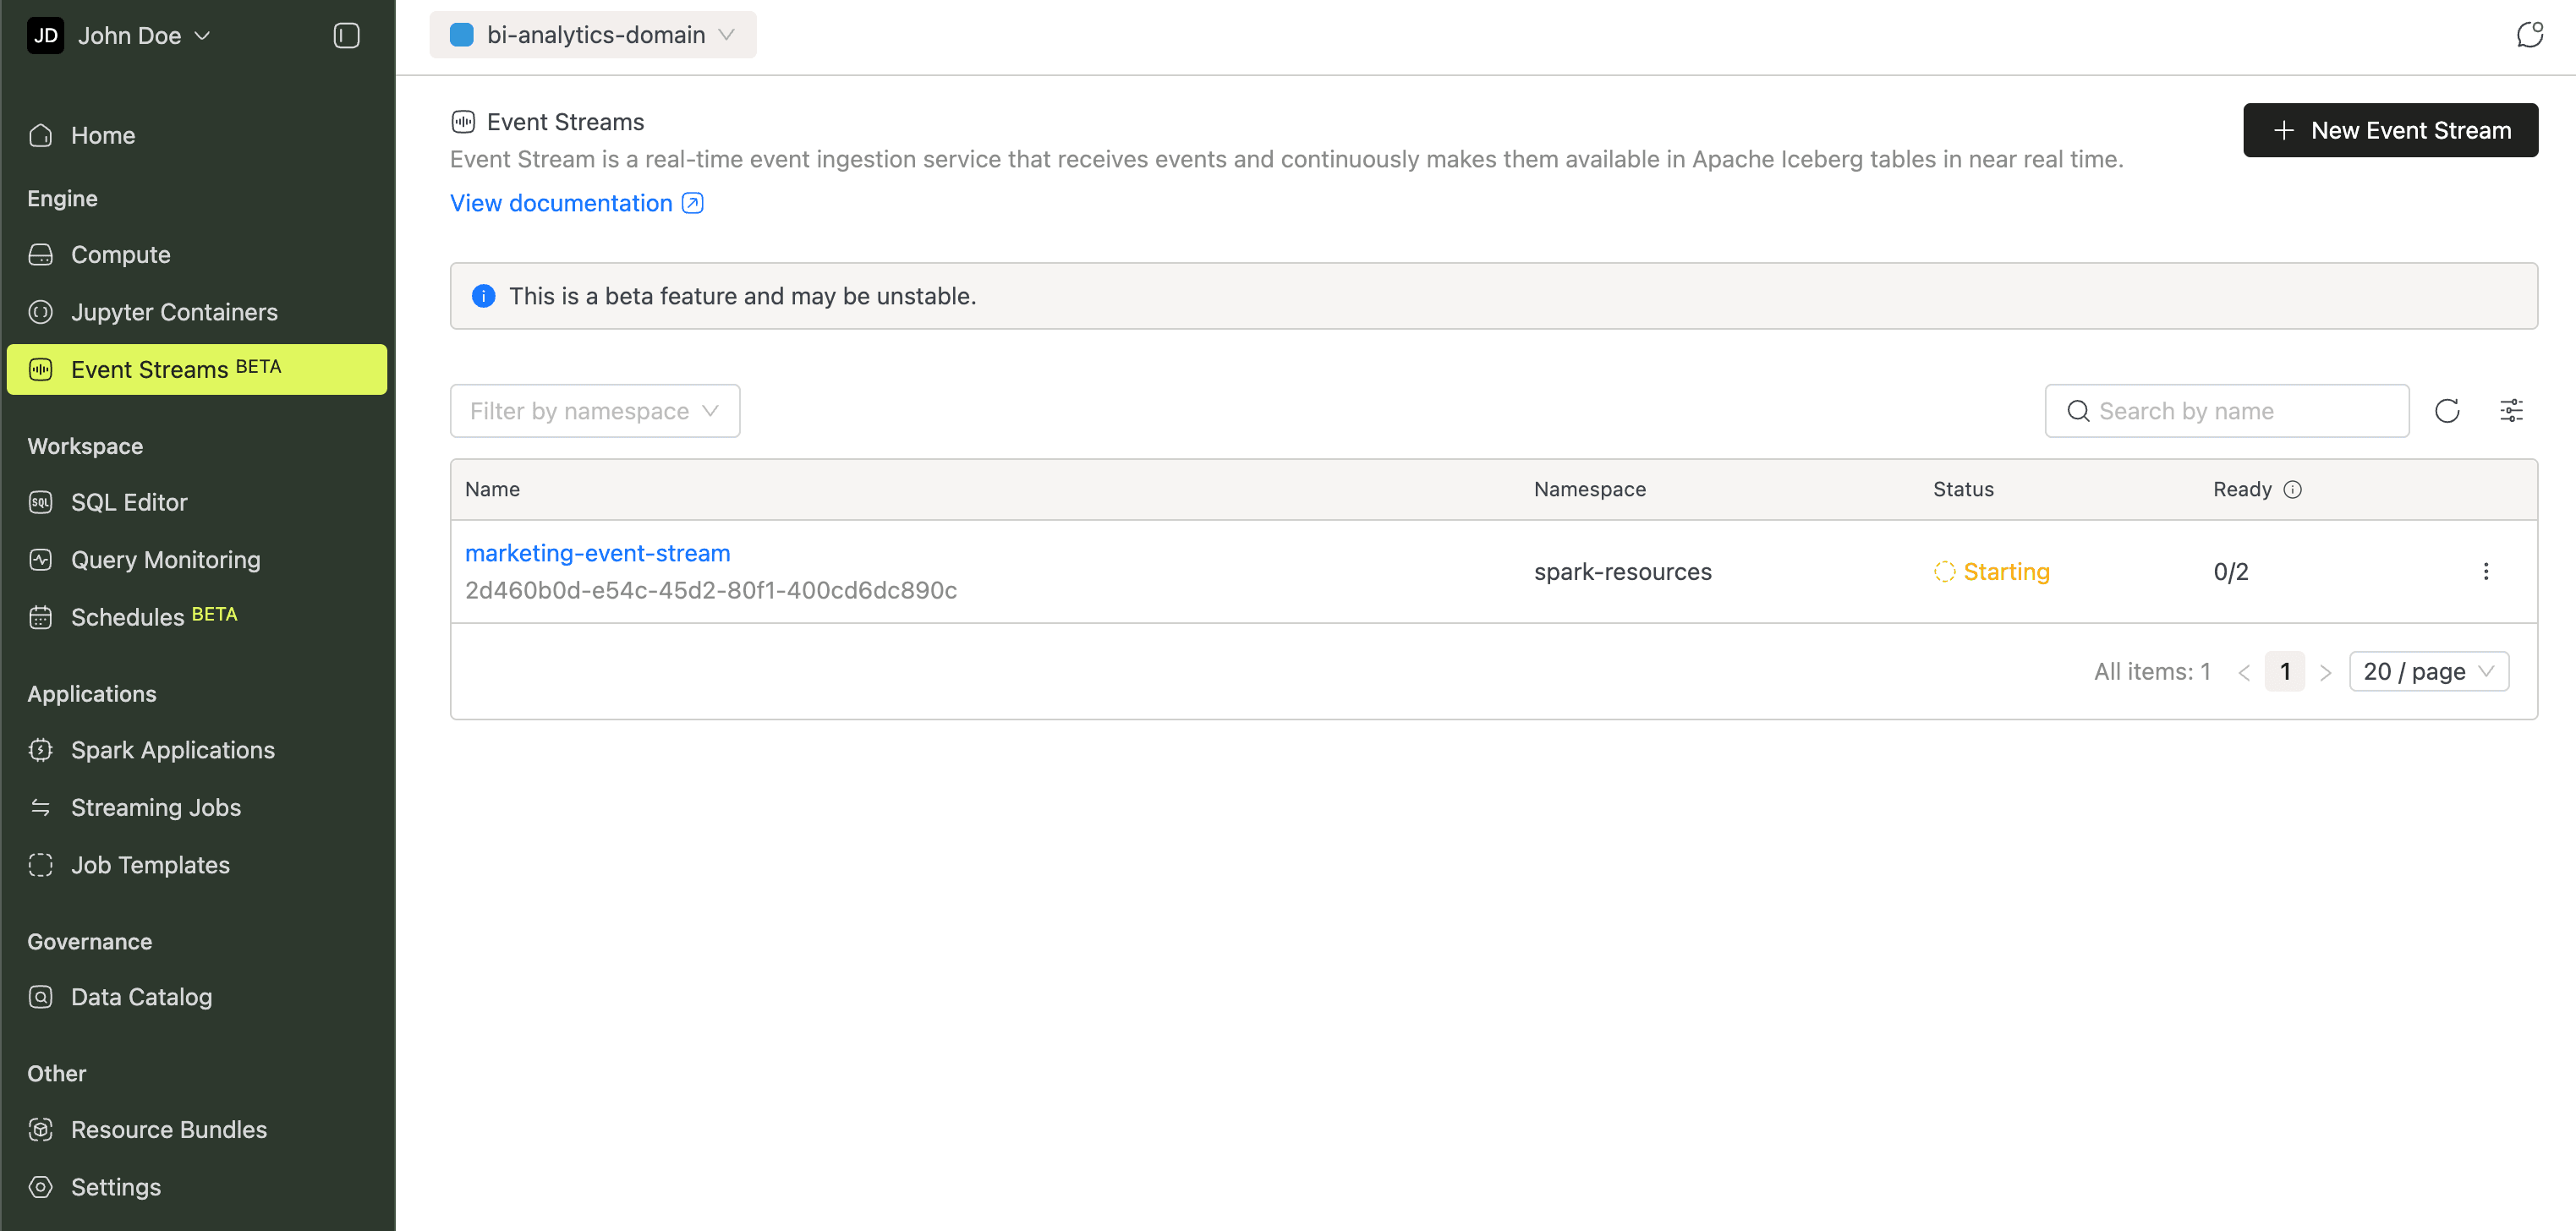
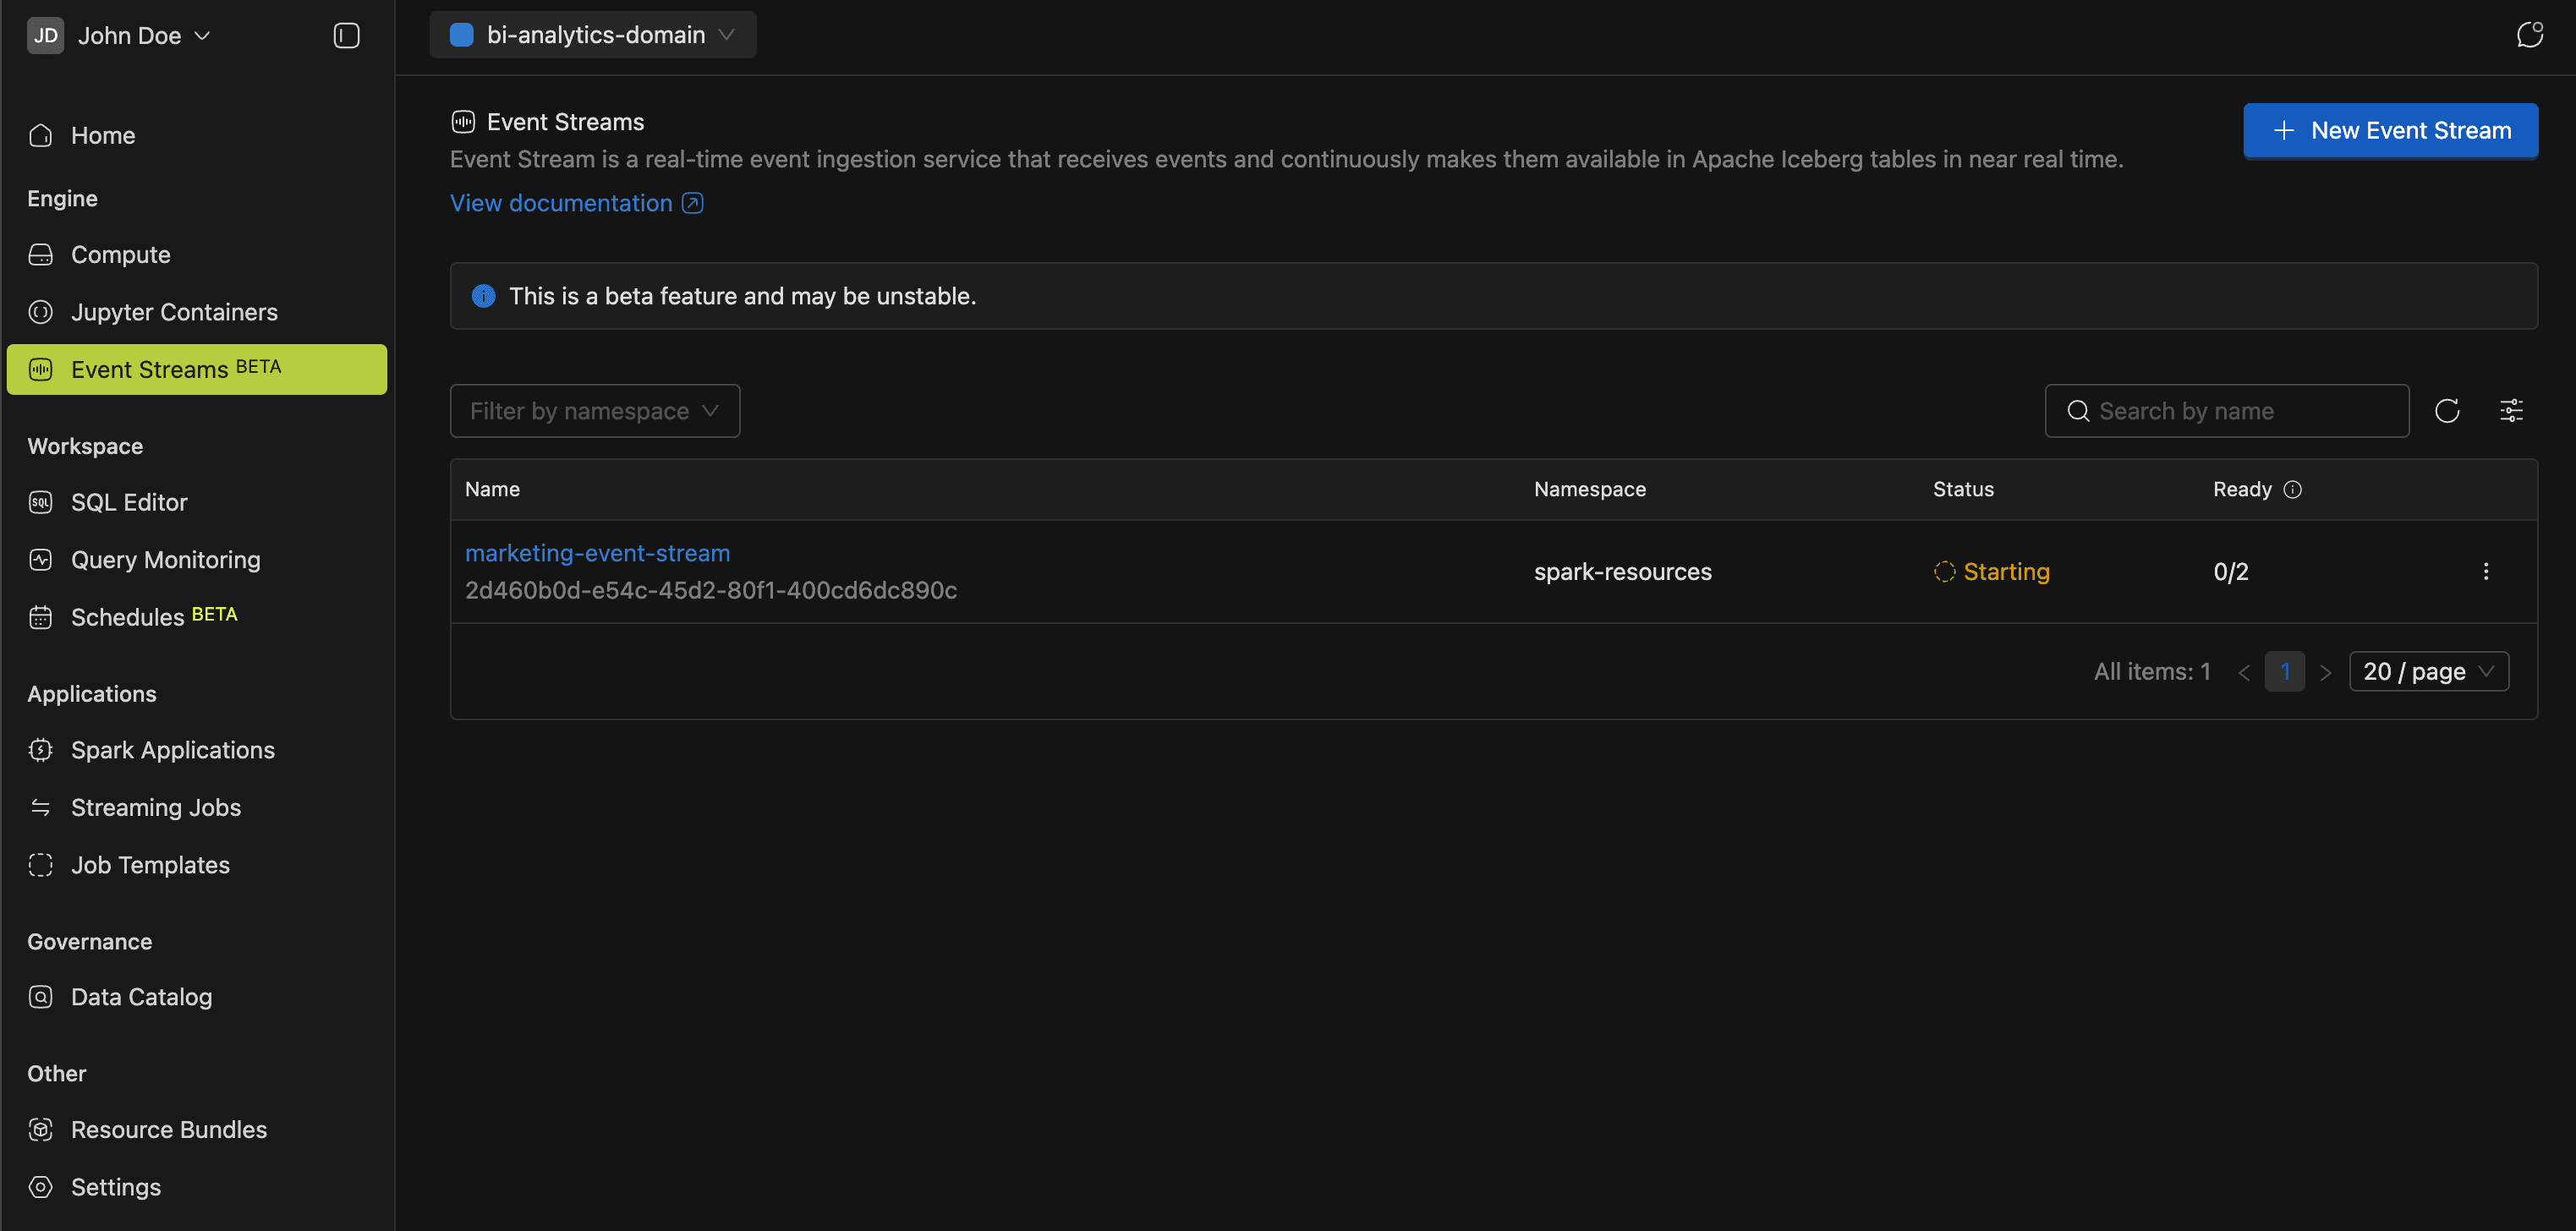
Details in the Event Stream guide.
Workspace
Most of your day-to-day SQL work happens in the Workspace. The sidebar groups three tools: SQL Editor, Query Monitoring, and Schedules.
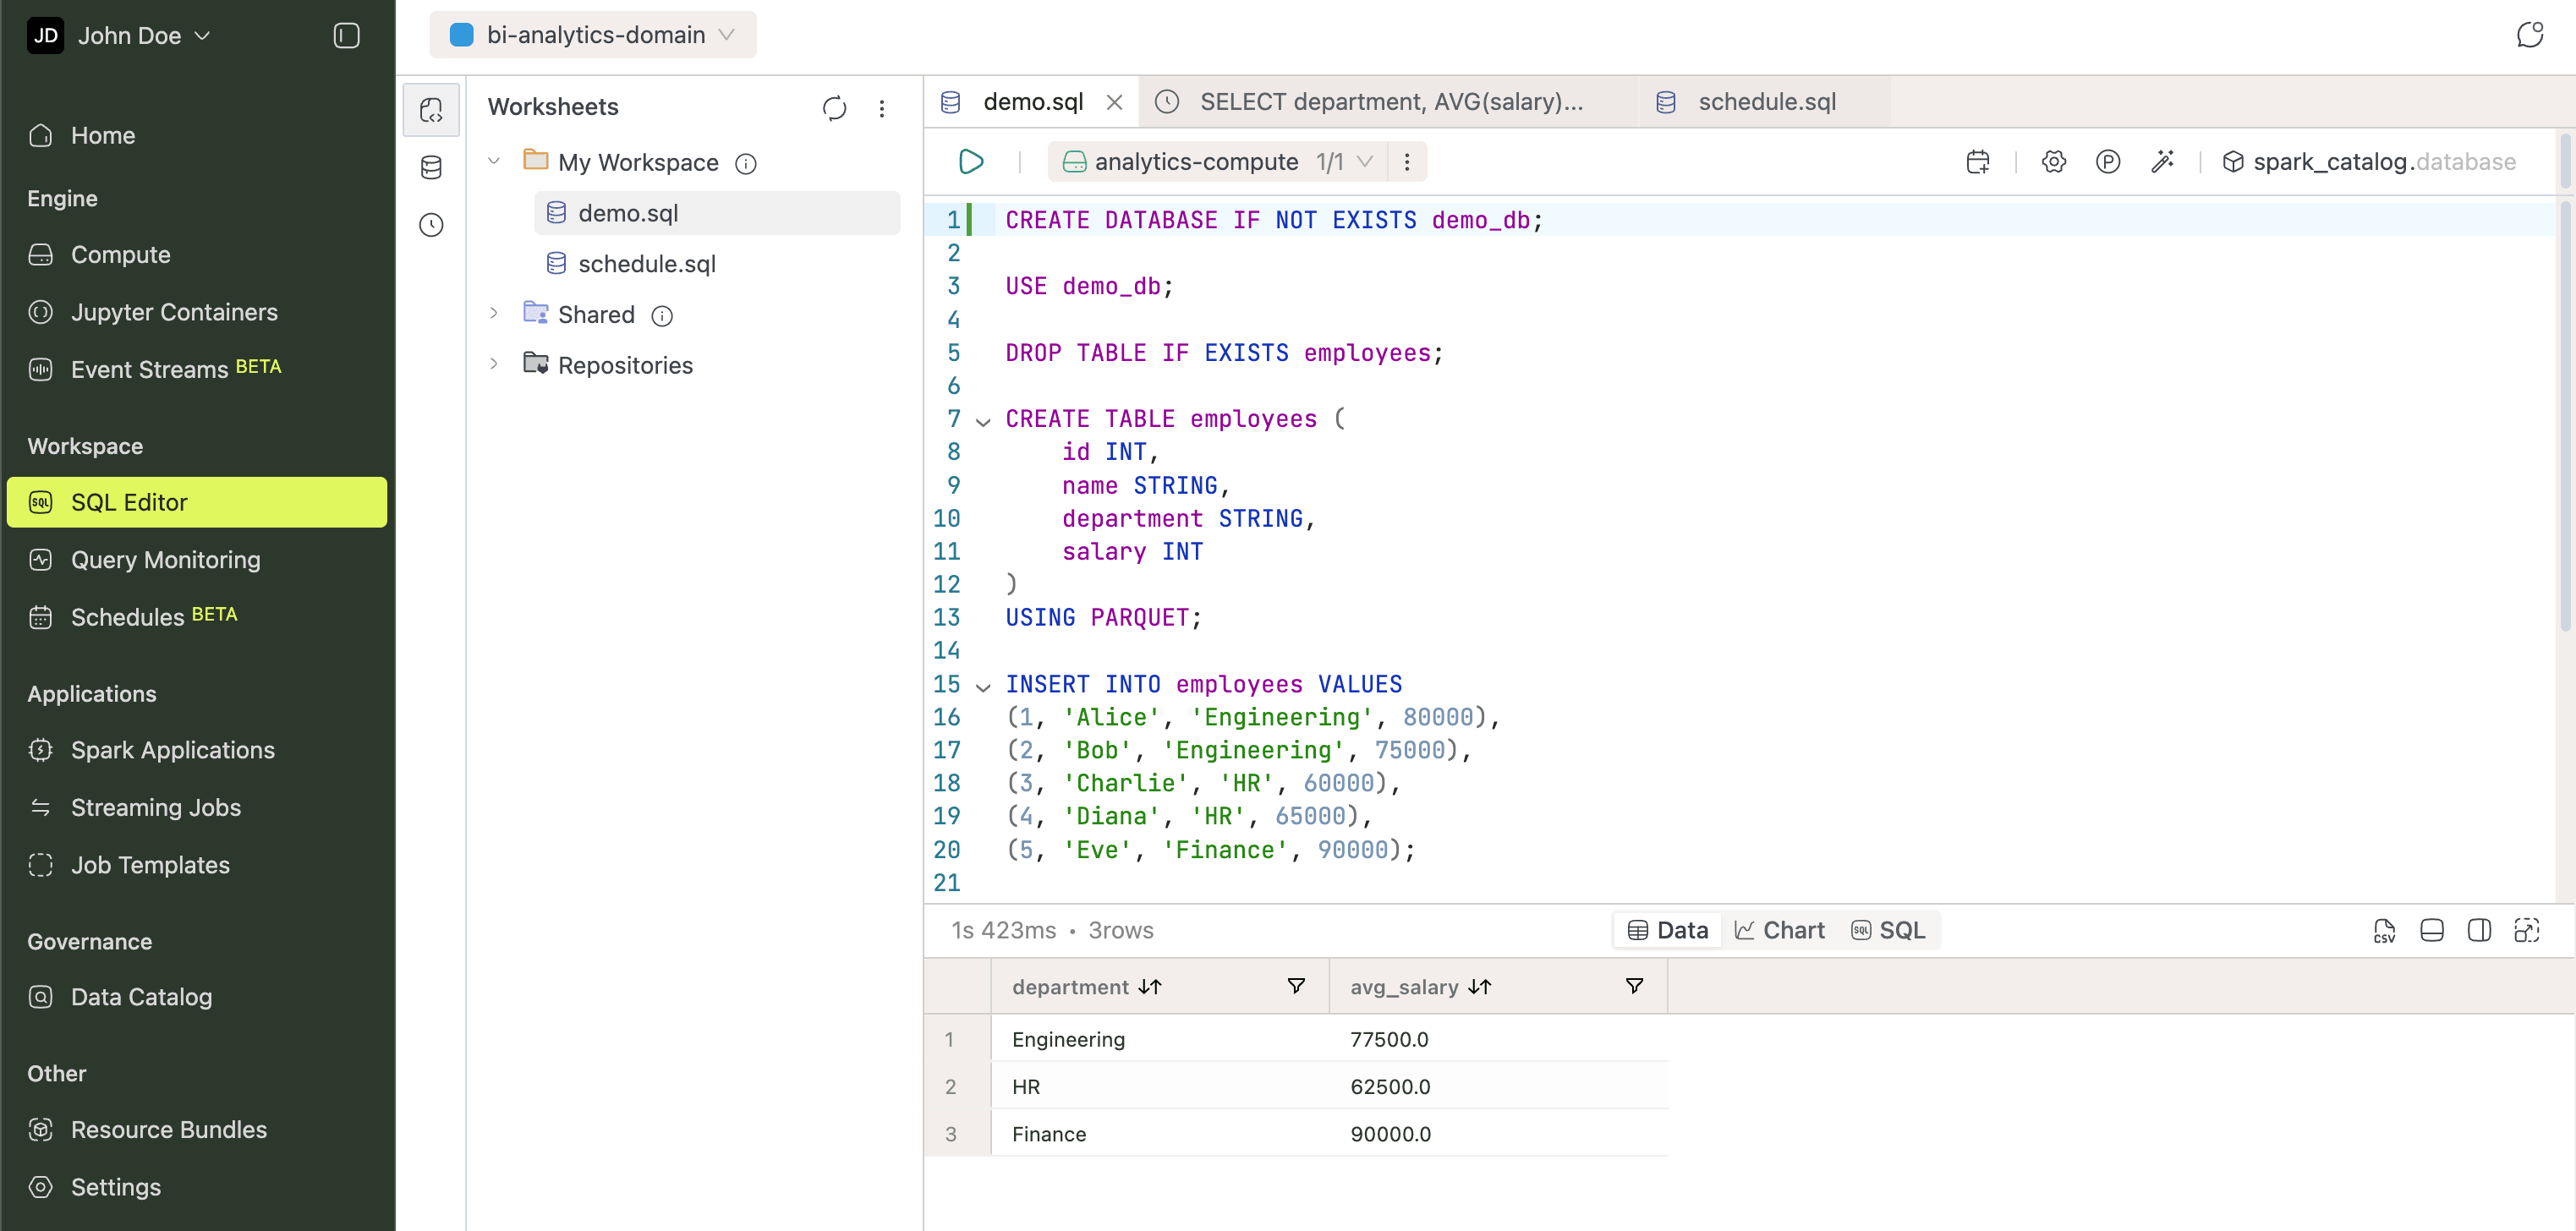
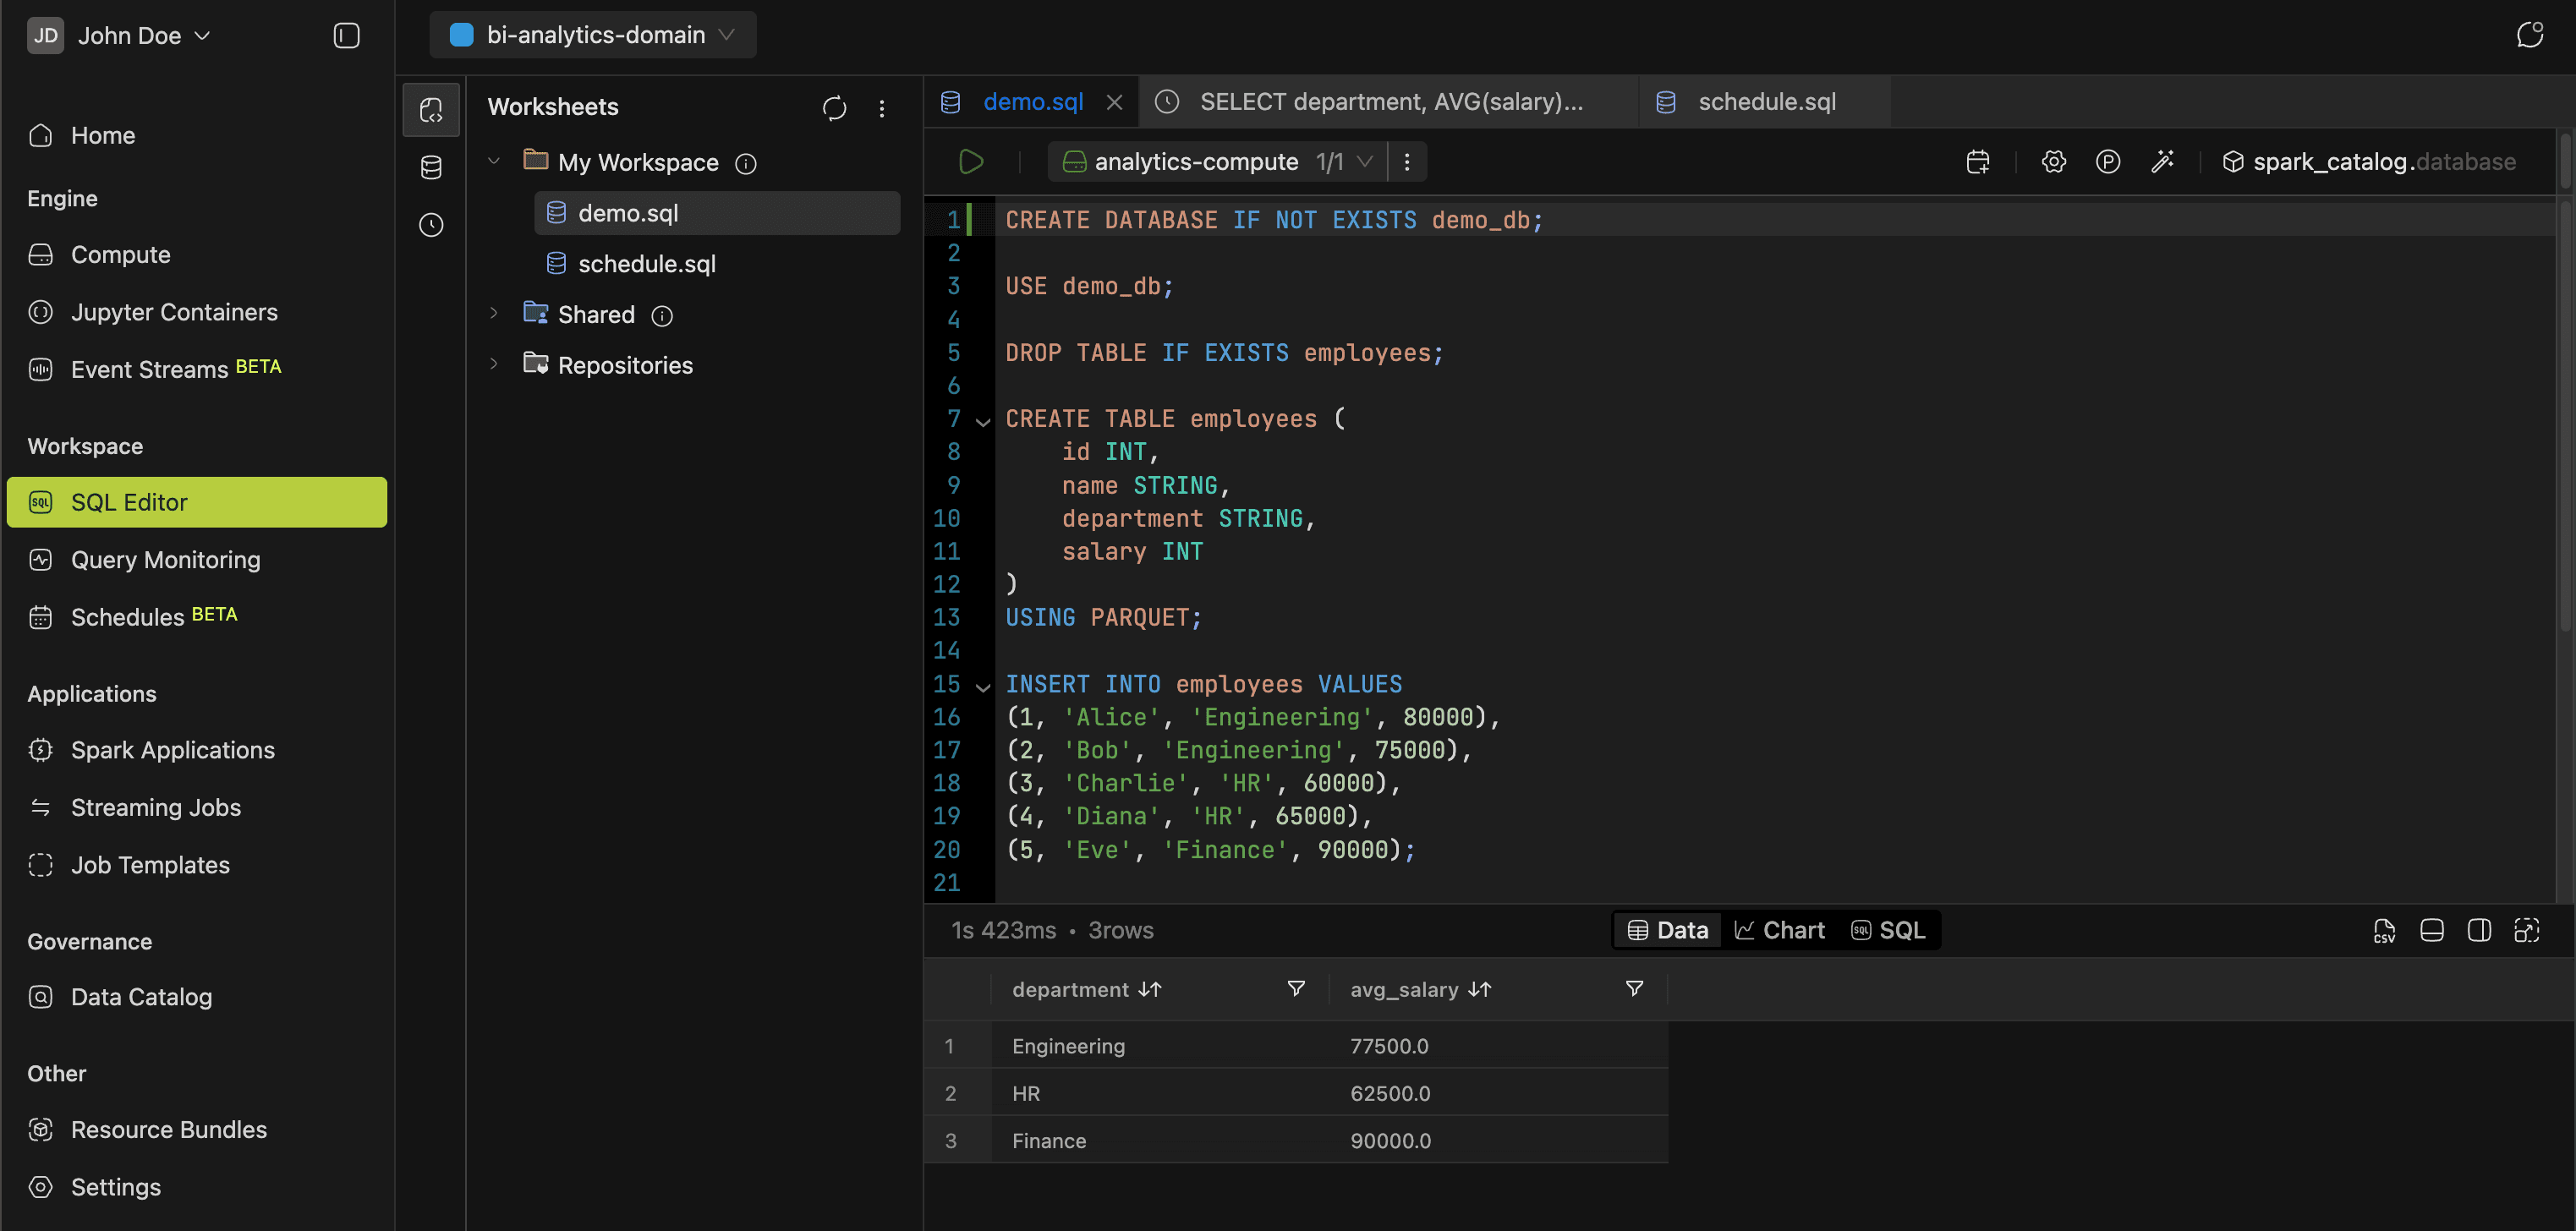
SQL Editor
The SQL Editor is where you write and run queries. The left icon bar switches between four panels:
- Worksheets: file tree that organizes worksheets and dashboards into personal or shared workspaces.
- Database Explorer: browse catalogs, schemas, tables, views, and columns.
- Query History: logs every query you run, with time range and status filters. Reopen any past query in the active worksheet.
Before running a query, select a compute cluster and namespace from the top bar. The editor autocompletes database objects as you type. Results display as tables or charts. Build Dashboards from your results and export them to PDF.
Learn more in the SQL Editor guide.
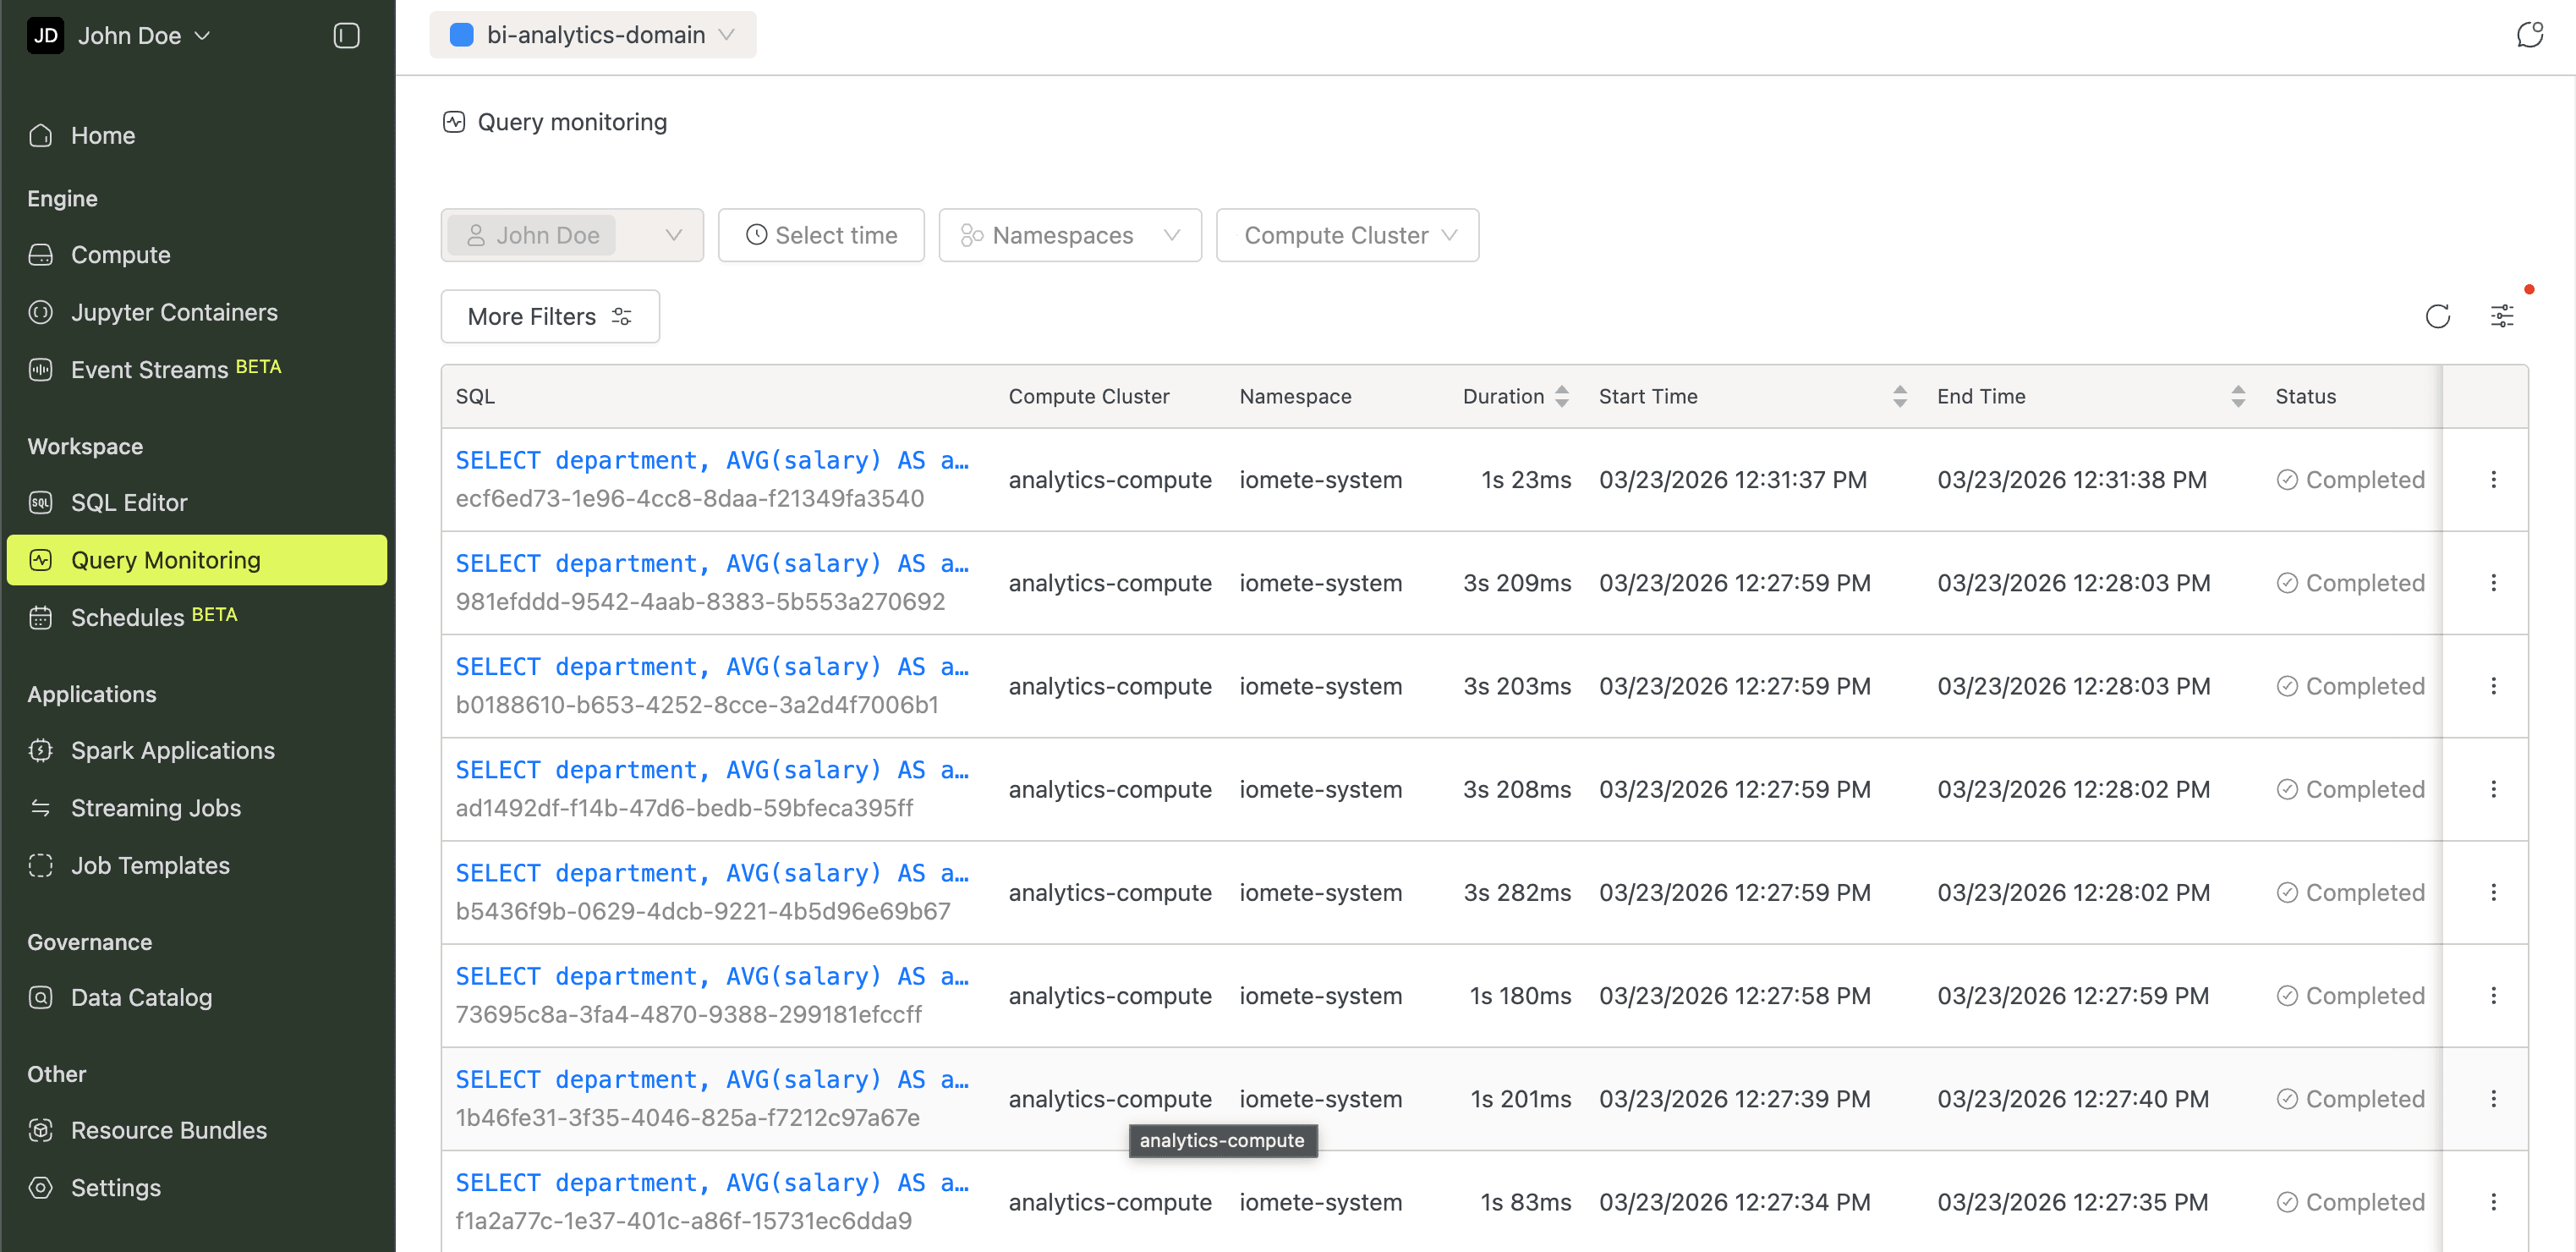
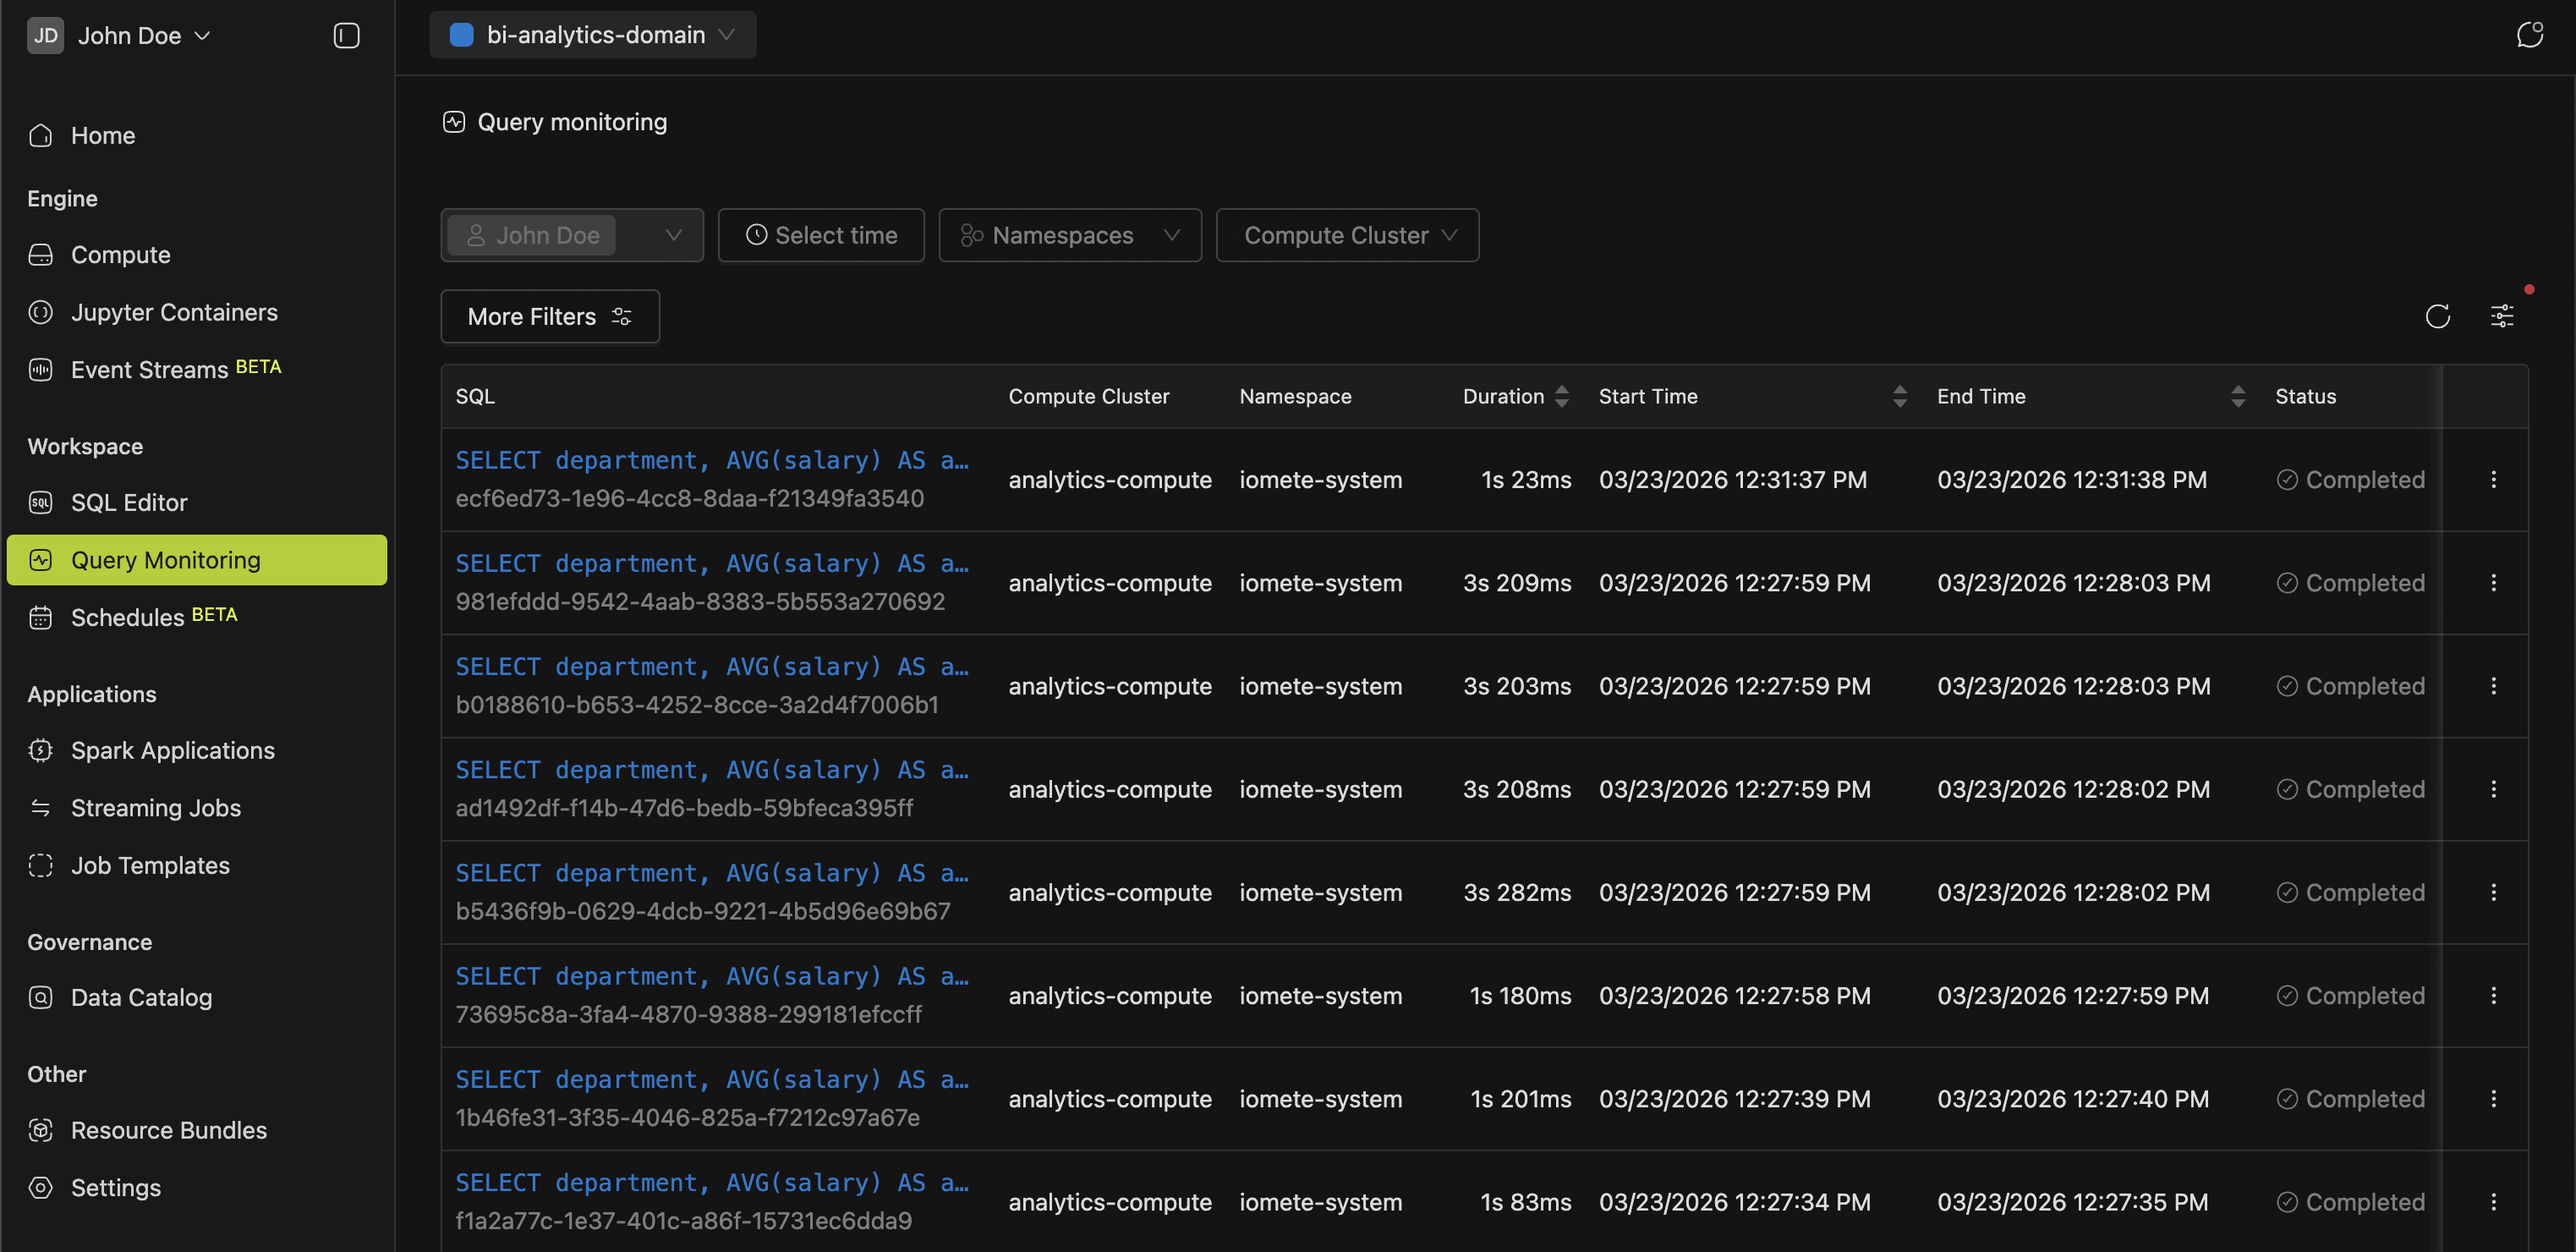
Query Monitoring
Keeping tabs on what's running across your clusters prevents bottlenecks. This view lists active queries across all compute clusters, so you can spot long-running or stuck queries early.
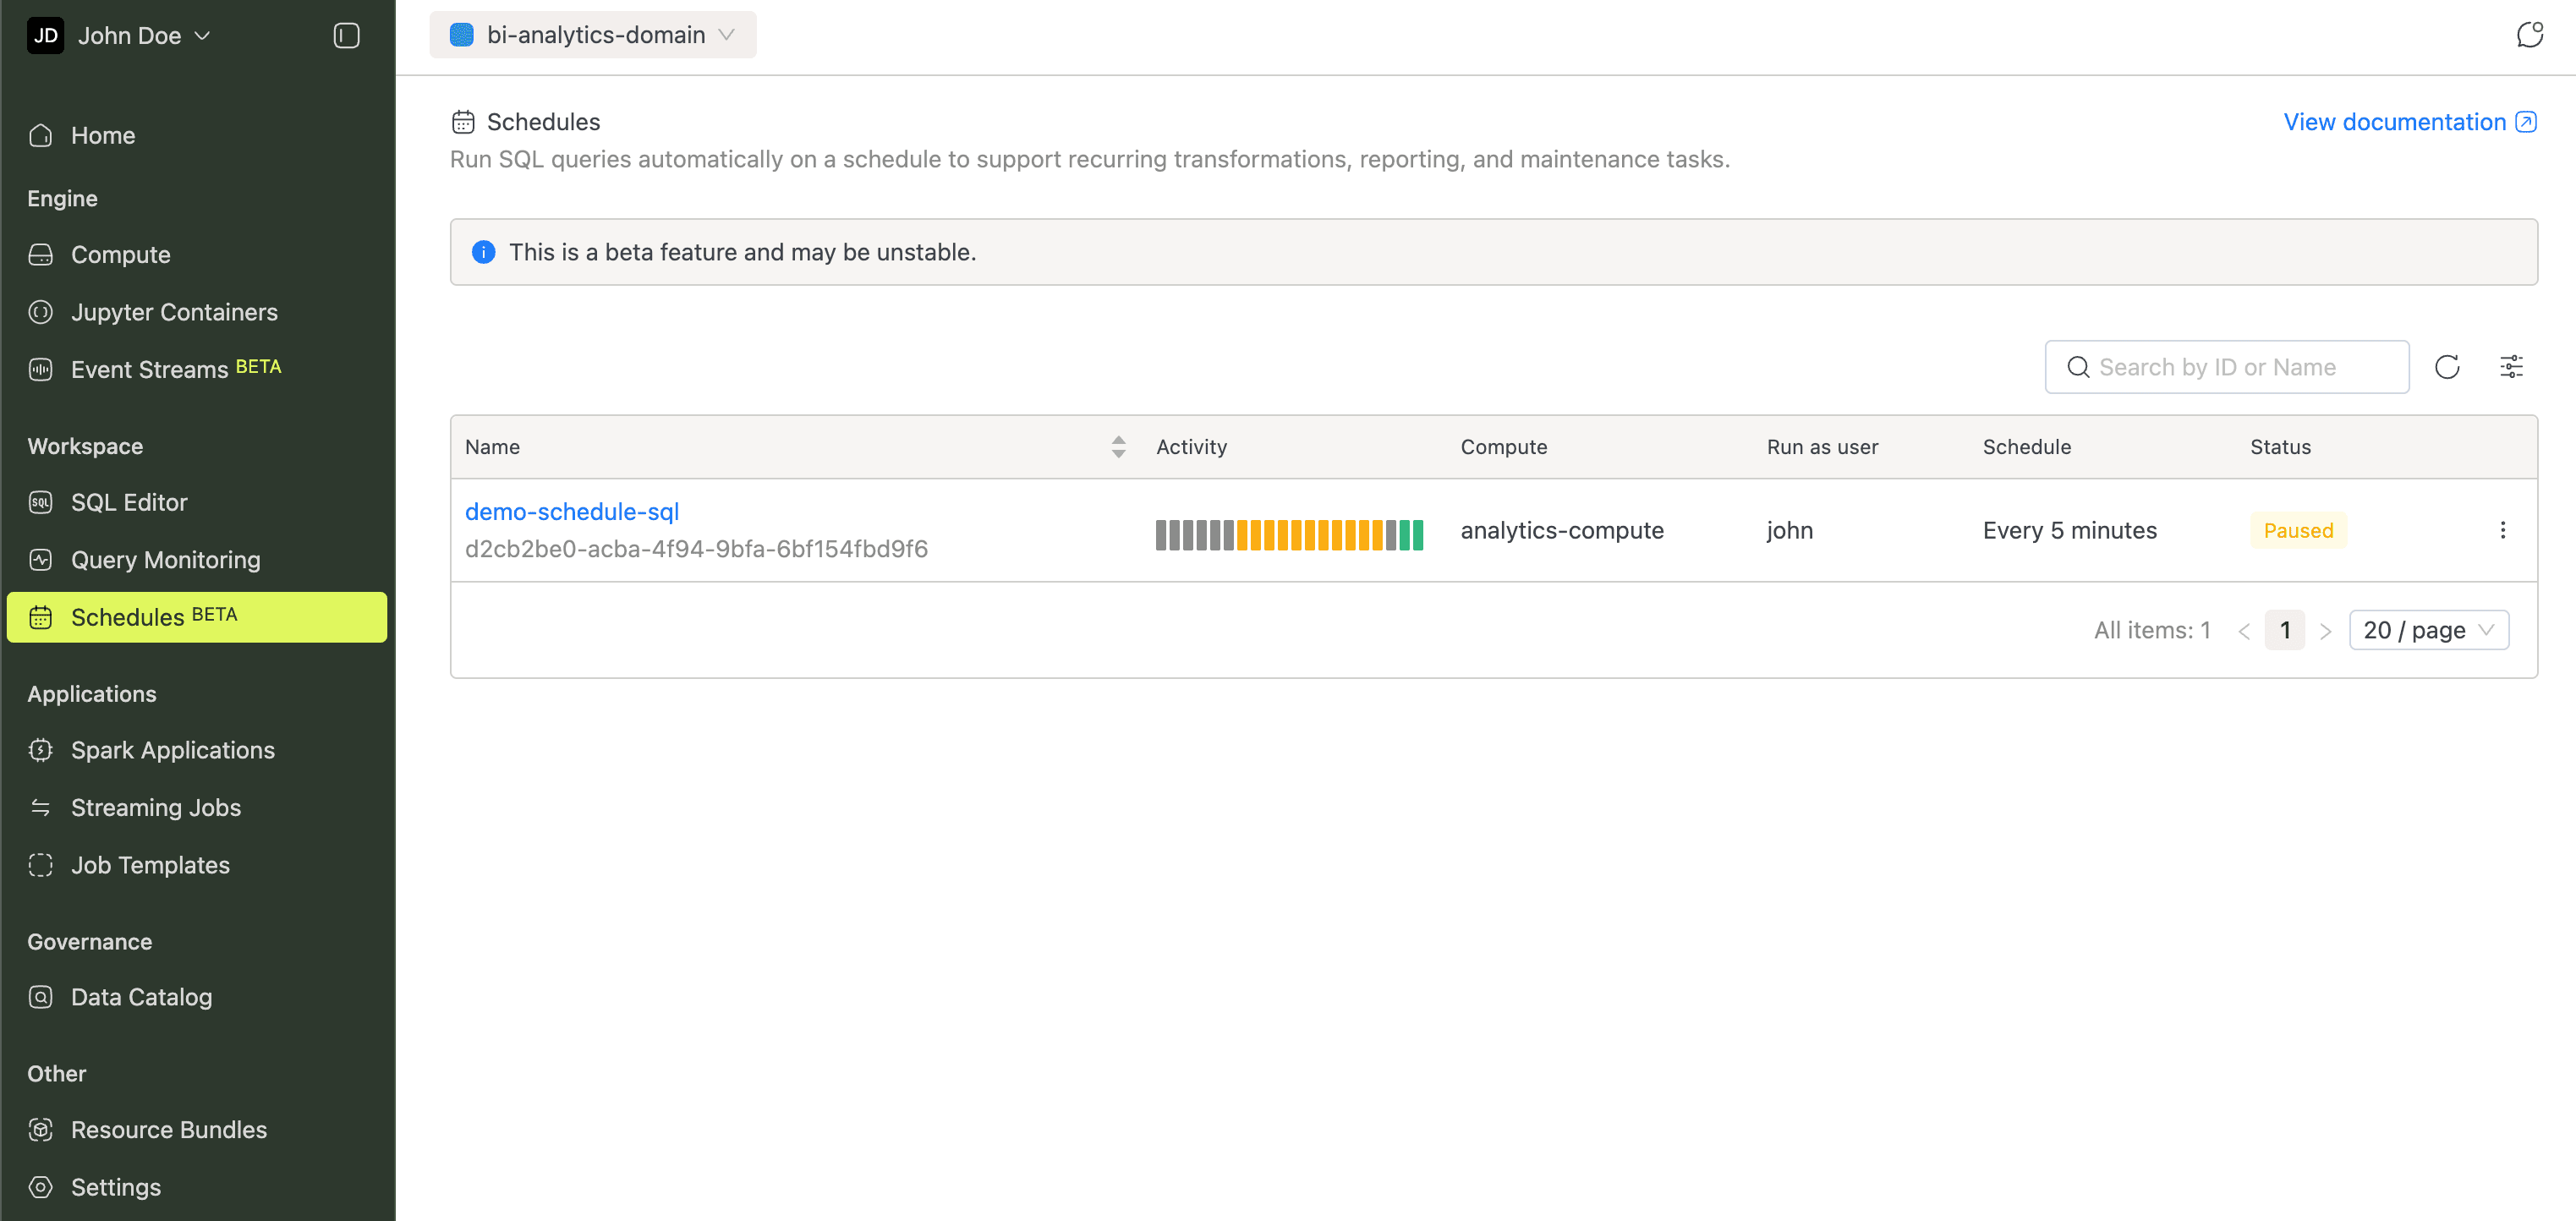
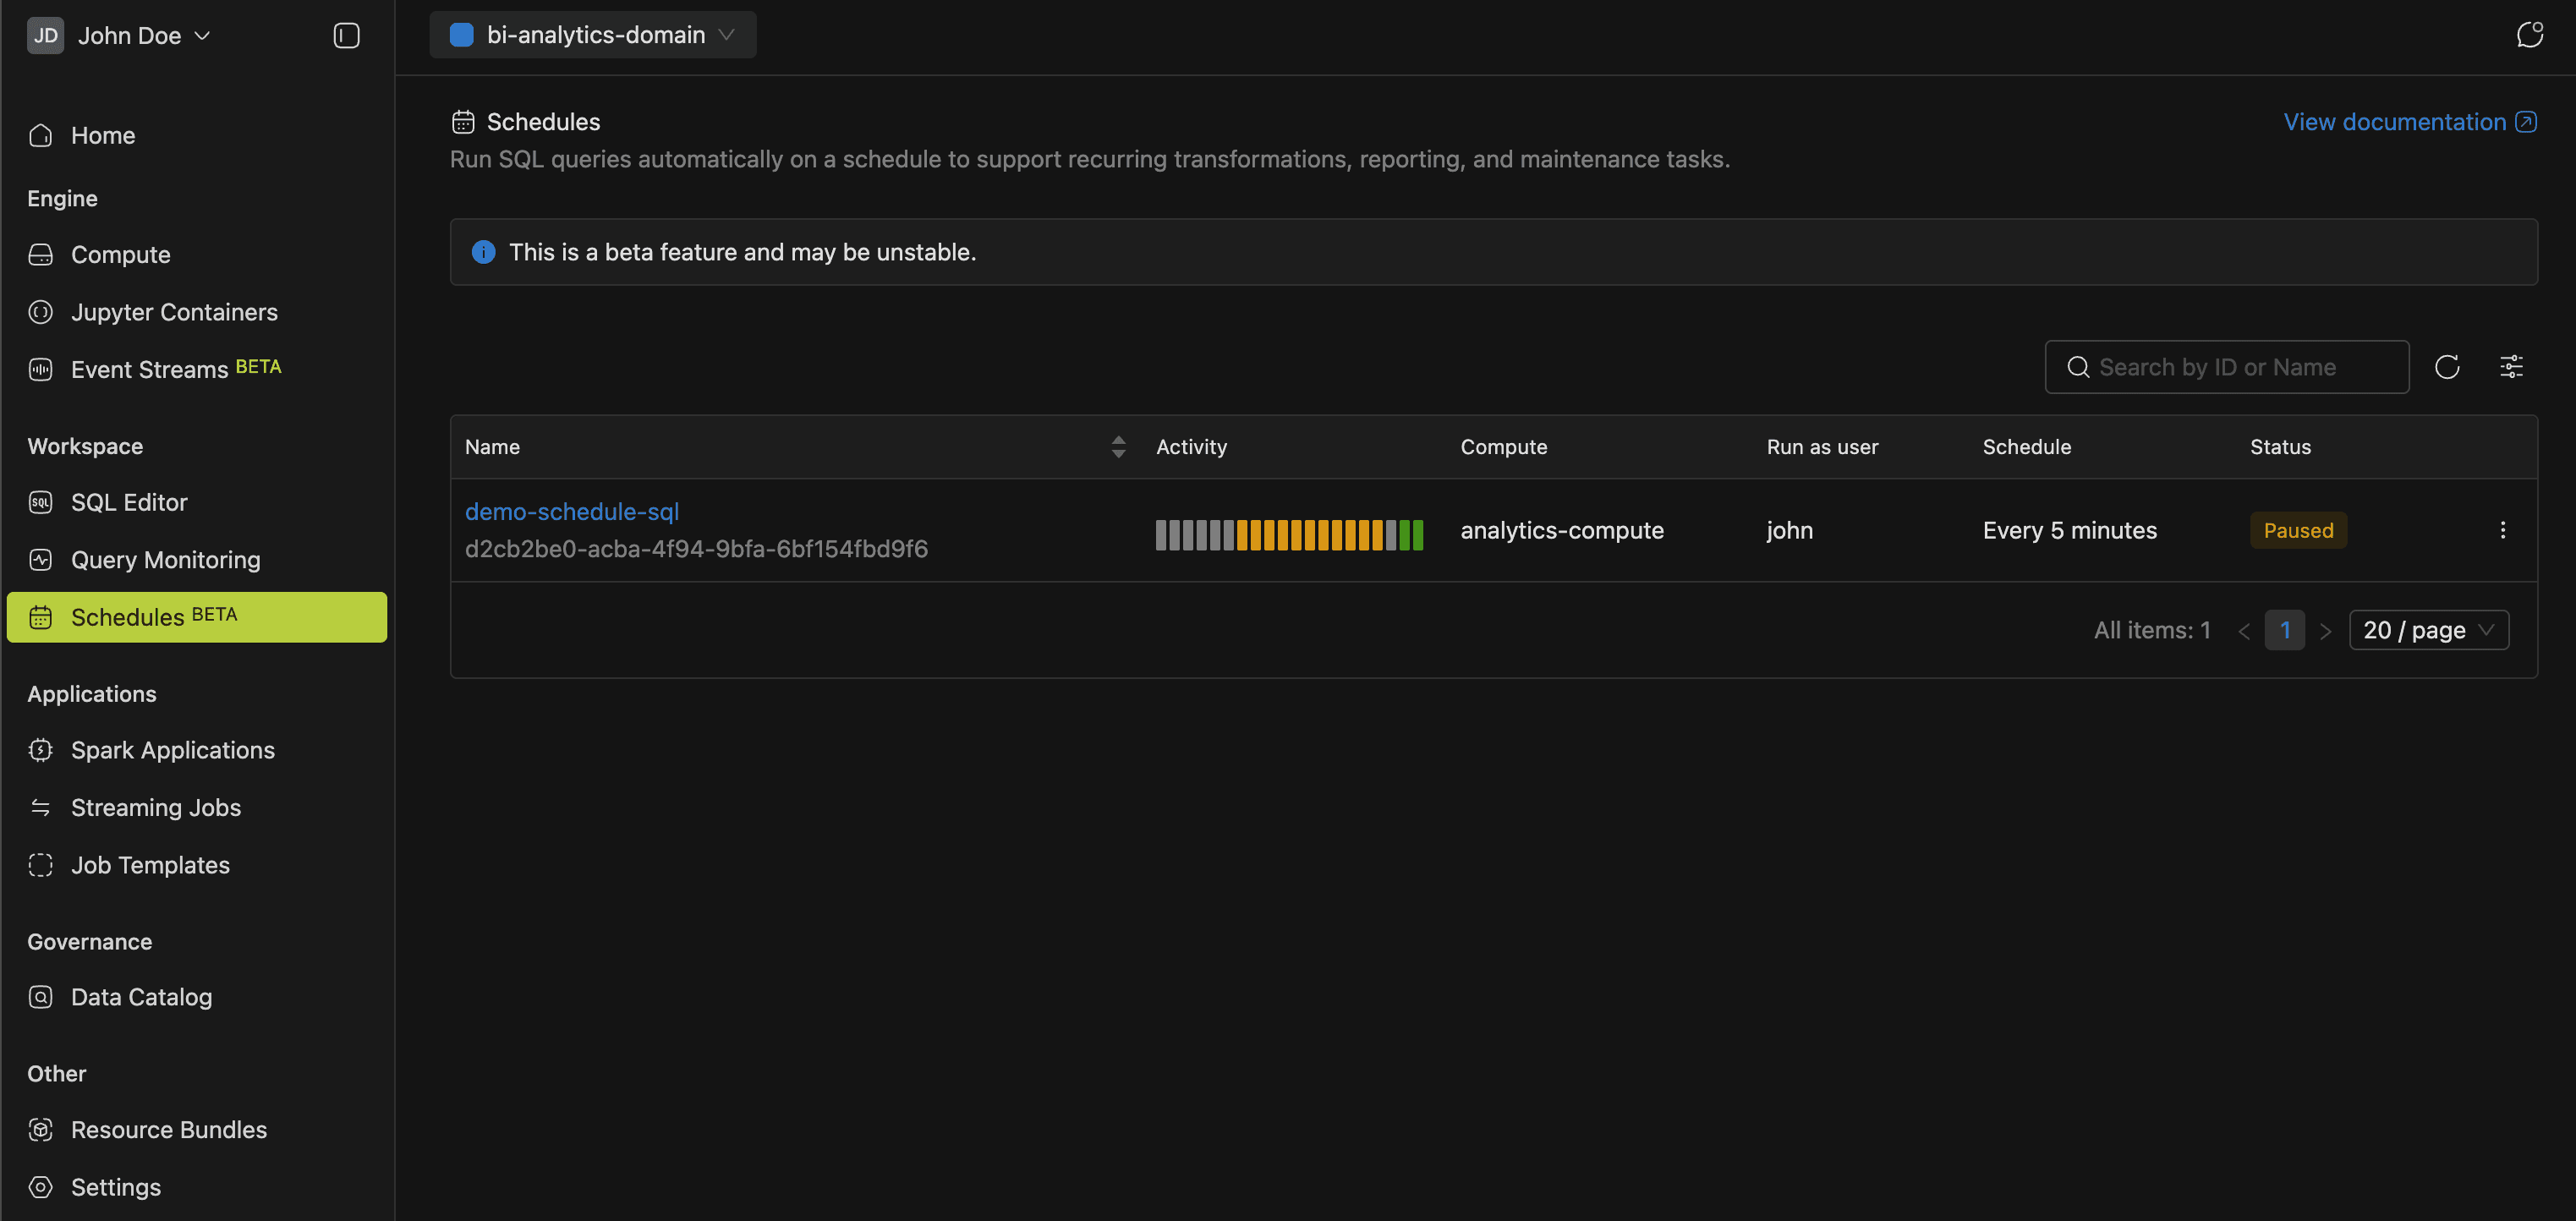
Schedules
Recurring SQL work like transformations, reports, and maintenance doesn't have to be manual. Set up cron-based schedules and track each run's status and results.
The Query Scheduling guide walks through setup.
Applications
Whether you're running one-off batch jobs or long-lived streams, the Applications section tracks all your Spark workloads in one place.
Spark Applications
This page charts every Spark application run with interactive visualizations. Filter by time range, user, status, or tags to spot issues quickly.
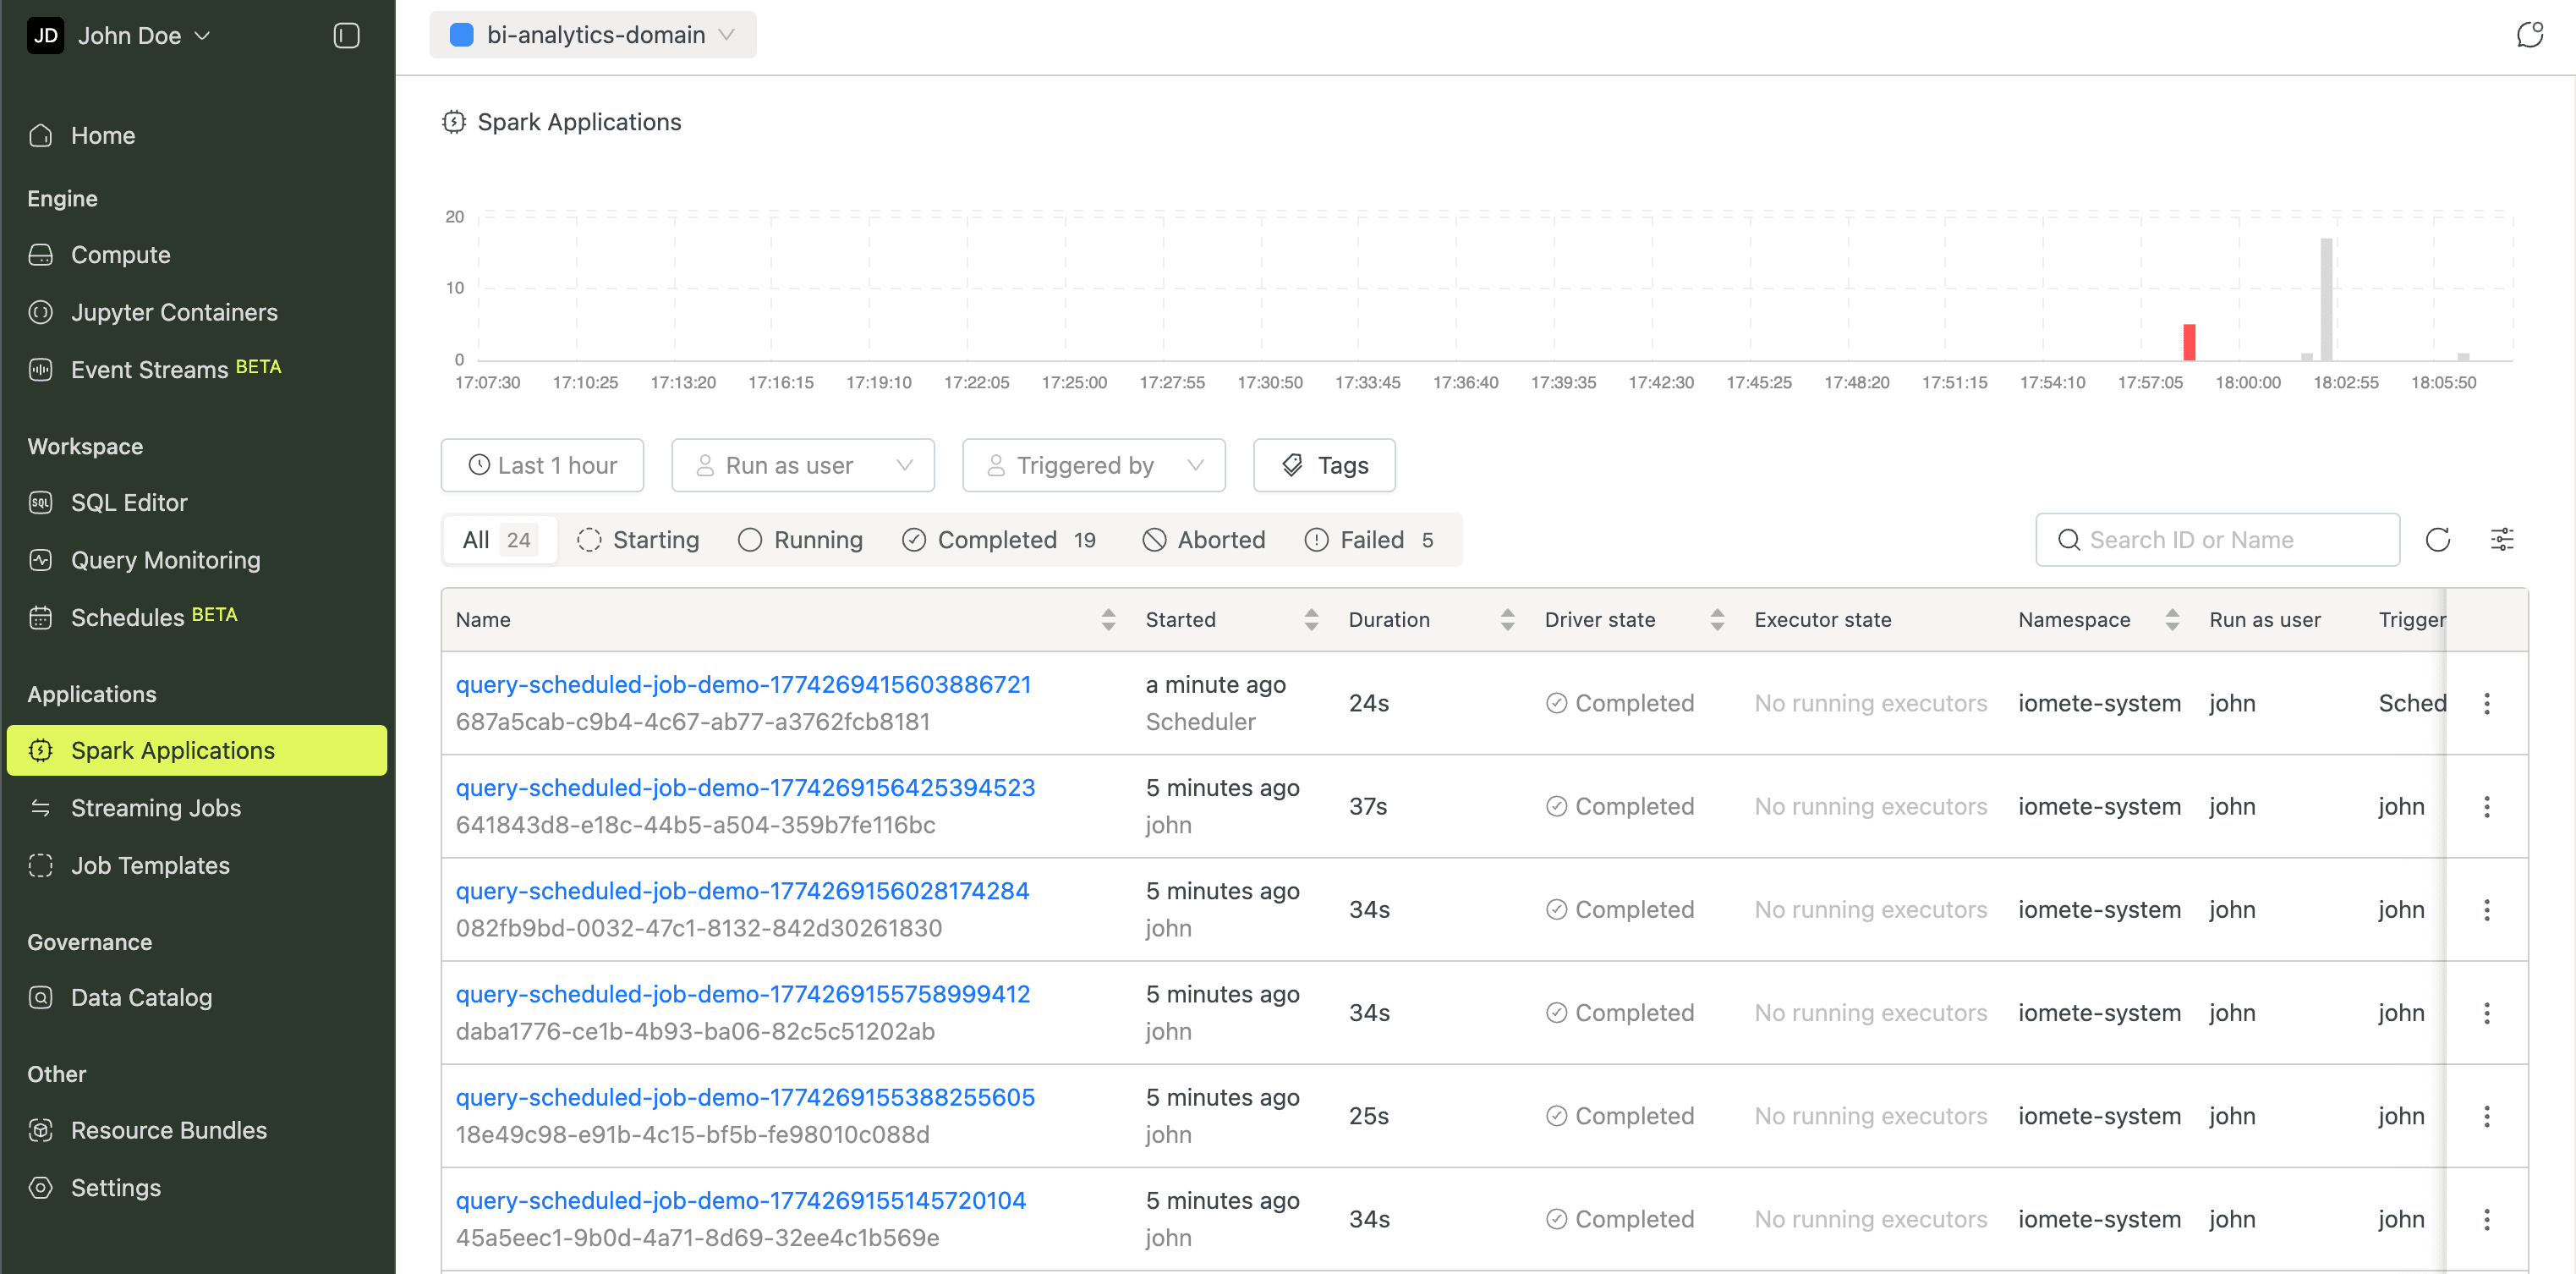
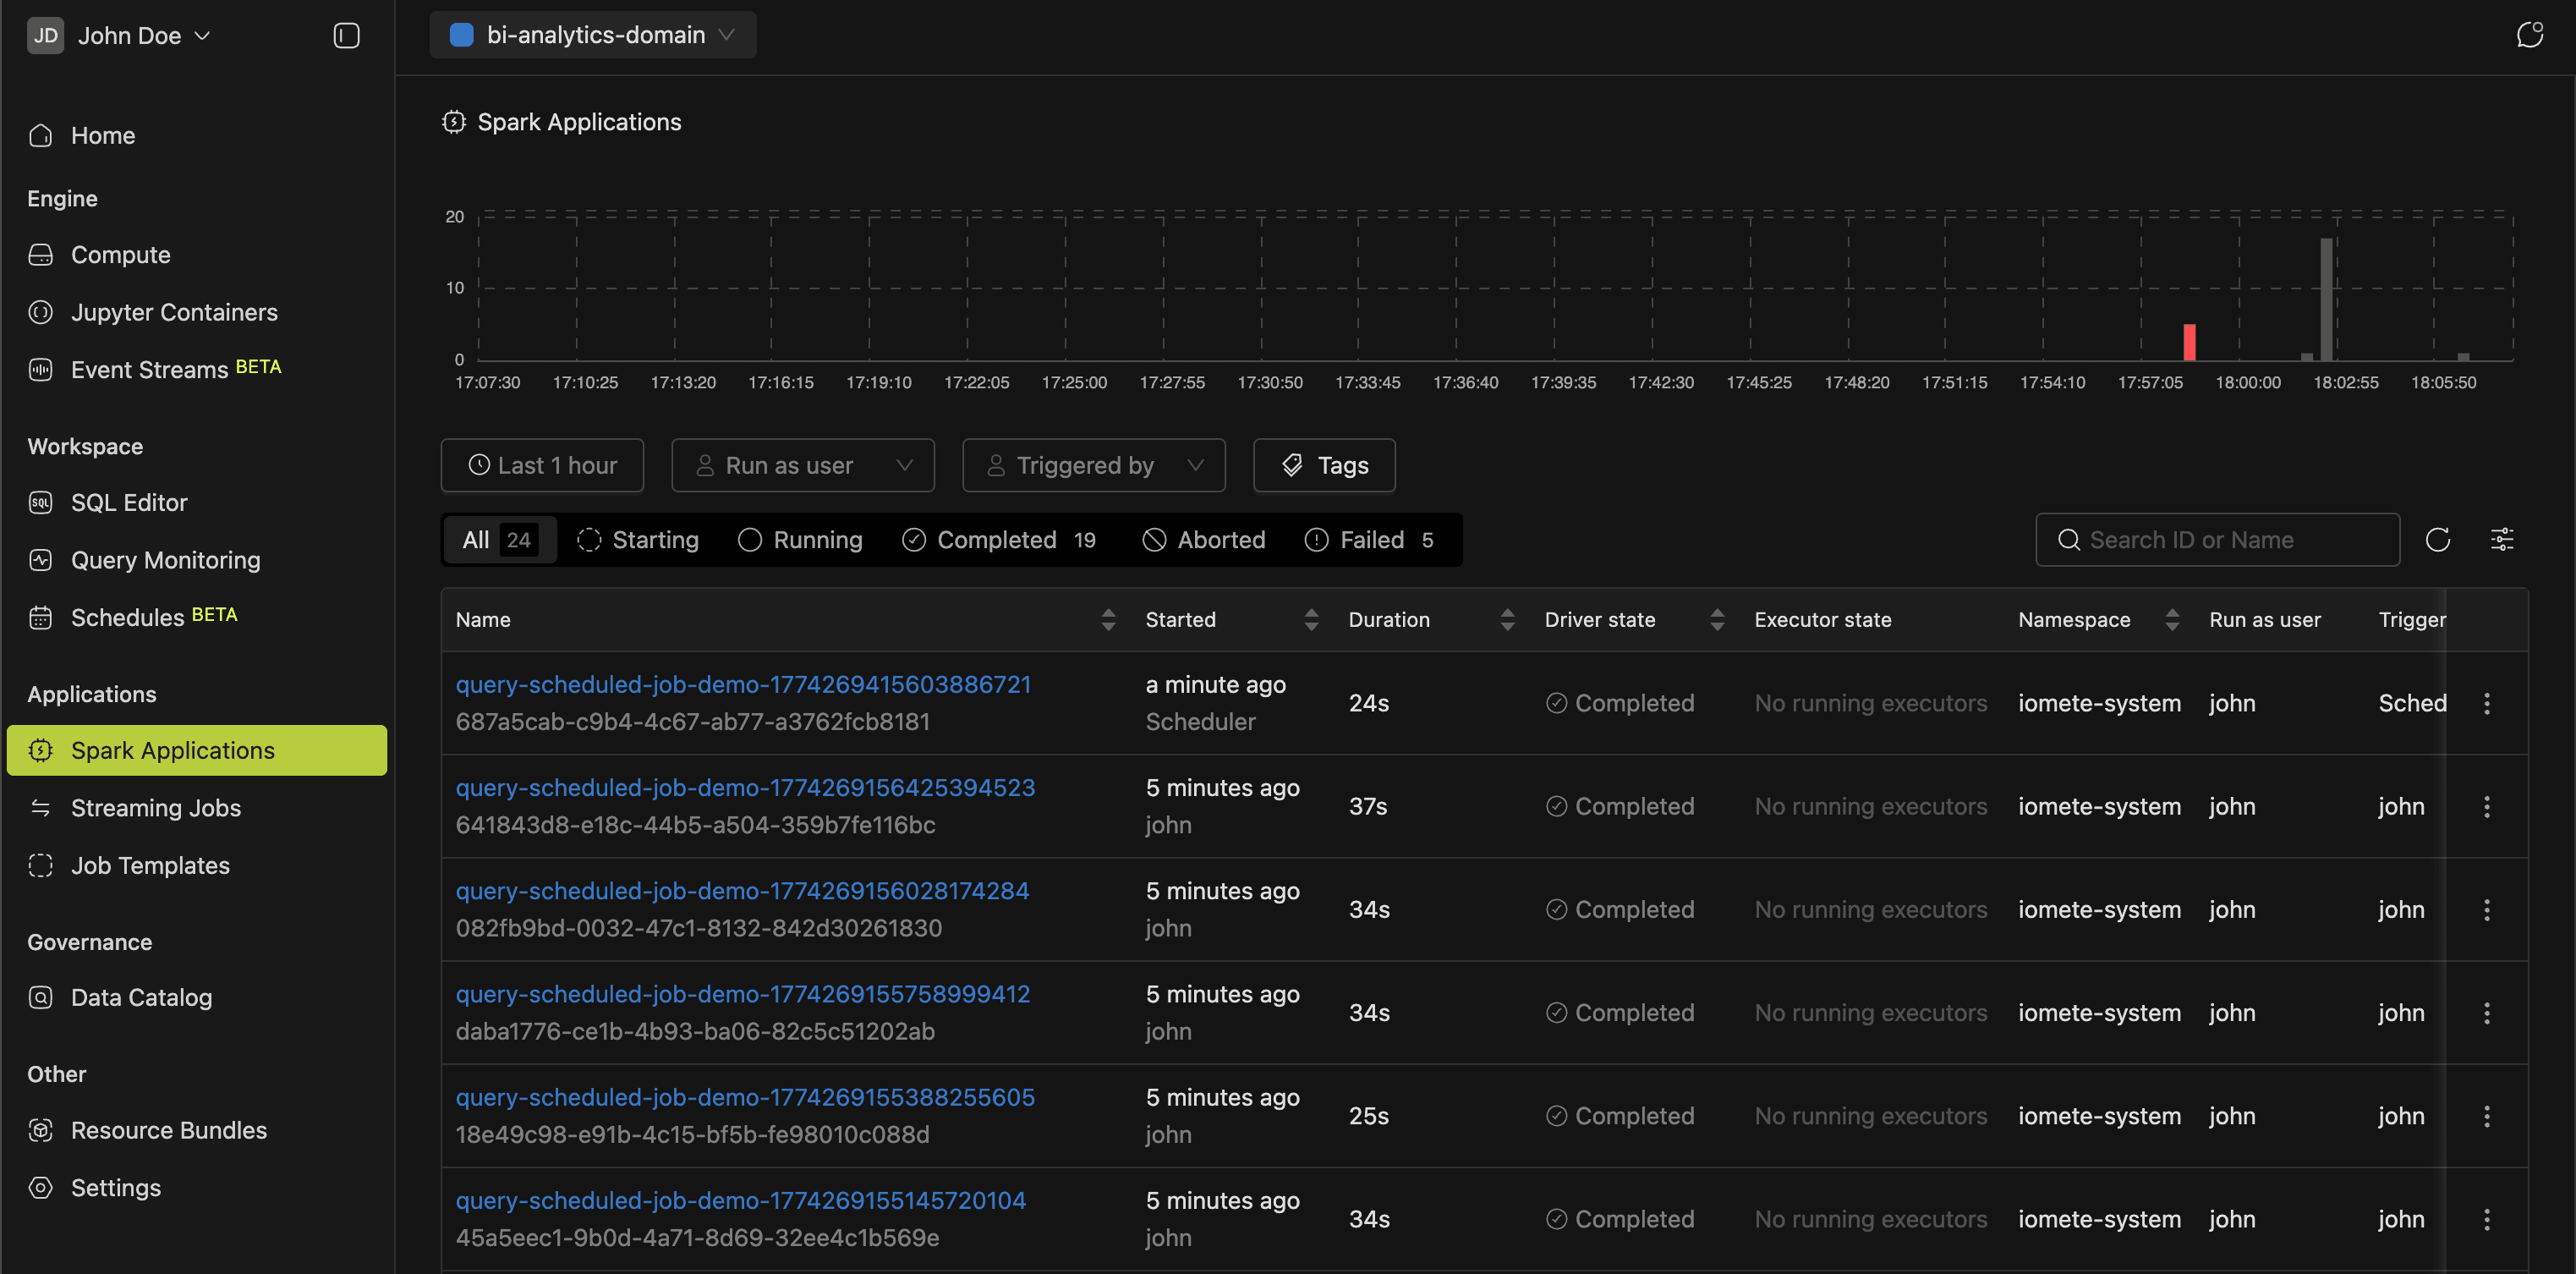
More in the Spark Jobs guide.
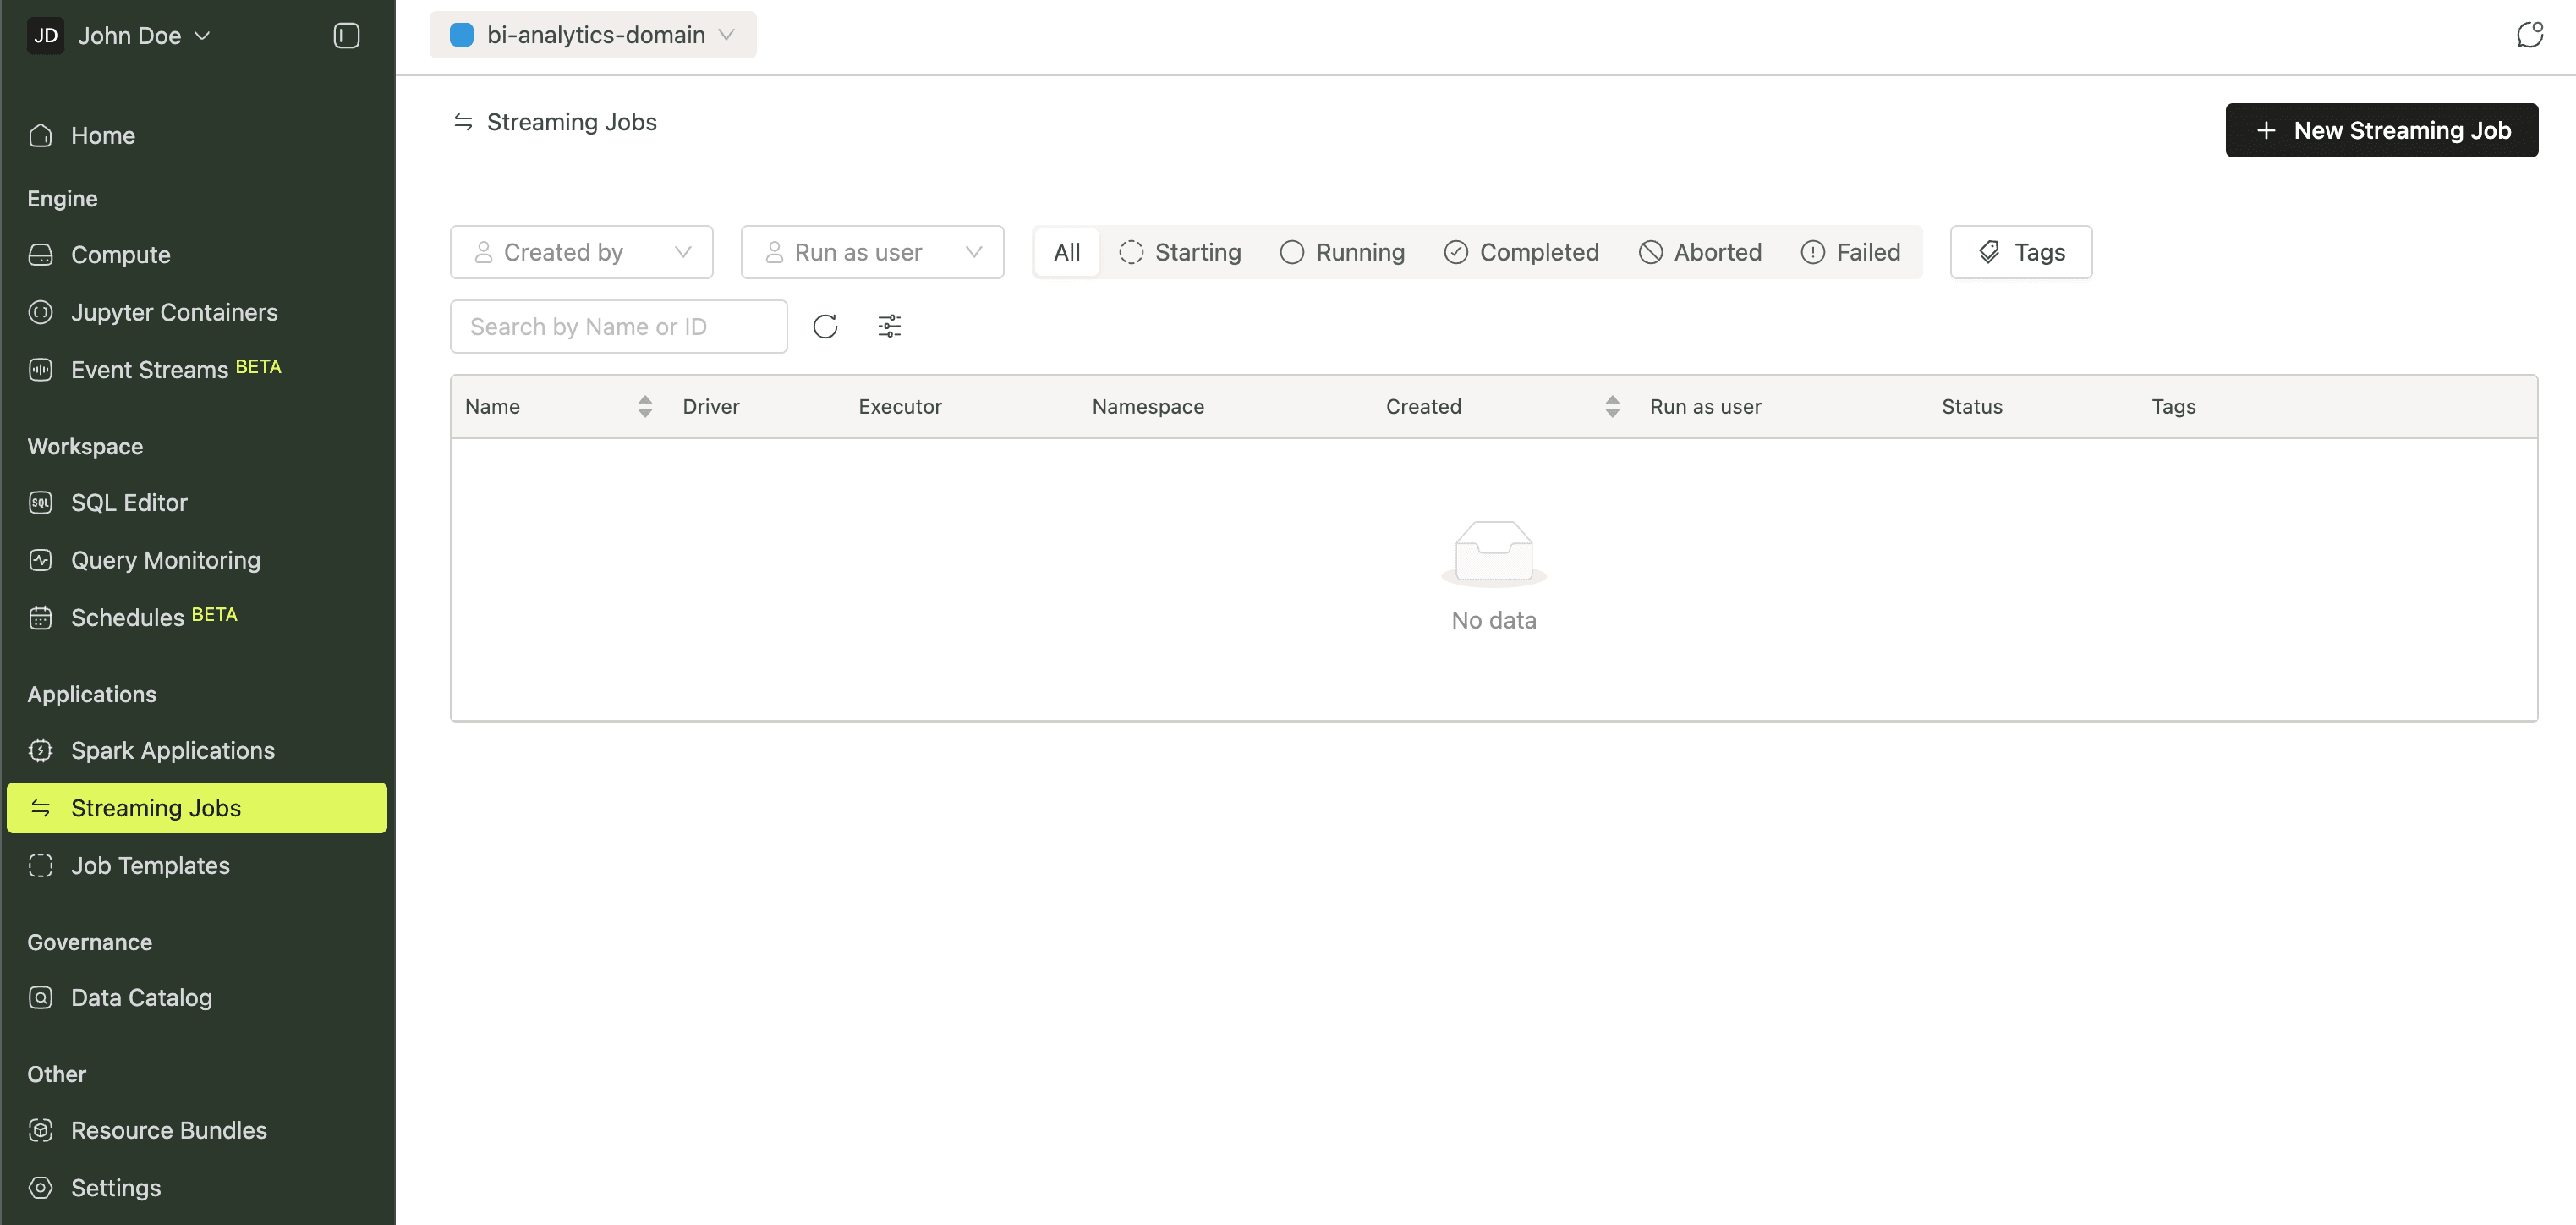
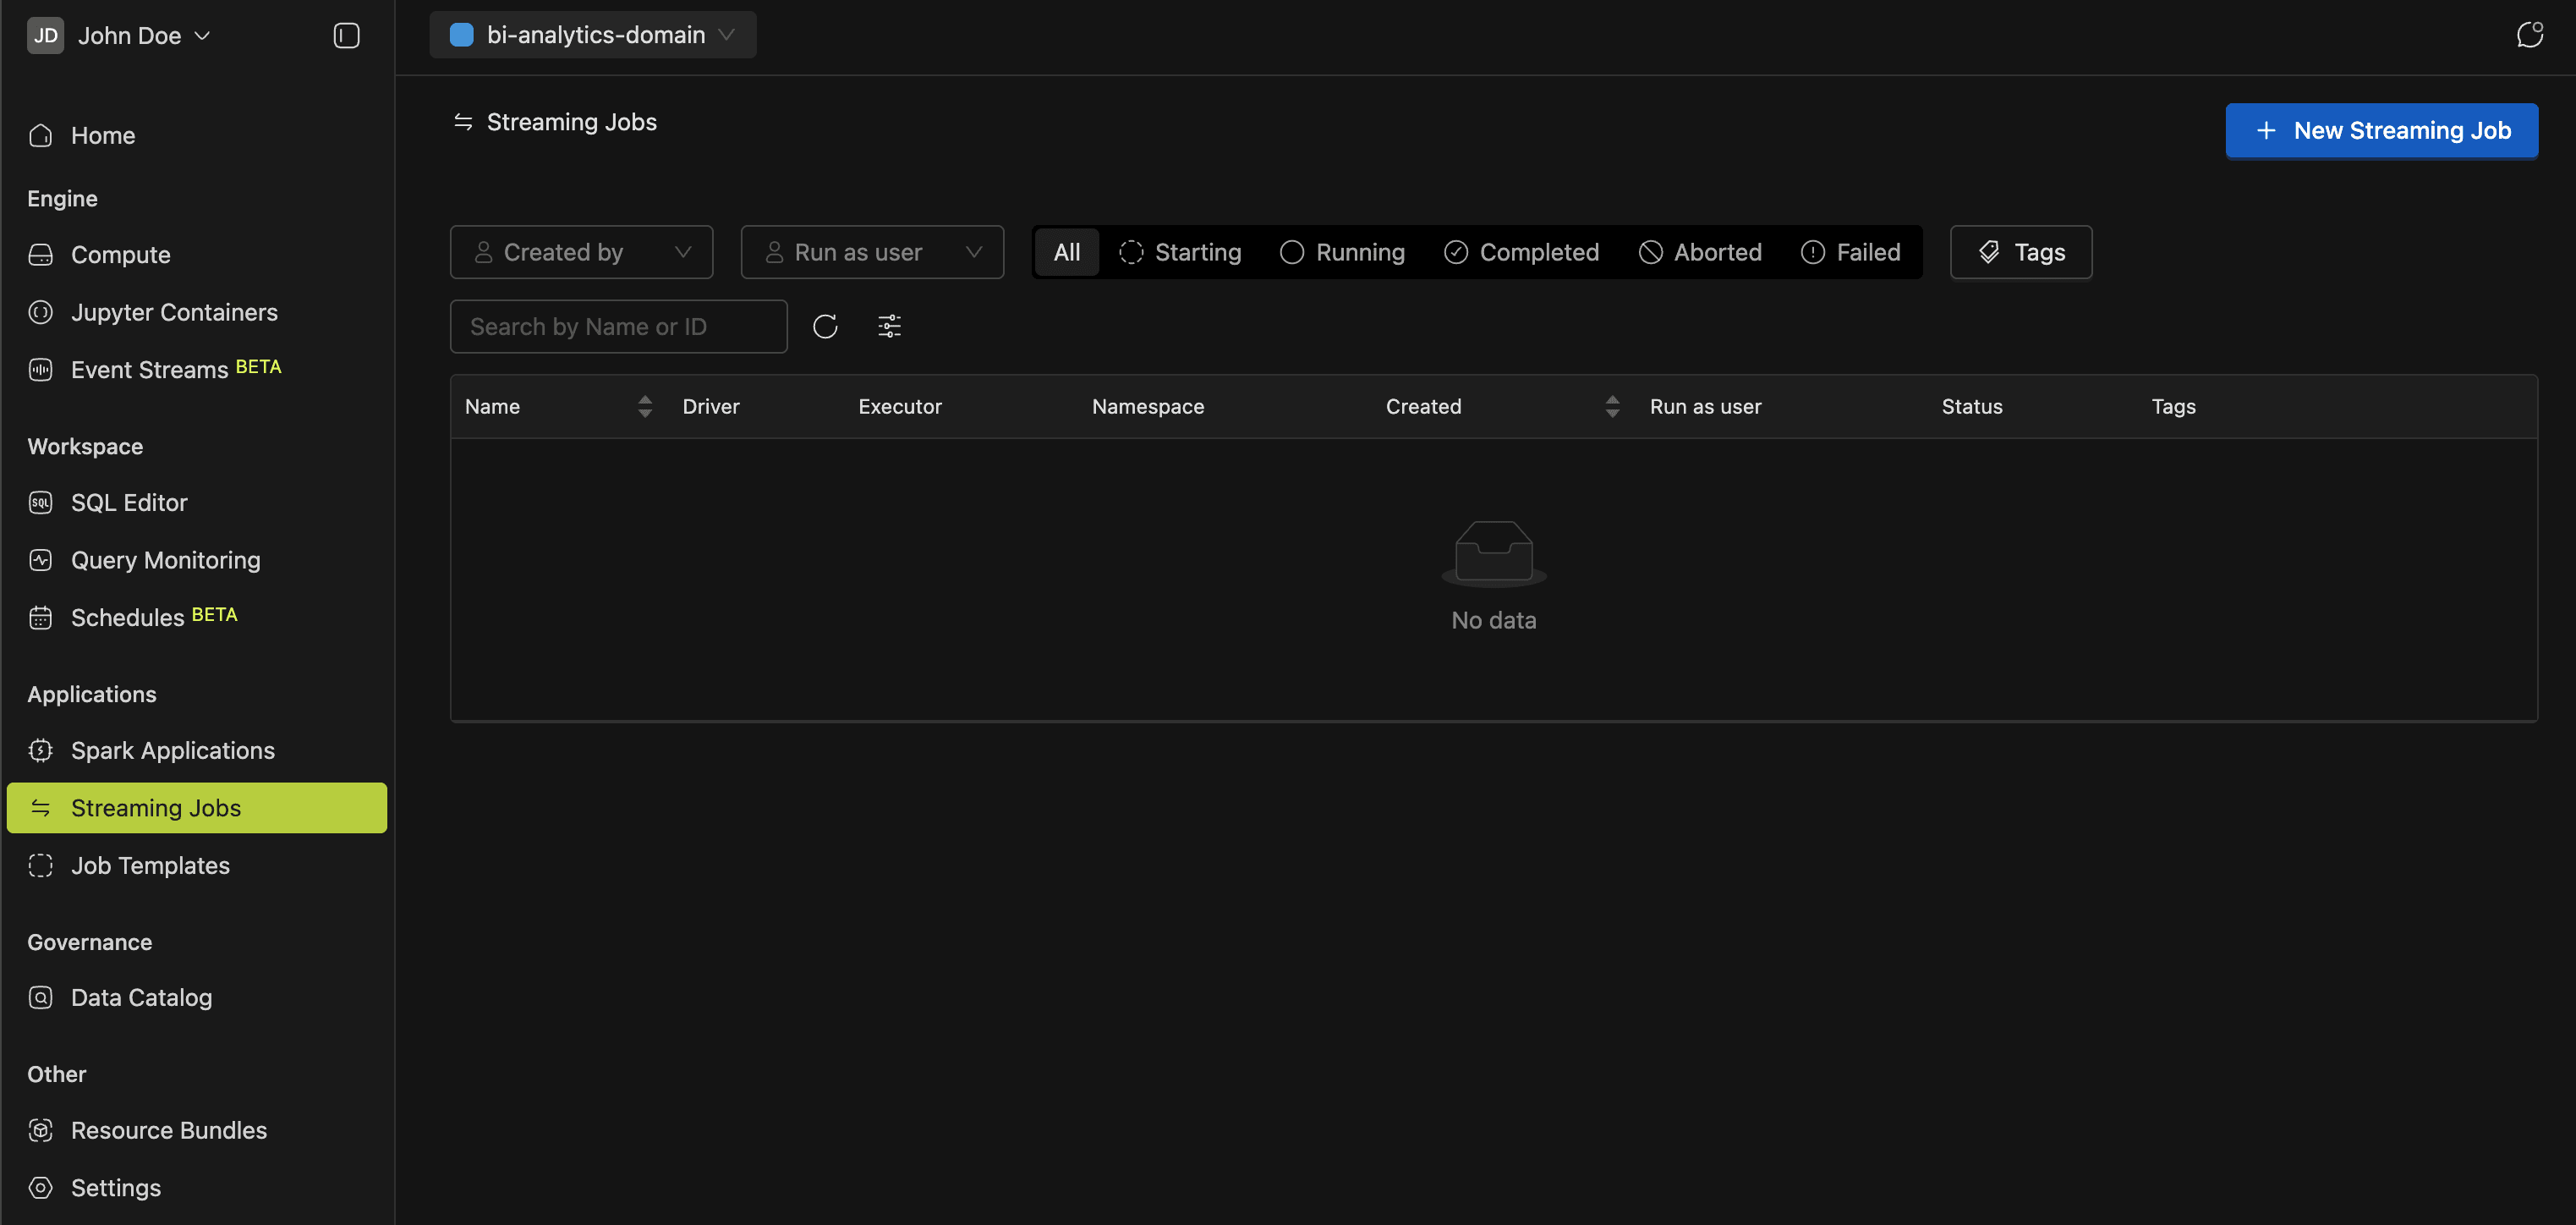
Streaming Jobs
Spark Structured Streaming workloads live here. Create, monitor, and scale long-running streaming jobs that process data continuously as it arrives.
Job Templates
Job Templates define reusable Spark job configurations. Browse the built-in marketplace for ready to use templates, or create your own.
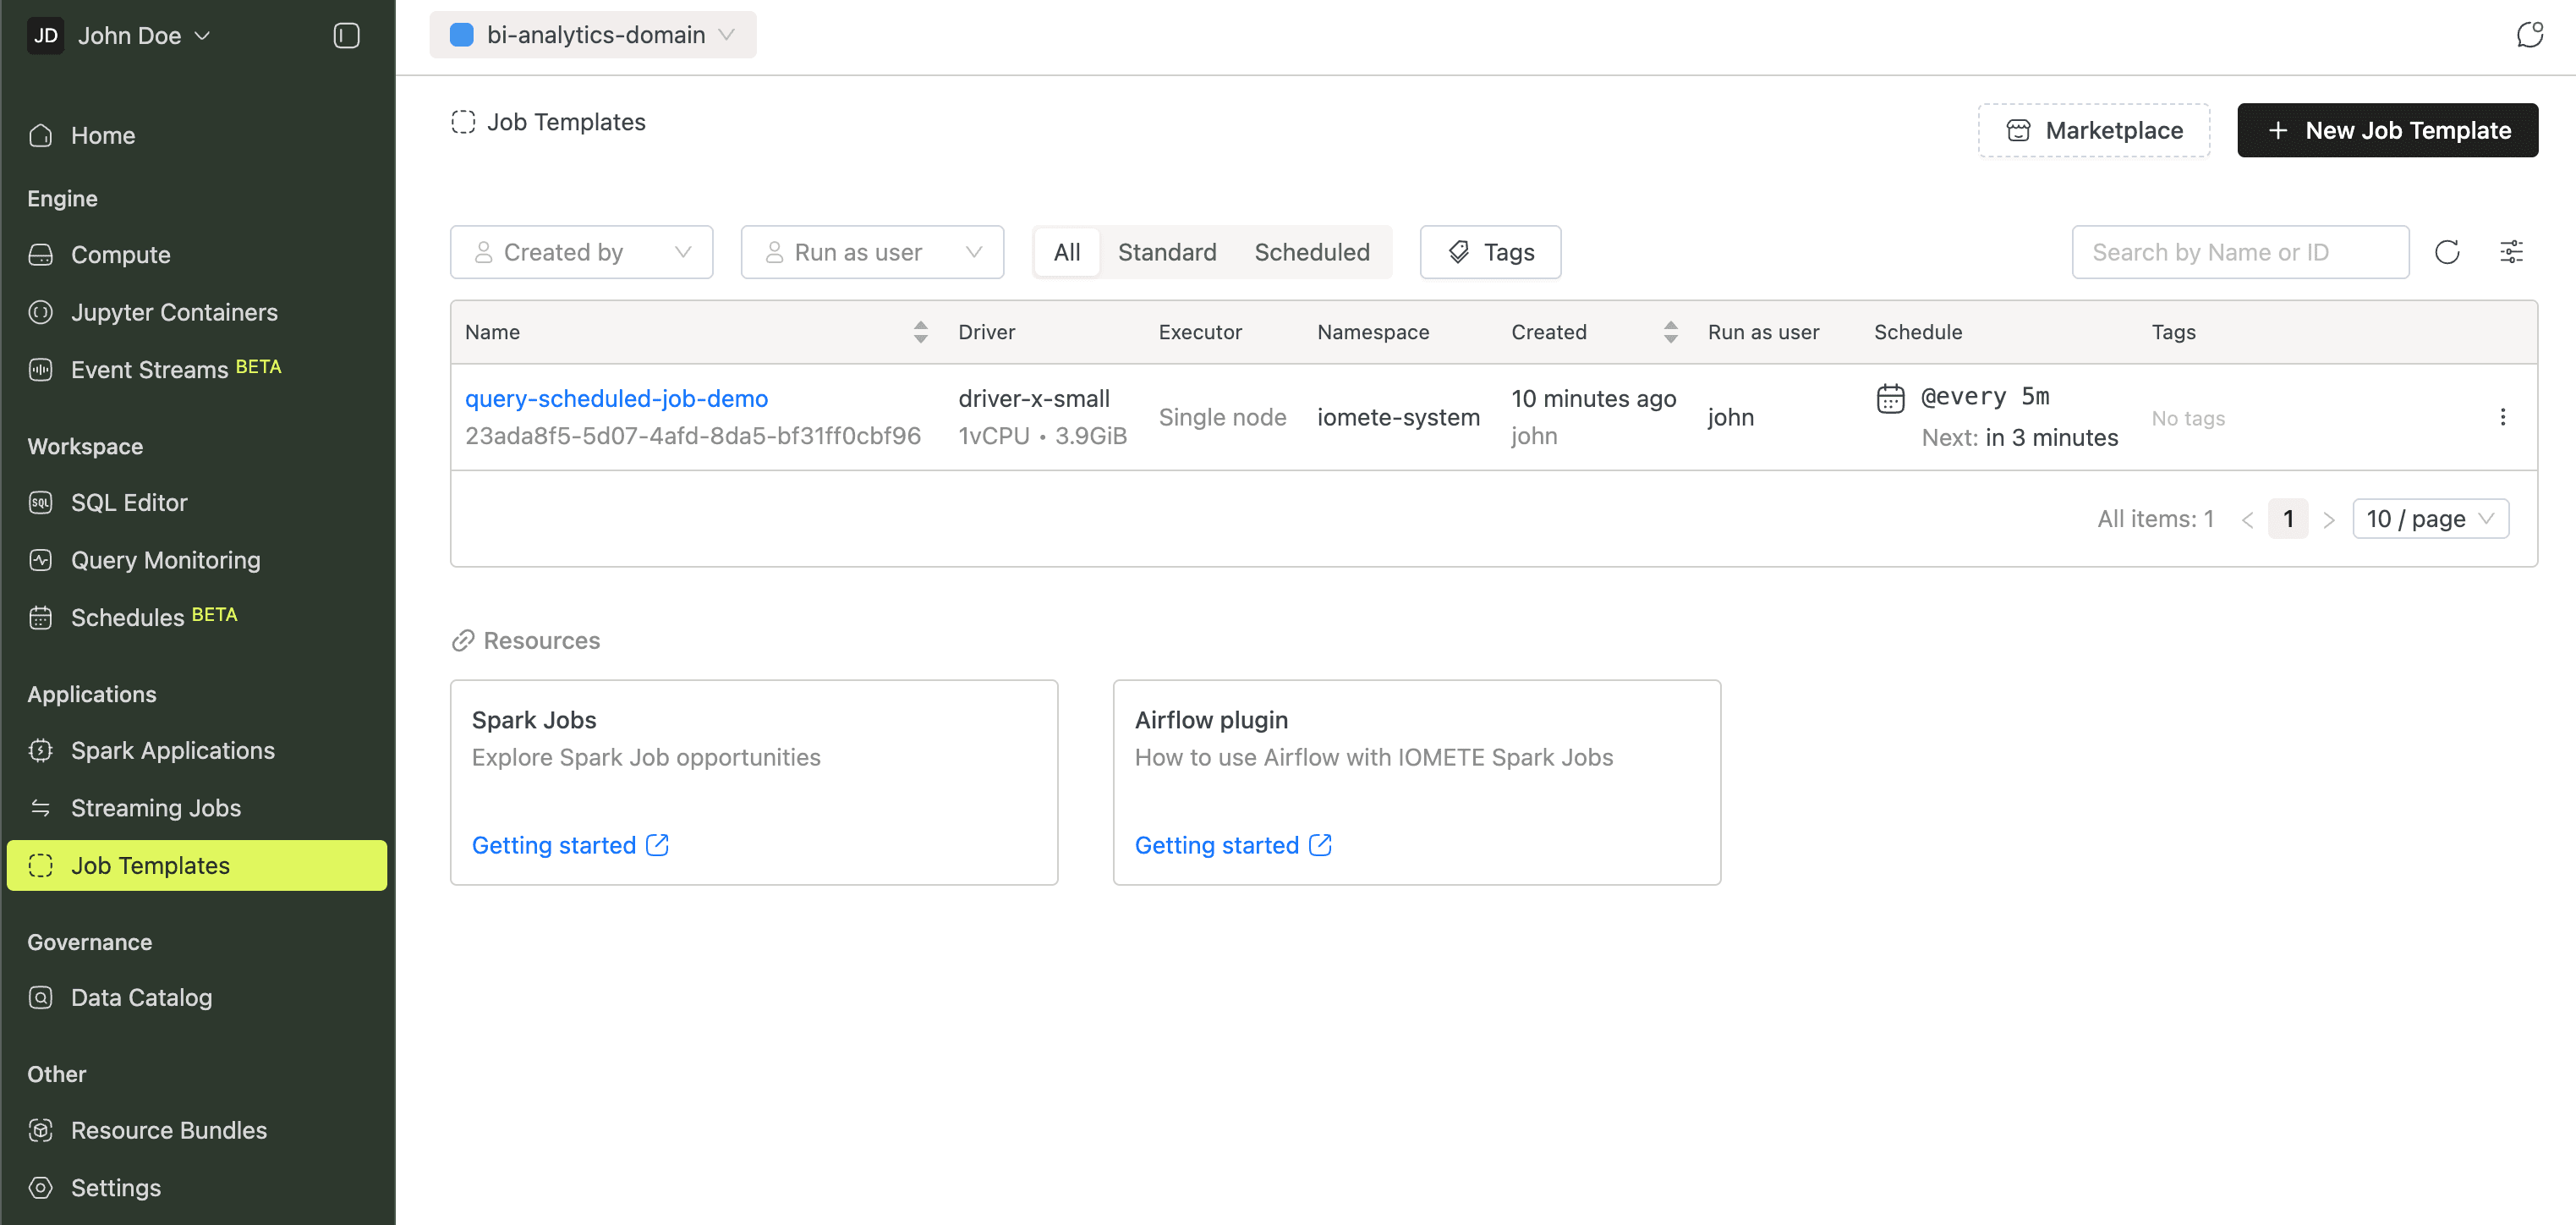
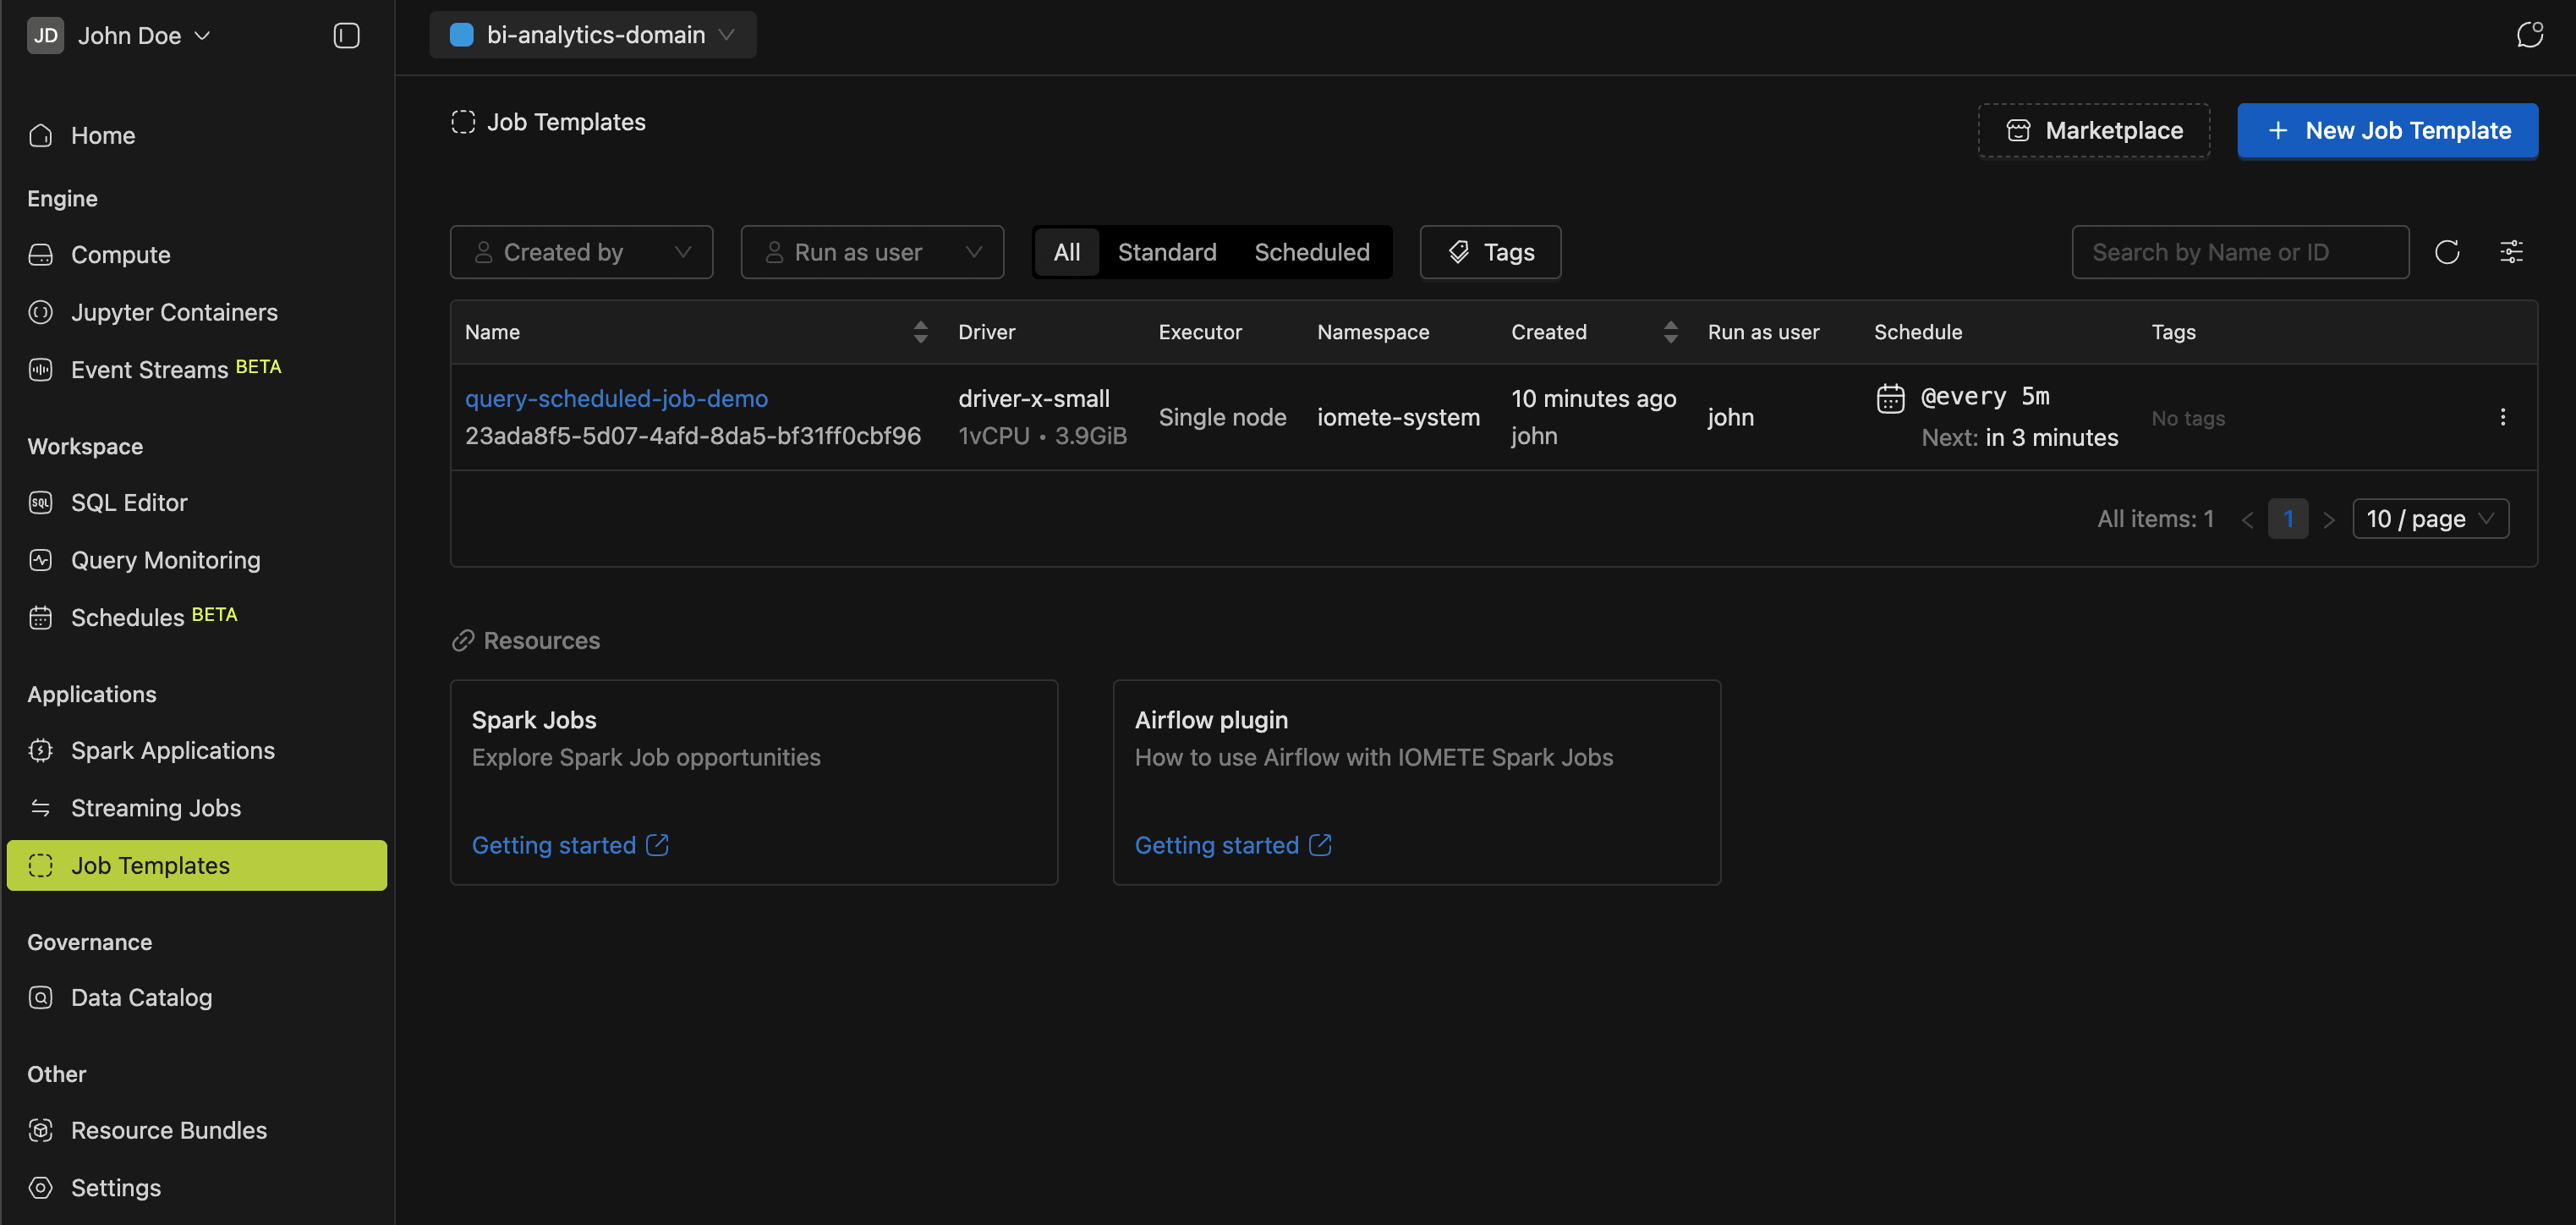
The Getting Started with Spark Jobs guide has a full walkthrough.
Governance
As your data grows, finding and understanding tables gets harder. The Governance section currently has one page, Data Catalog, which organizes table metadata across five tabs:
- Data Catalog: full-text search across all tables, with filters for catalogs, schemas, and tags.
- Data Explorer: hierarchical browsing through catalogs, namespaces, and tables, plus views of columns, partitions, and snapshots.
- Favorites: quick access to your bookmarked tables.
- Classifications: manage classification tags applied to data assets.
- Classification Requests: review and approve requests to add or modify classifications.
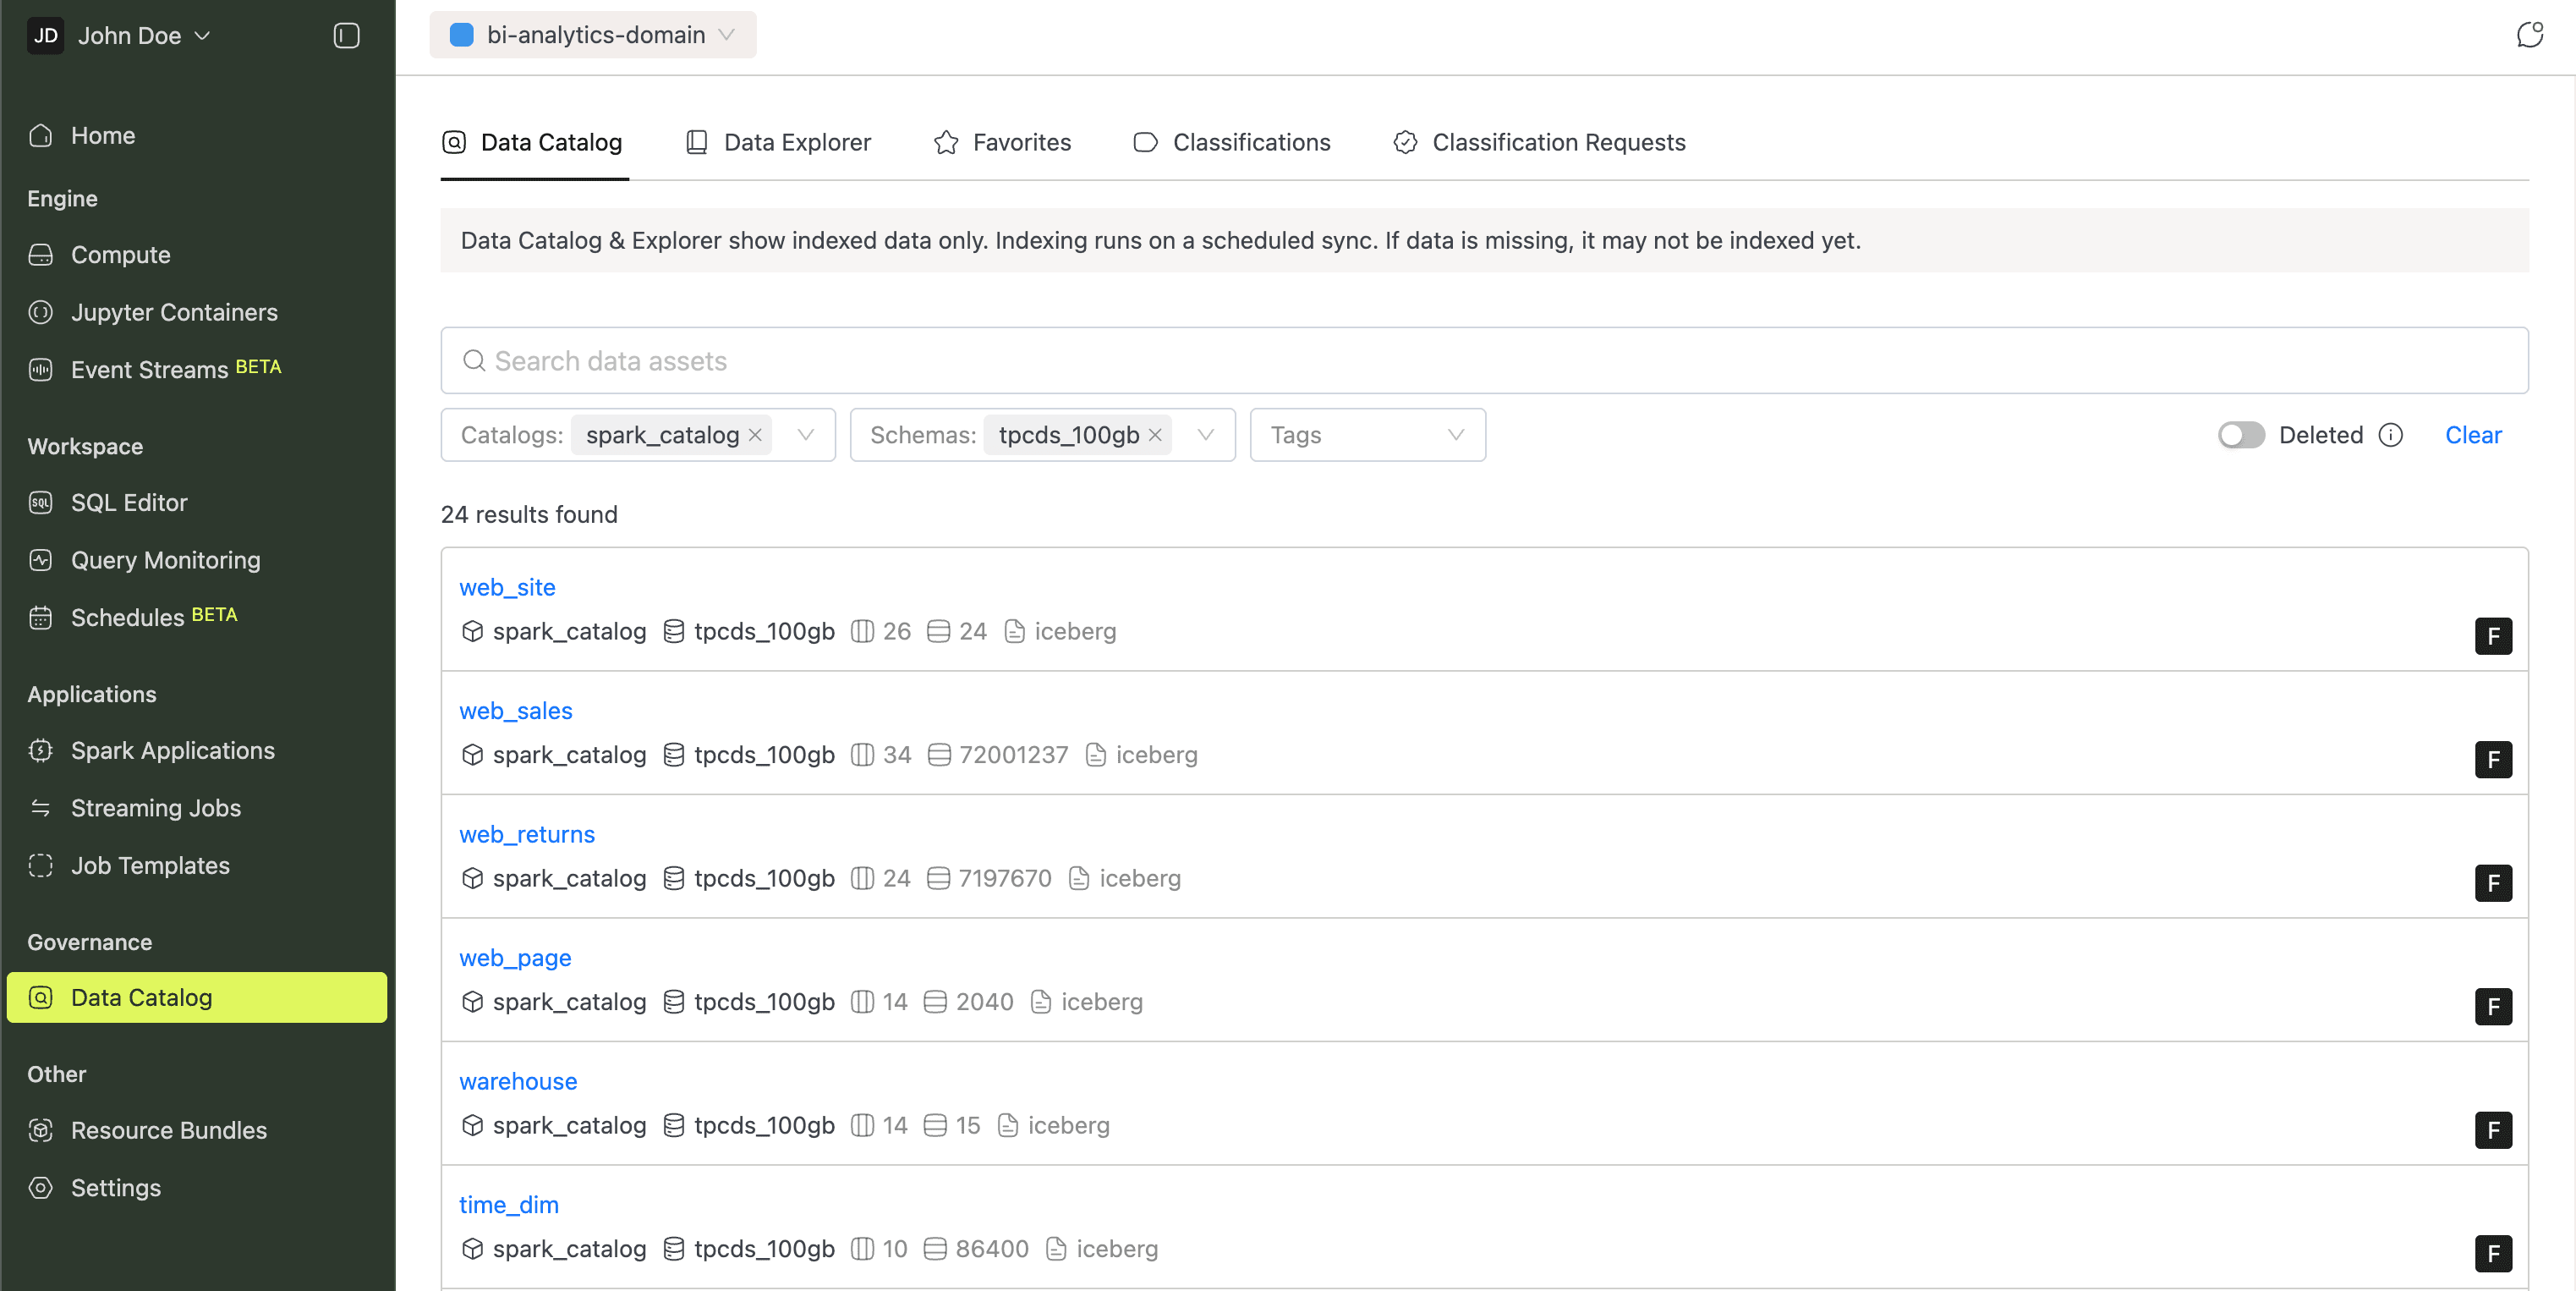
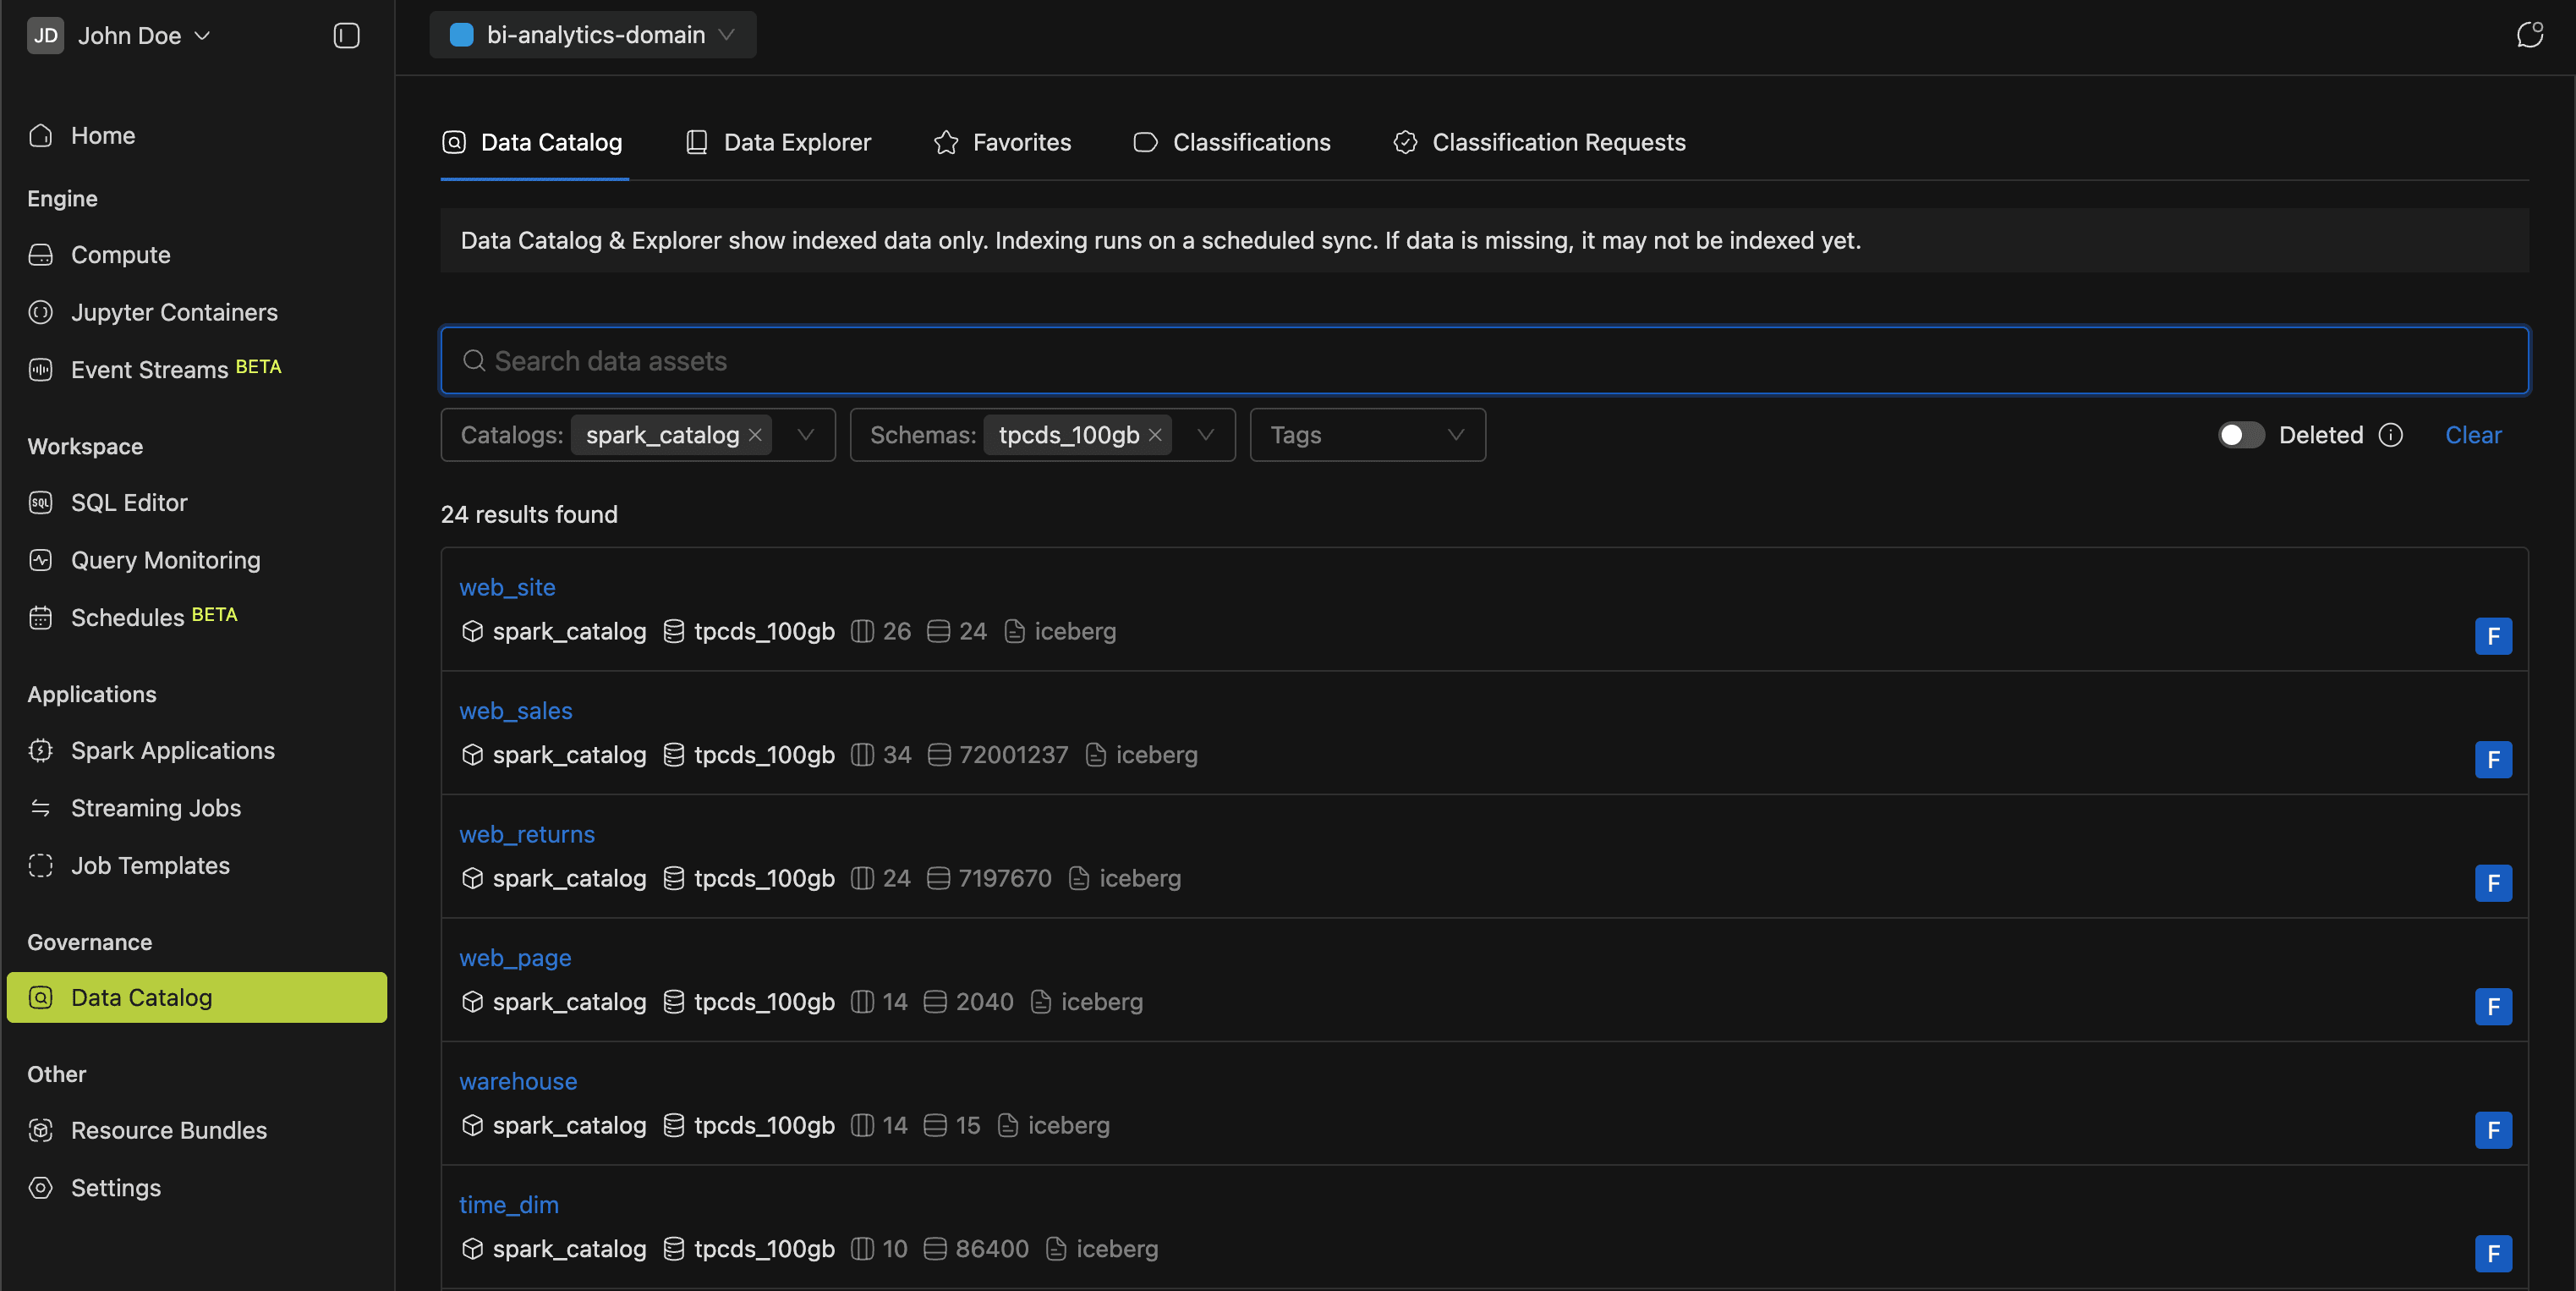
The Data Catalog guide covers everything in detail.
Resource Bundles
When different teams share the same platform, you need fine-grained access control. Resource Bundles group resources (compute clusters, Spark jobs, Jupyter Containers, etc.) and assign permissions per bundle. That way, you control who can create, manage, or use each resource.
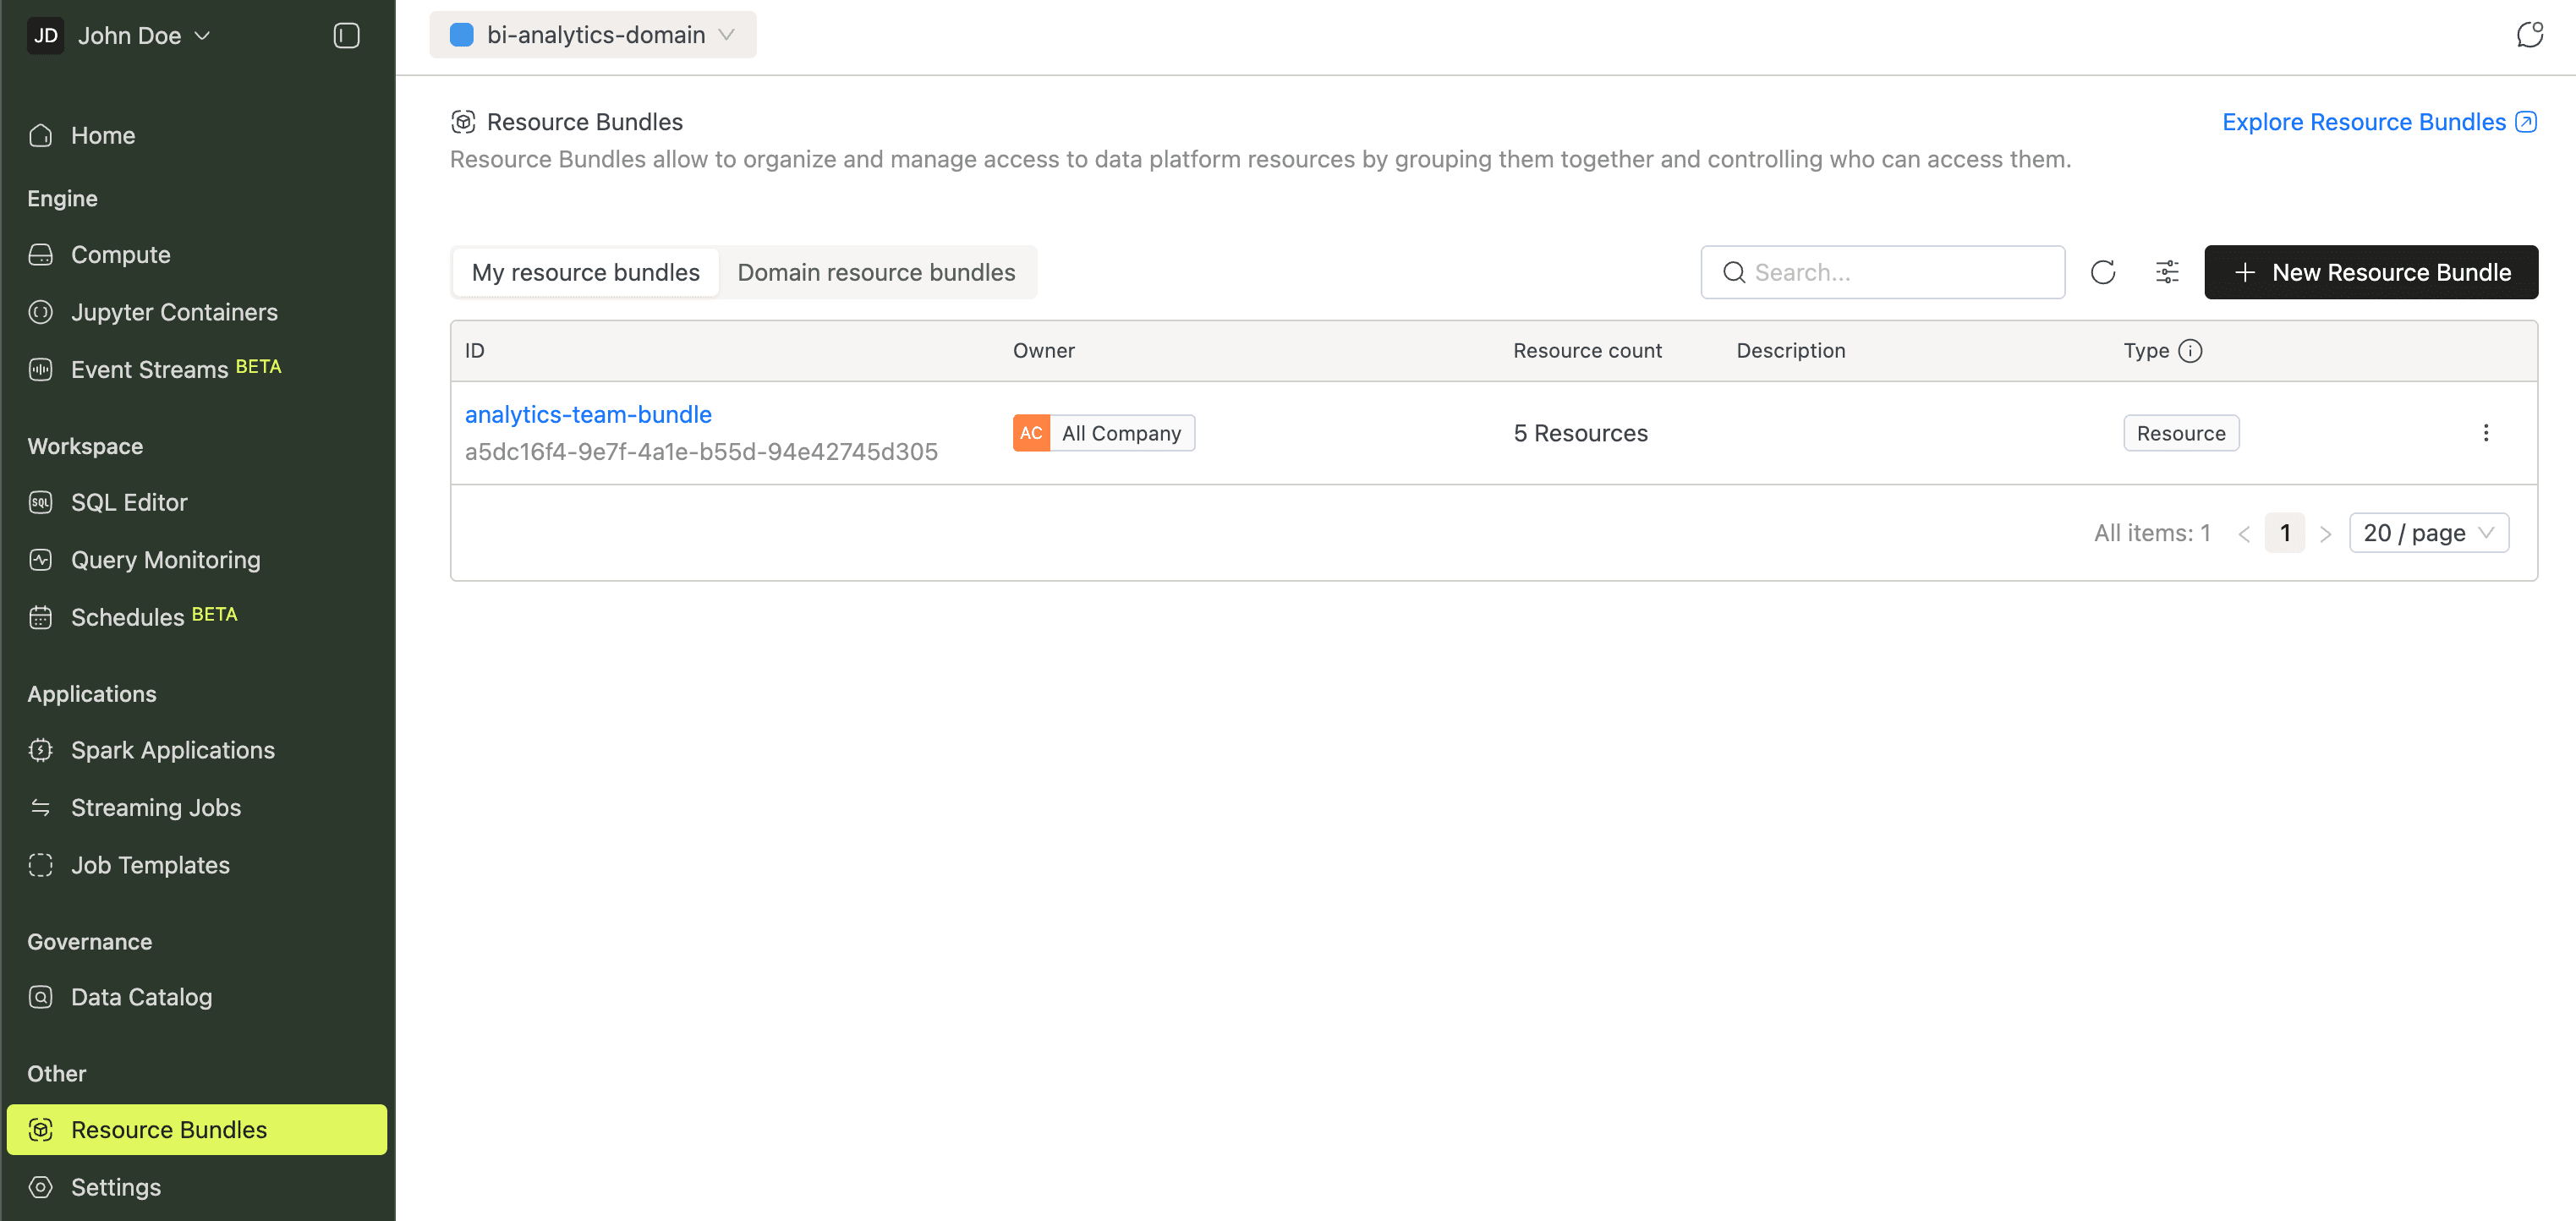
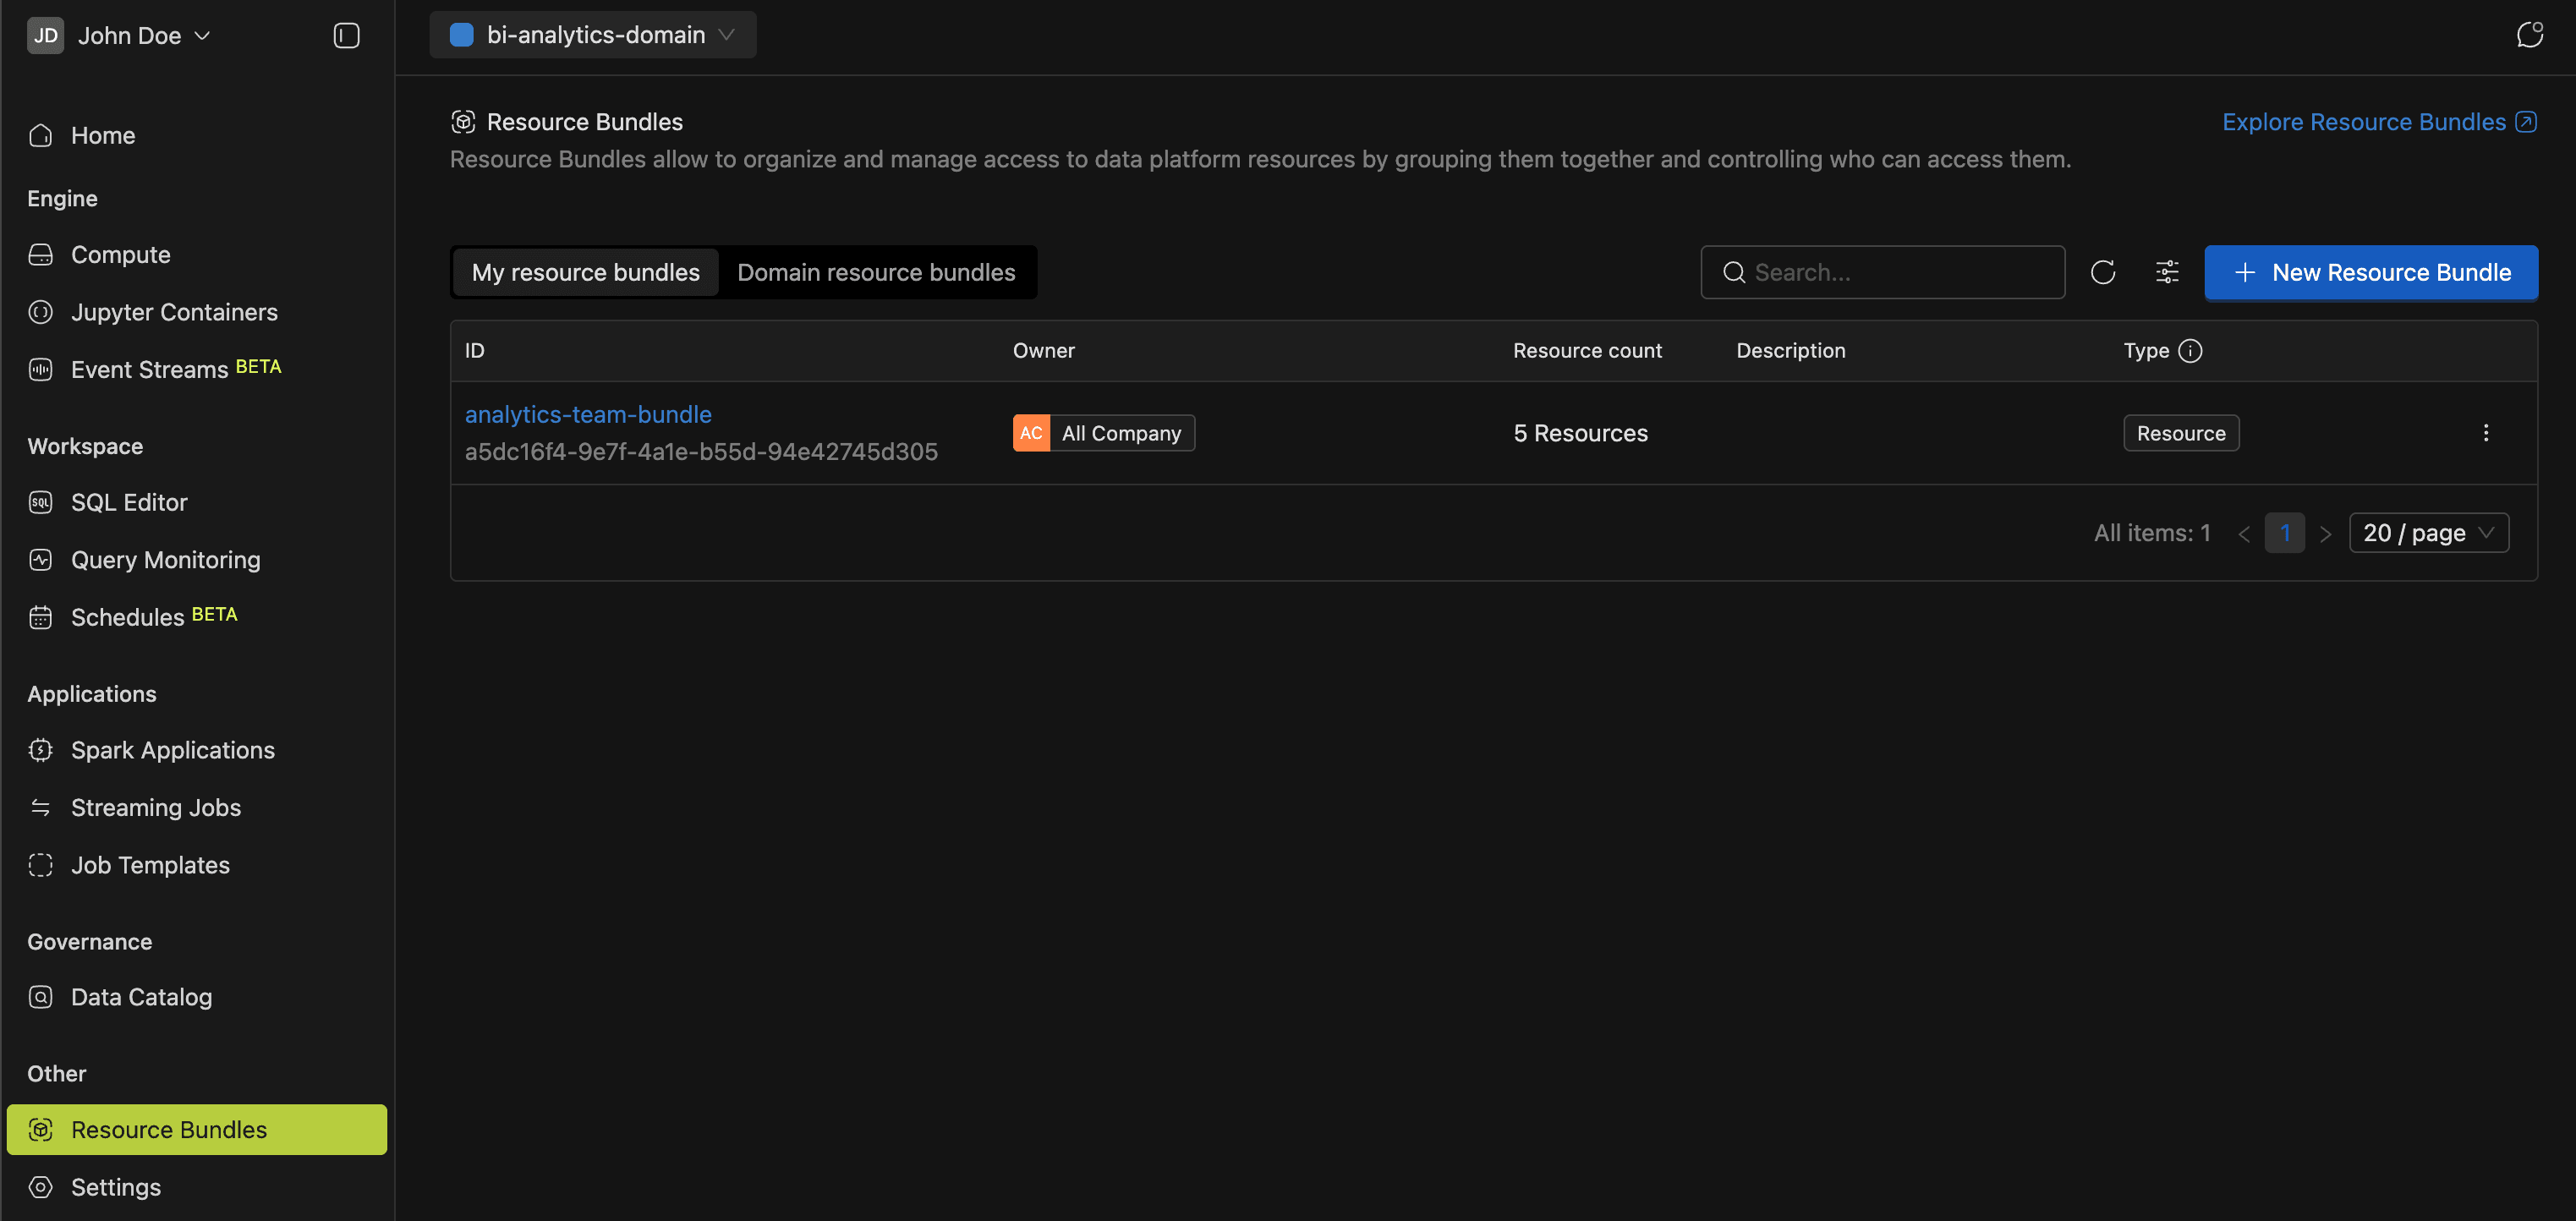
More in the Resource Bundles guide.
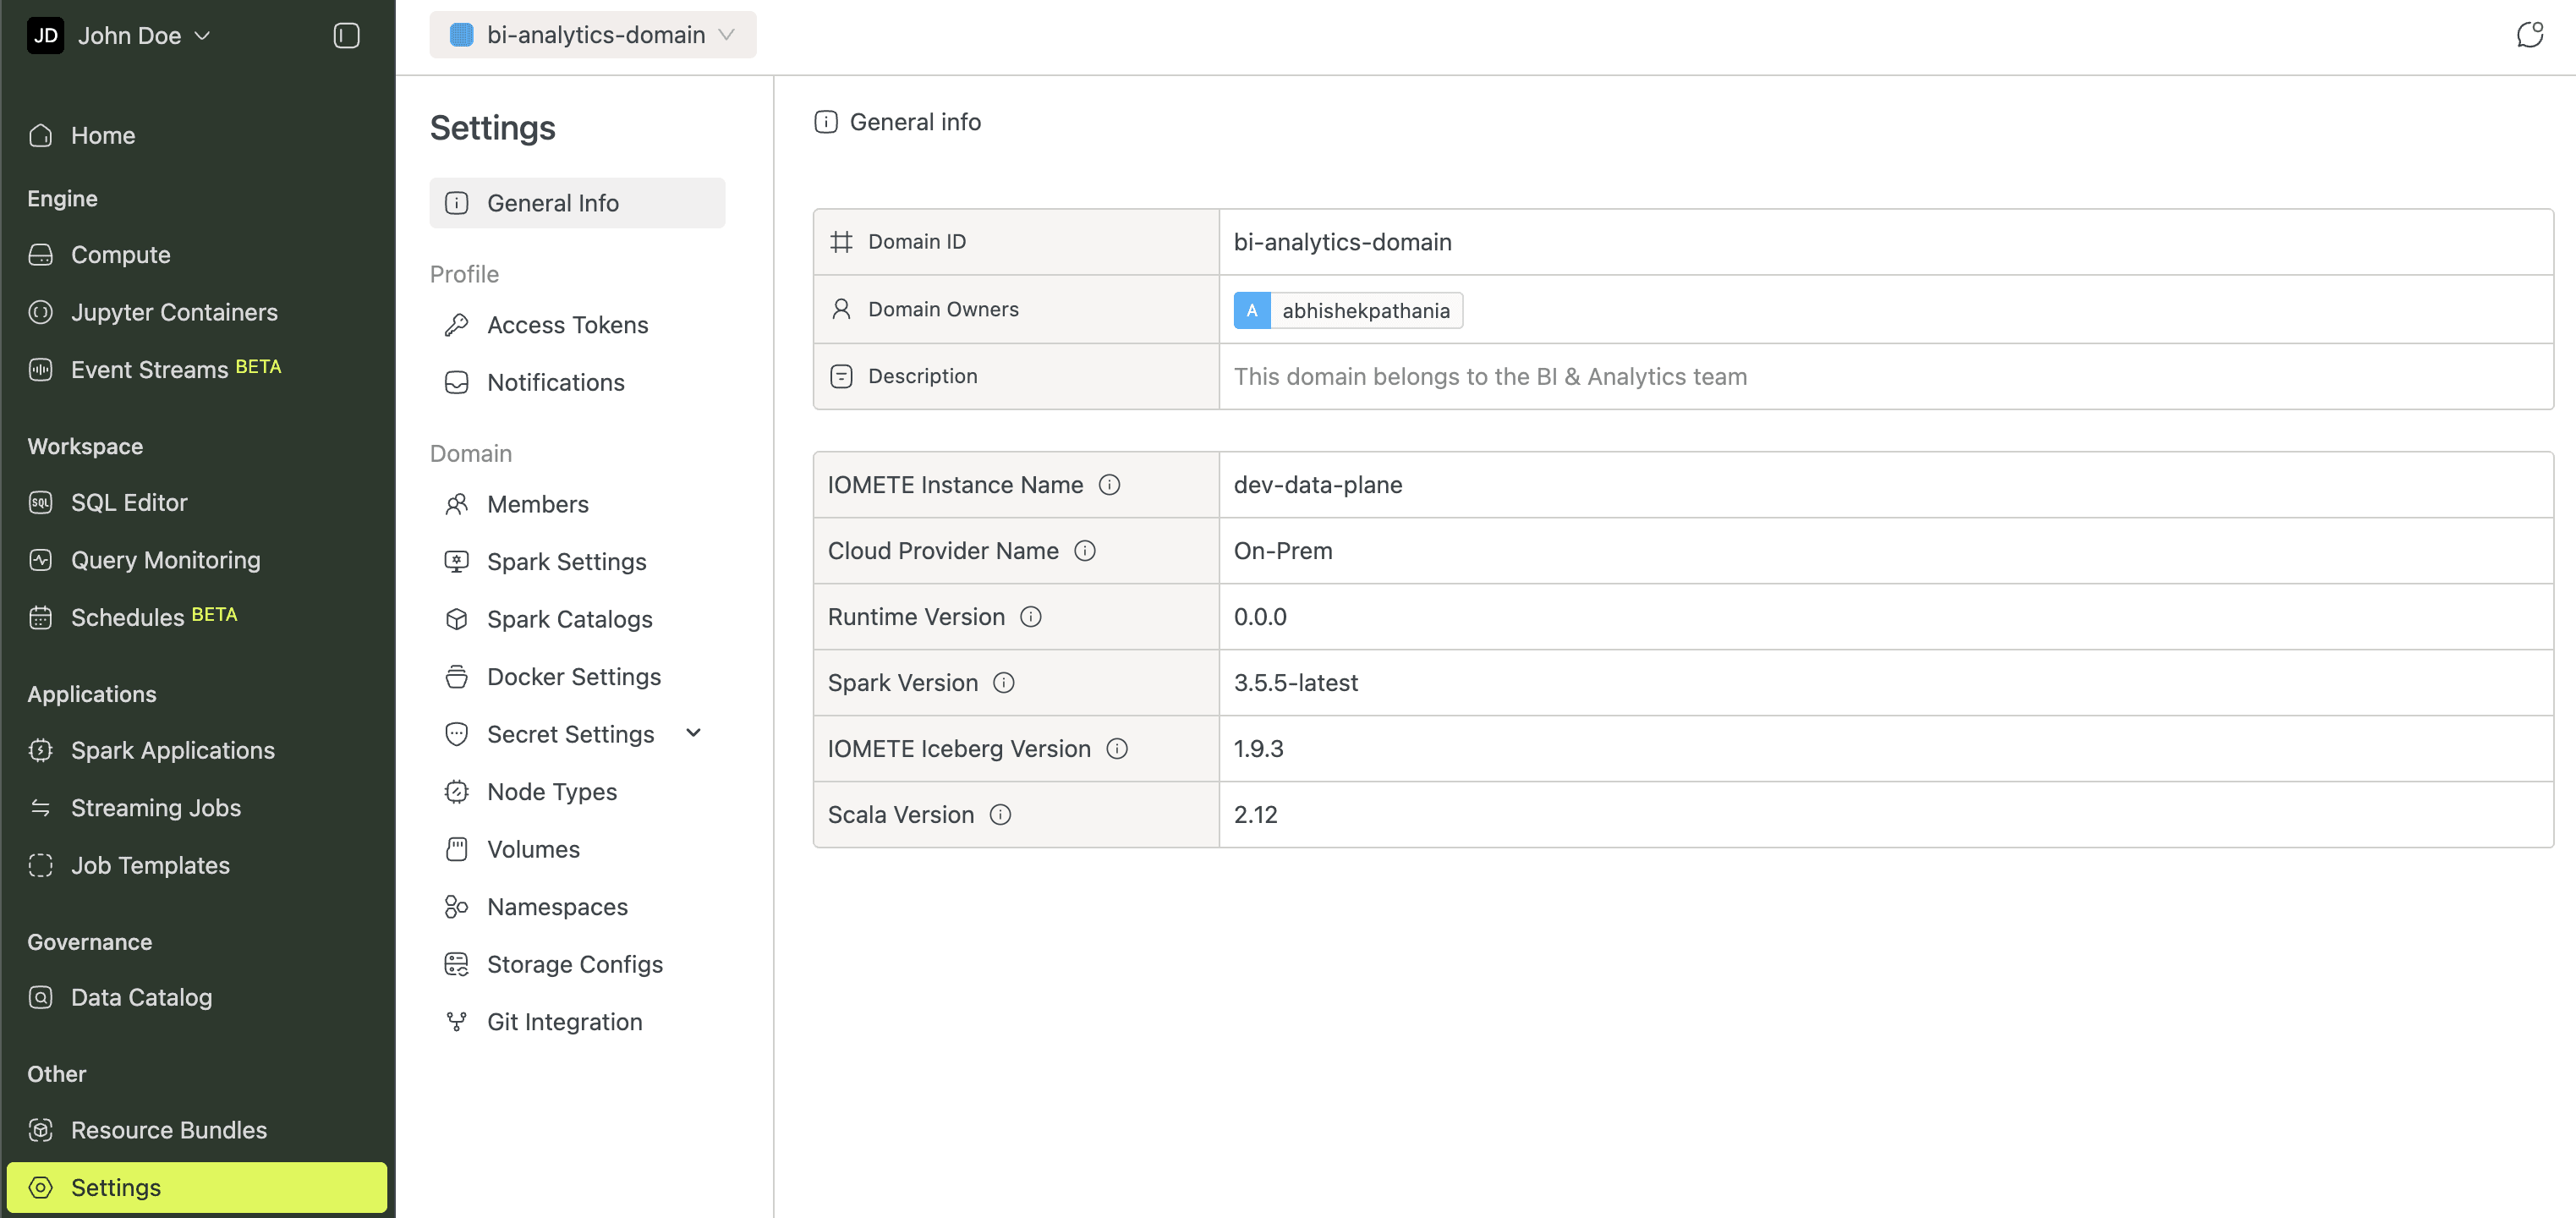
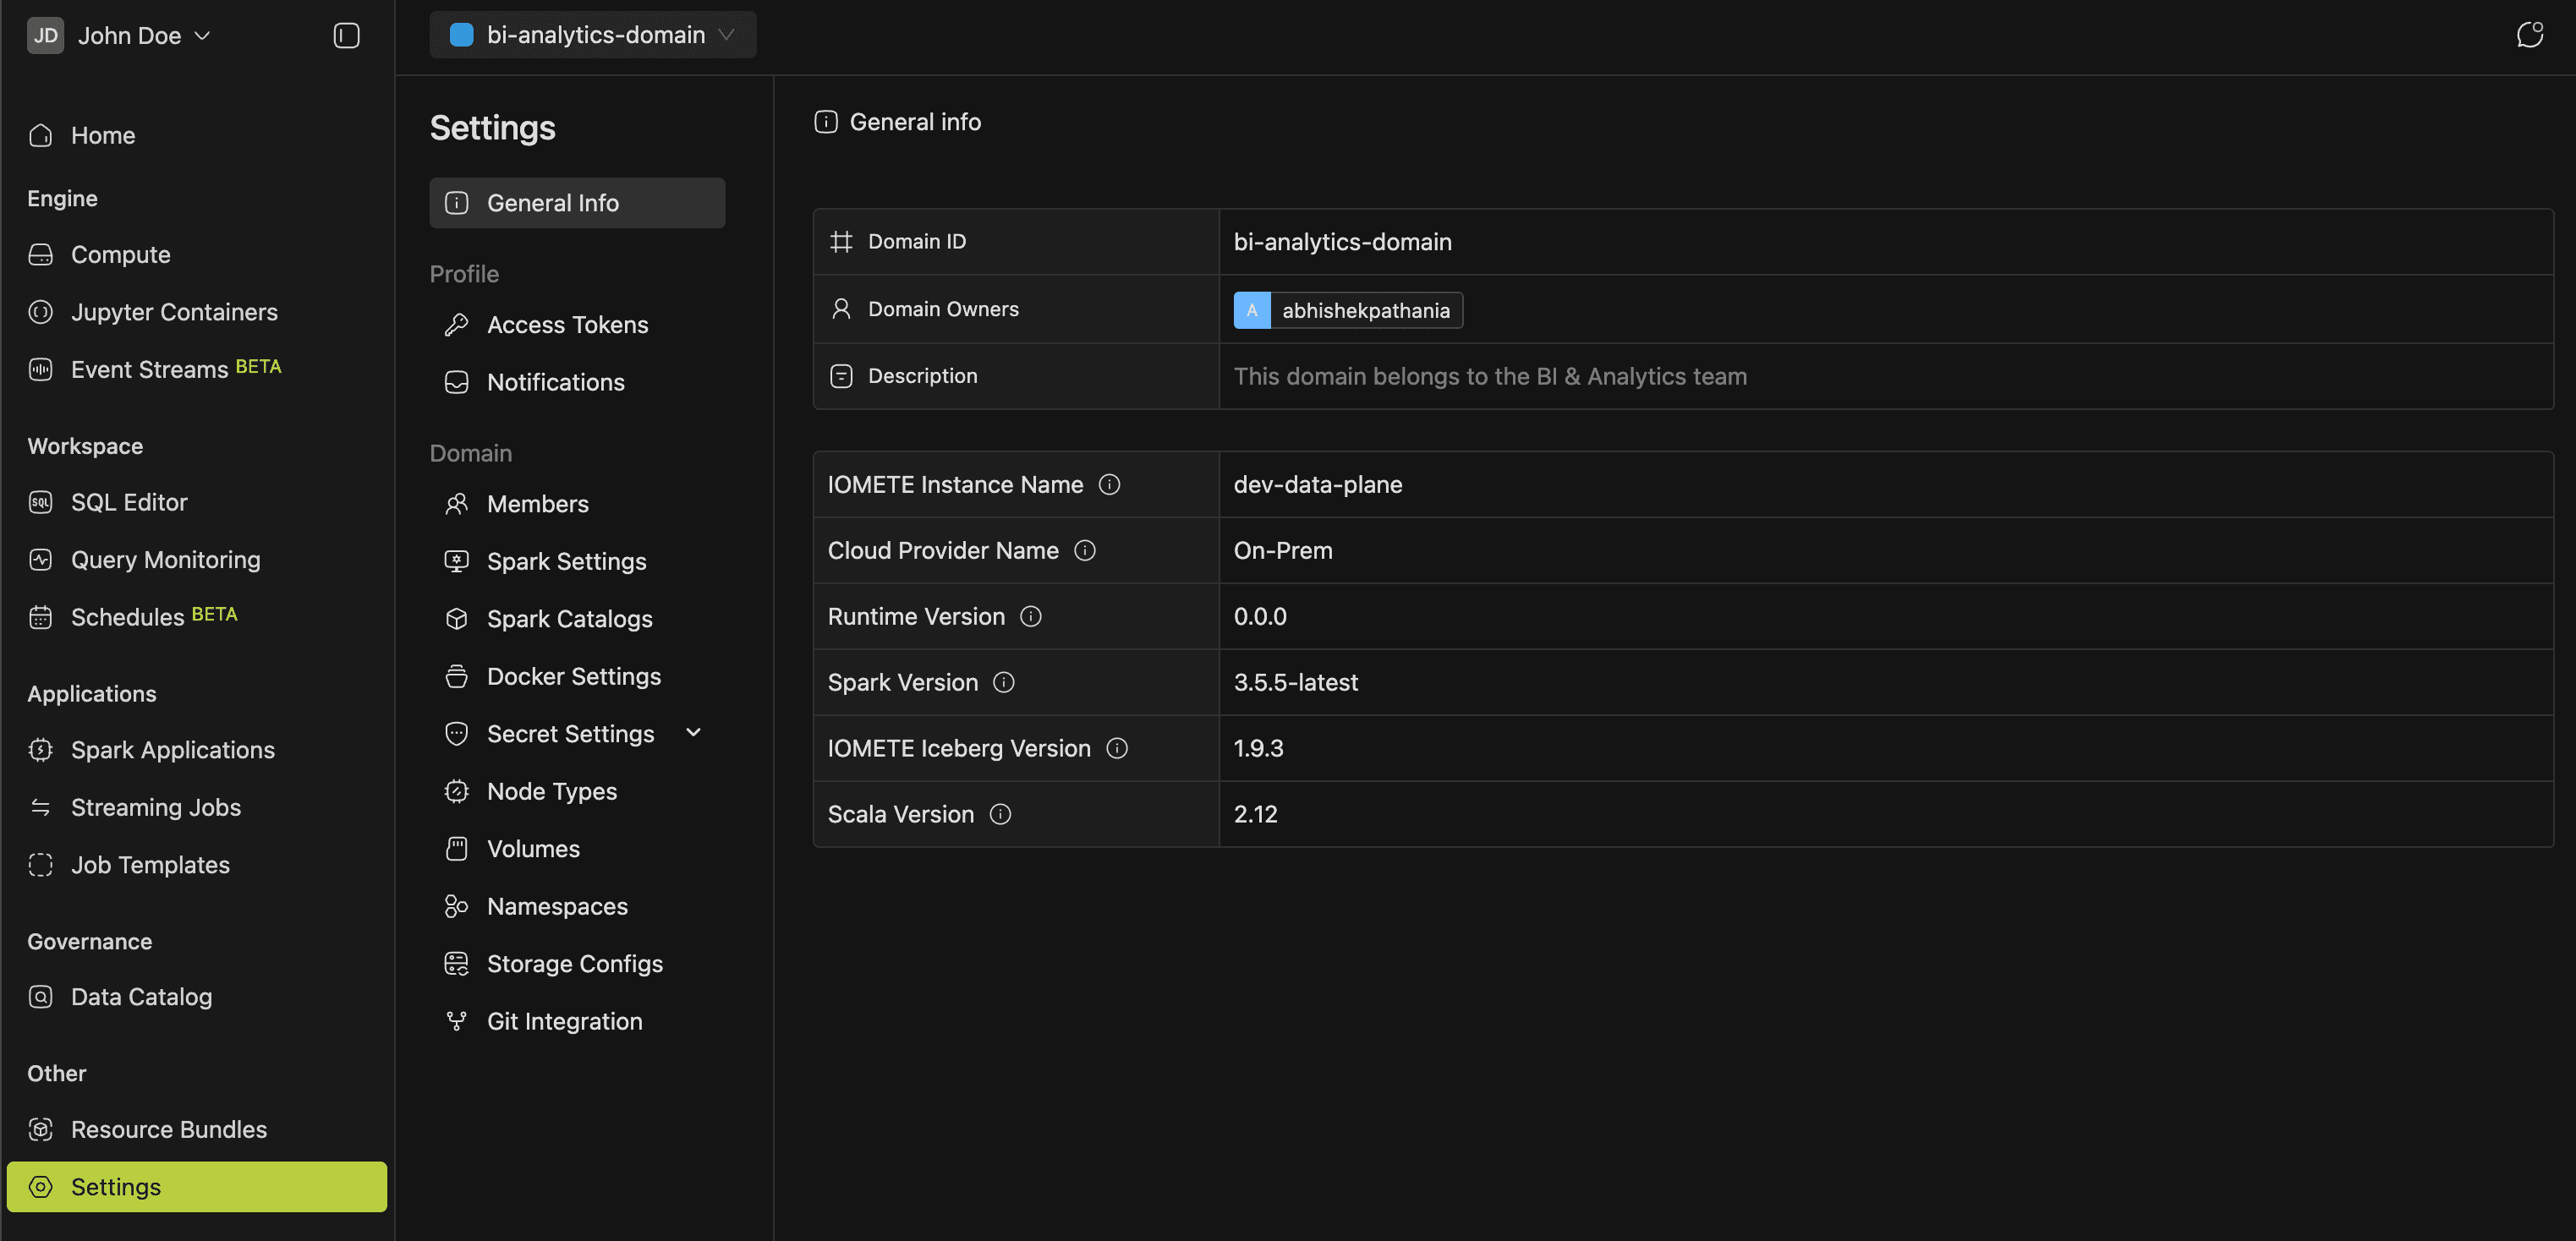
Settings
Platform-wide configuration lives in Settings, organized into three groups:
- General Info: domain details, cloud provider, runtime and Spark versions.
- Profile: Access Tokens and Notifications.
- Domain: Members, Spark Settings, Spark Catalogs, Docker Settings, Secret Settings, Node Types, Volumes, Namespaces, Storage Configs, and Git Integration.
Open Settings from the left sidebar or the user menu.
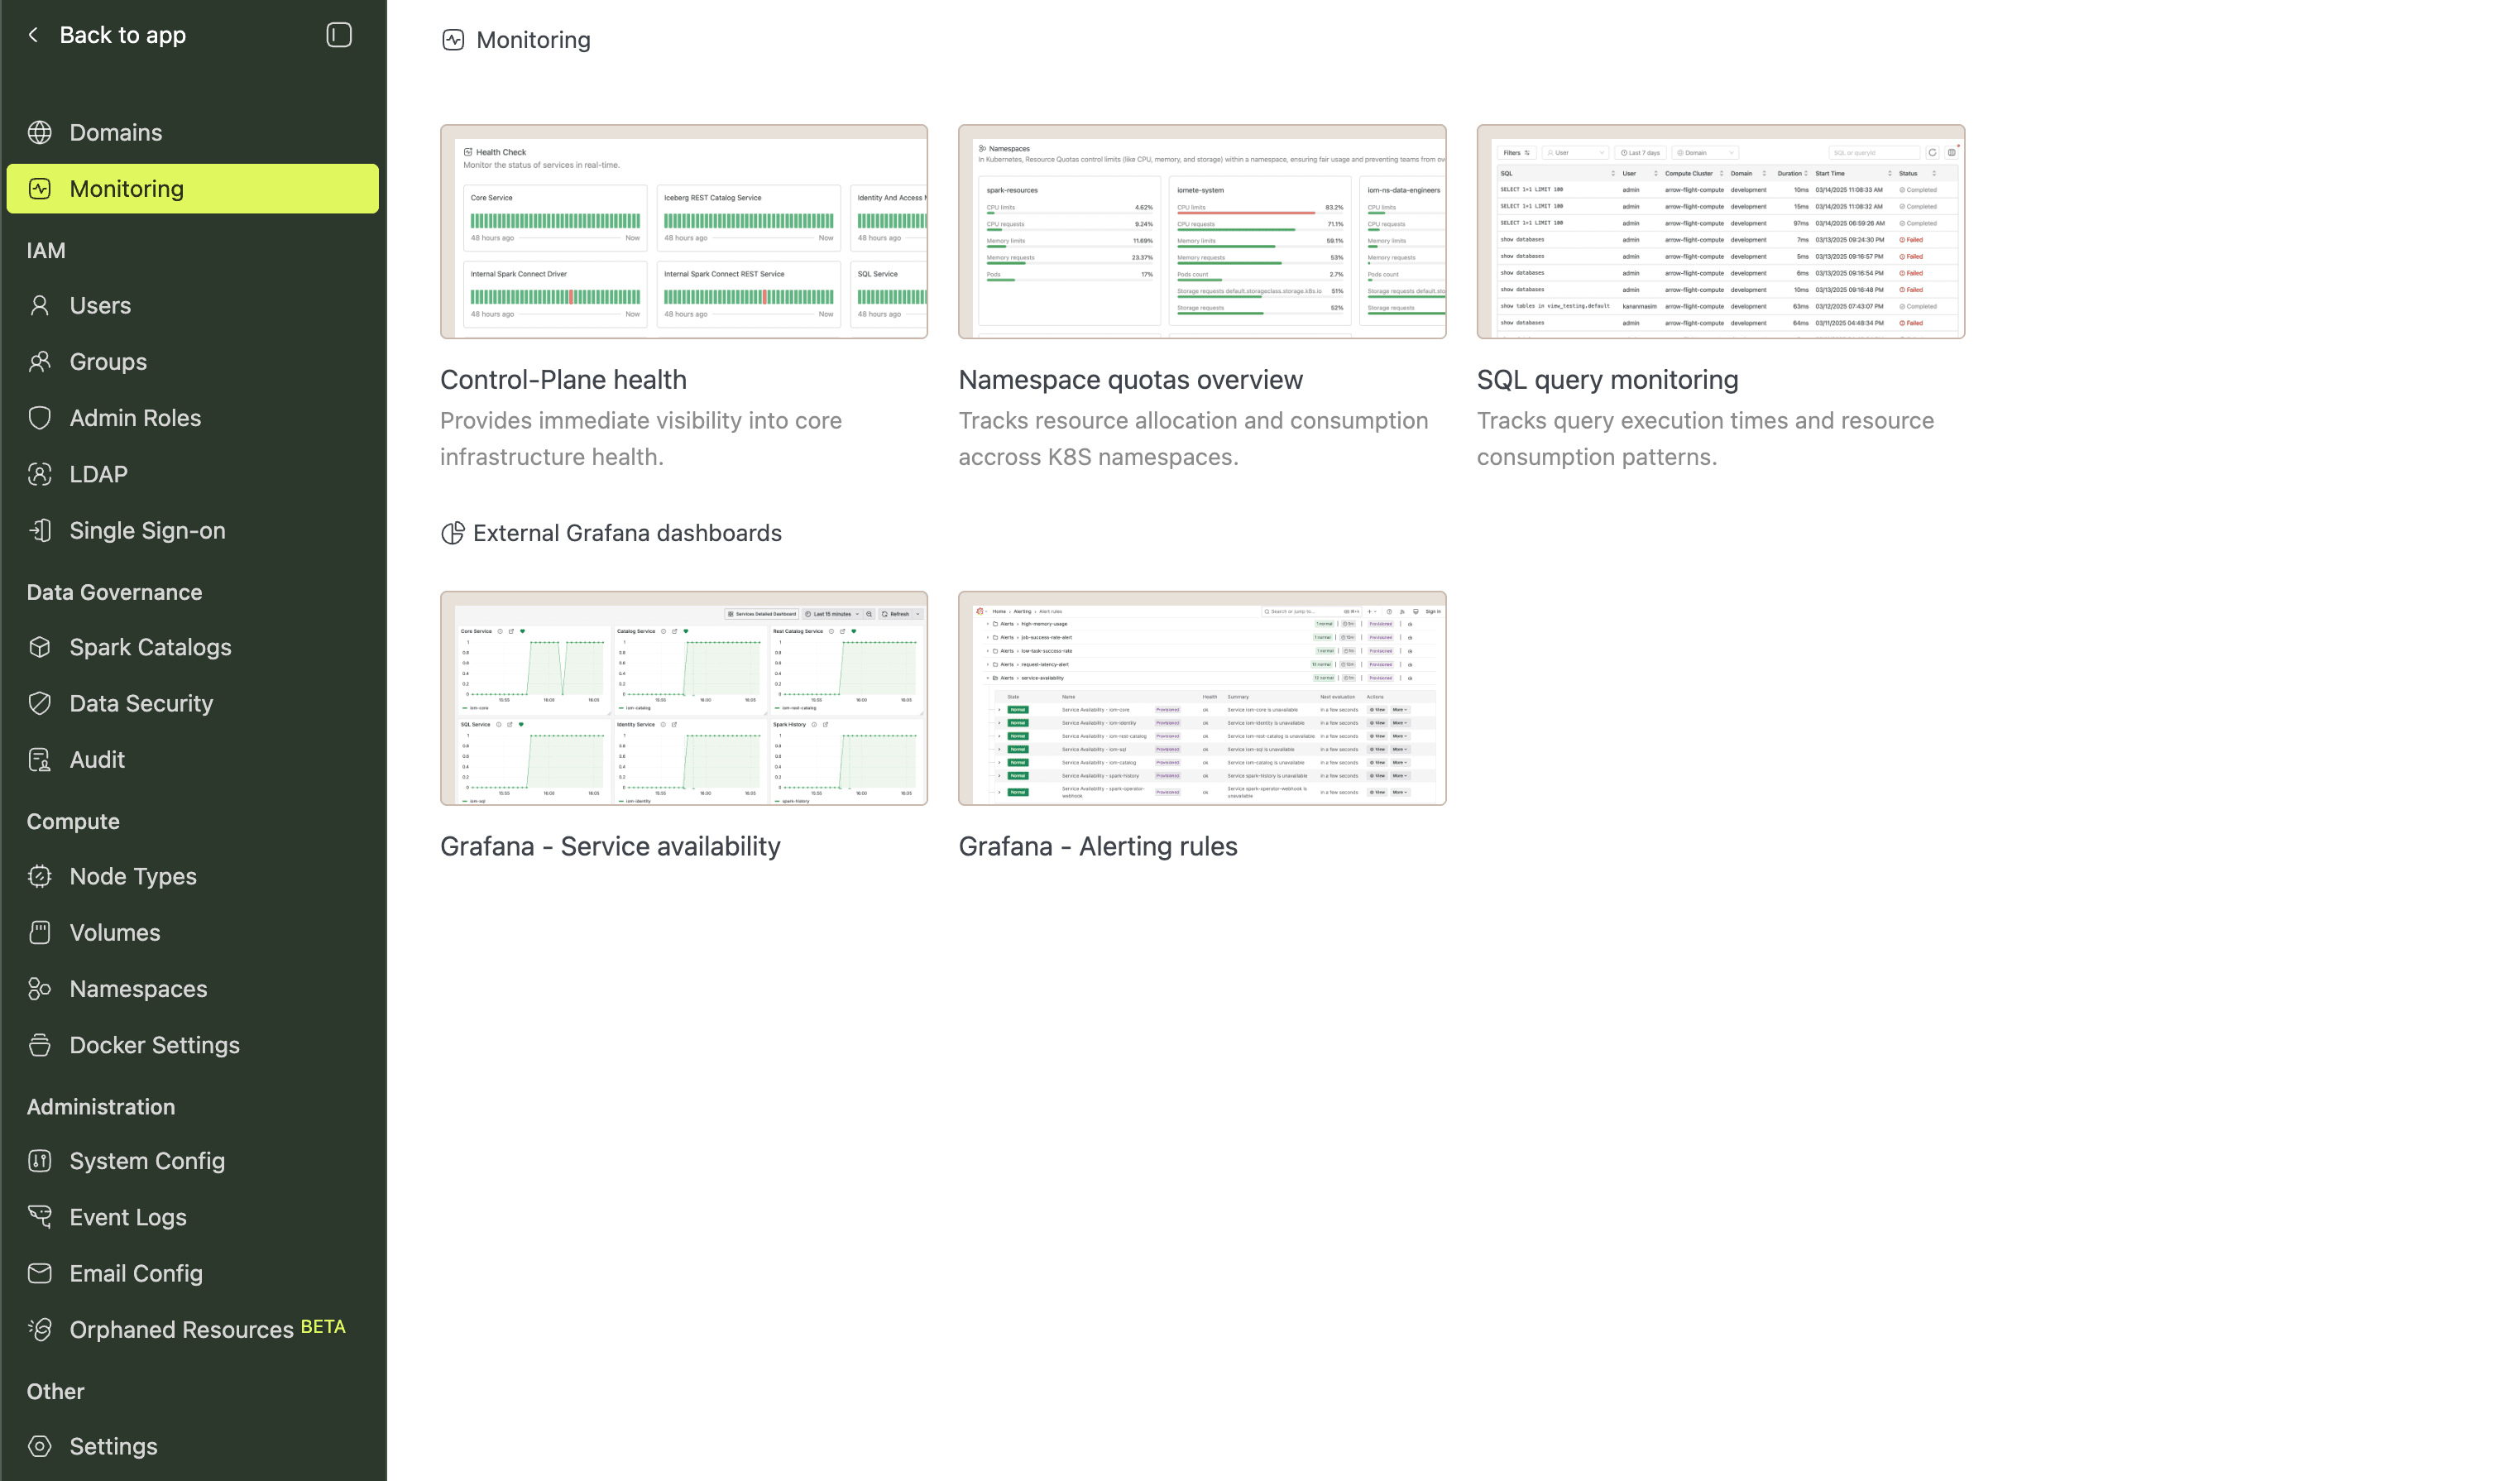
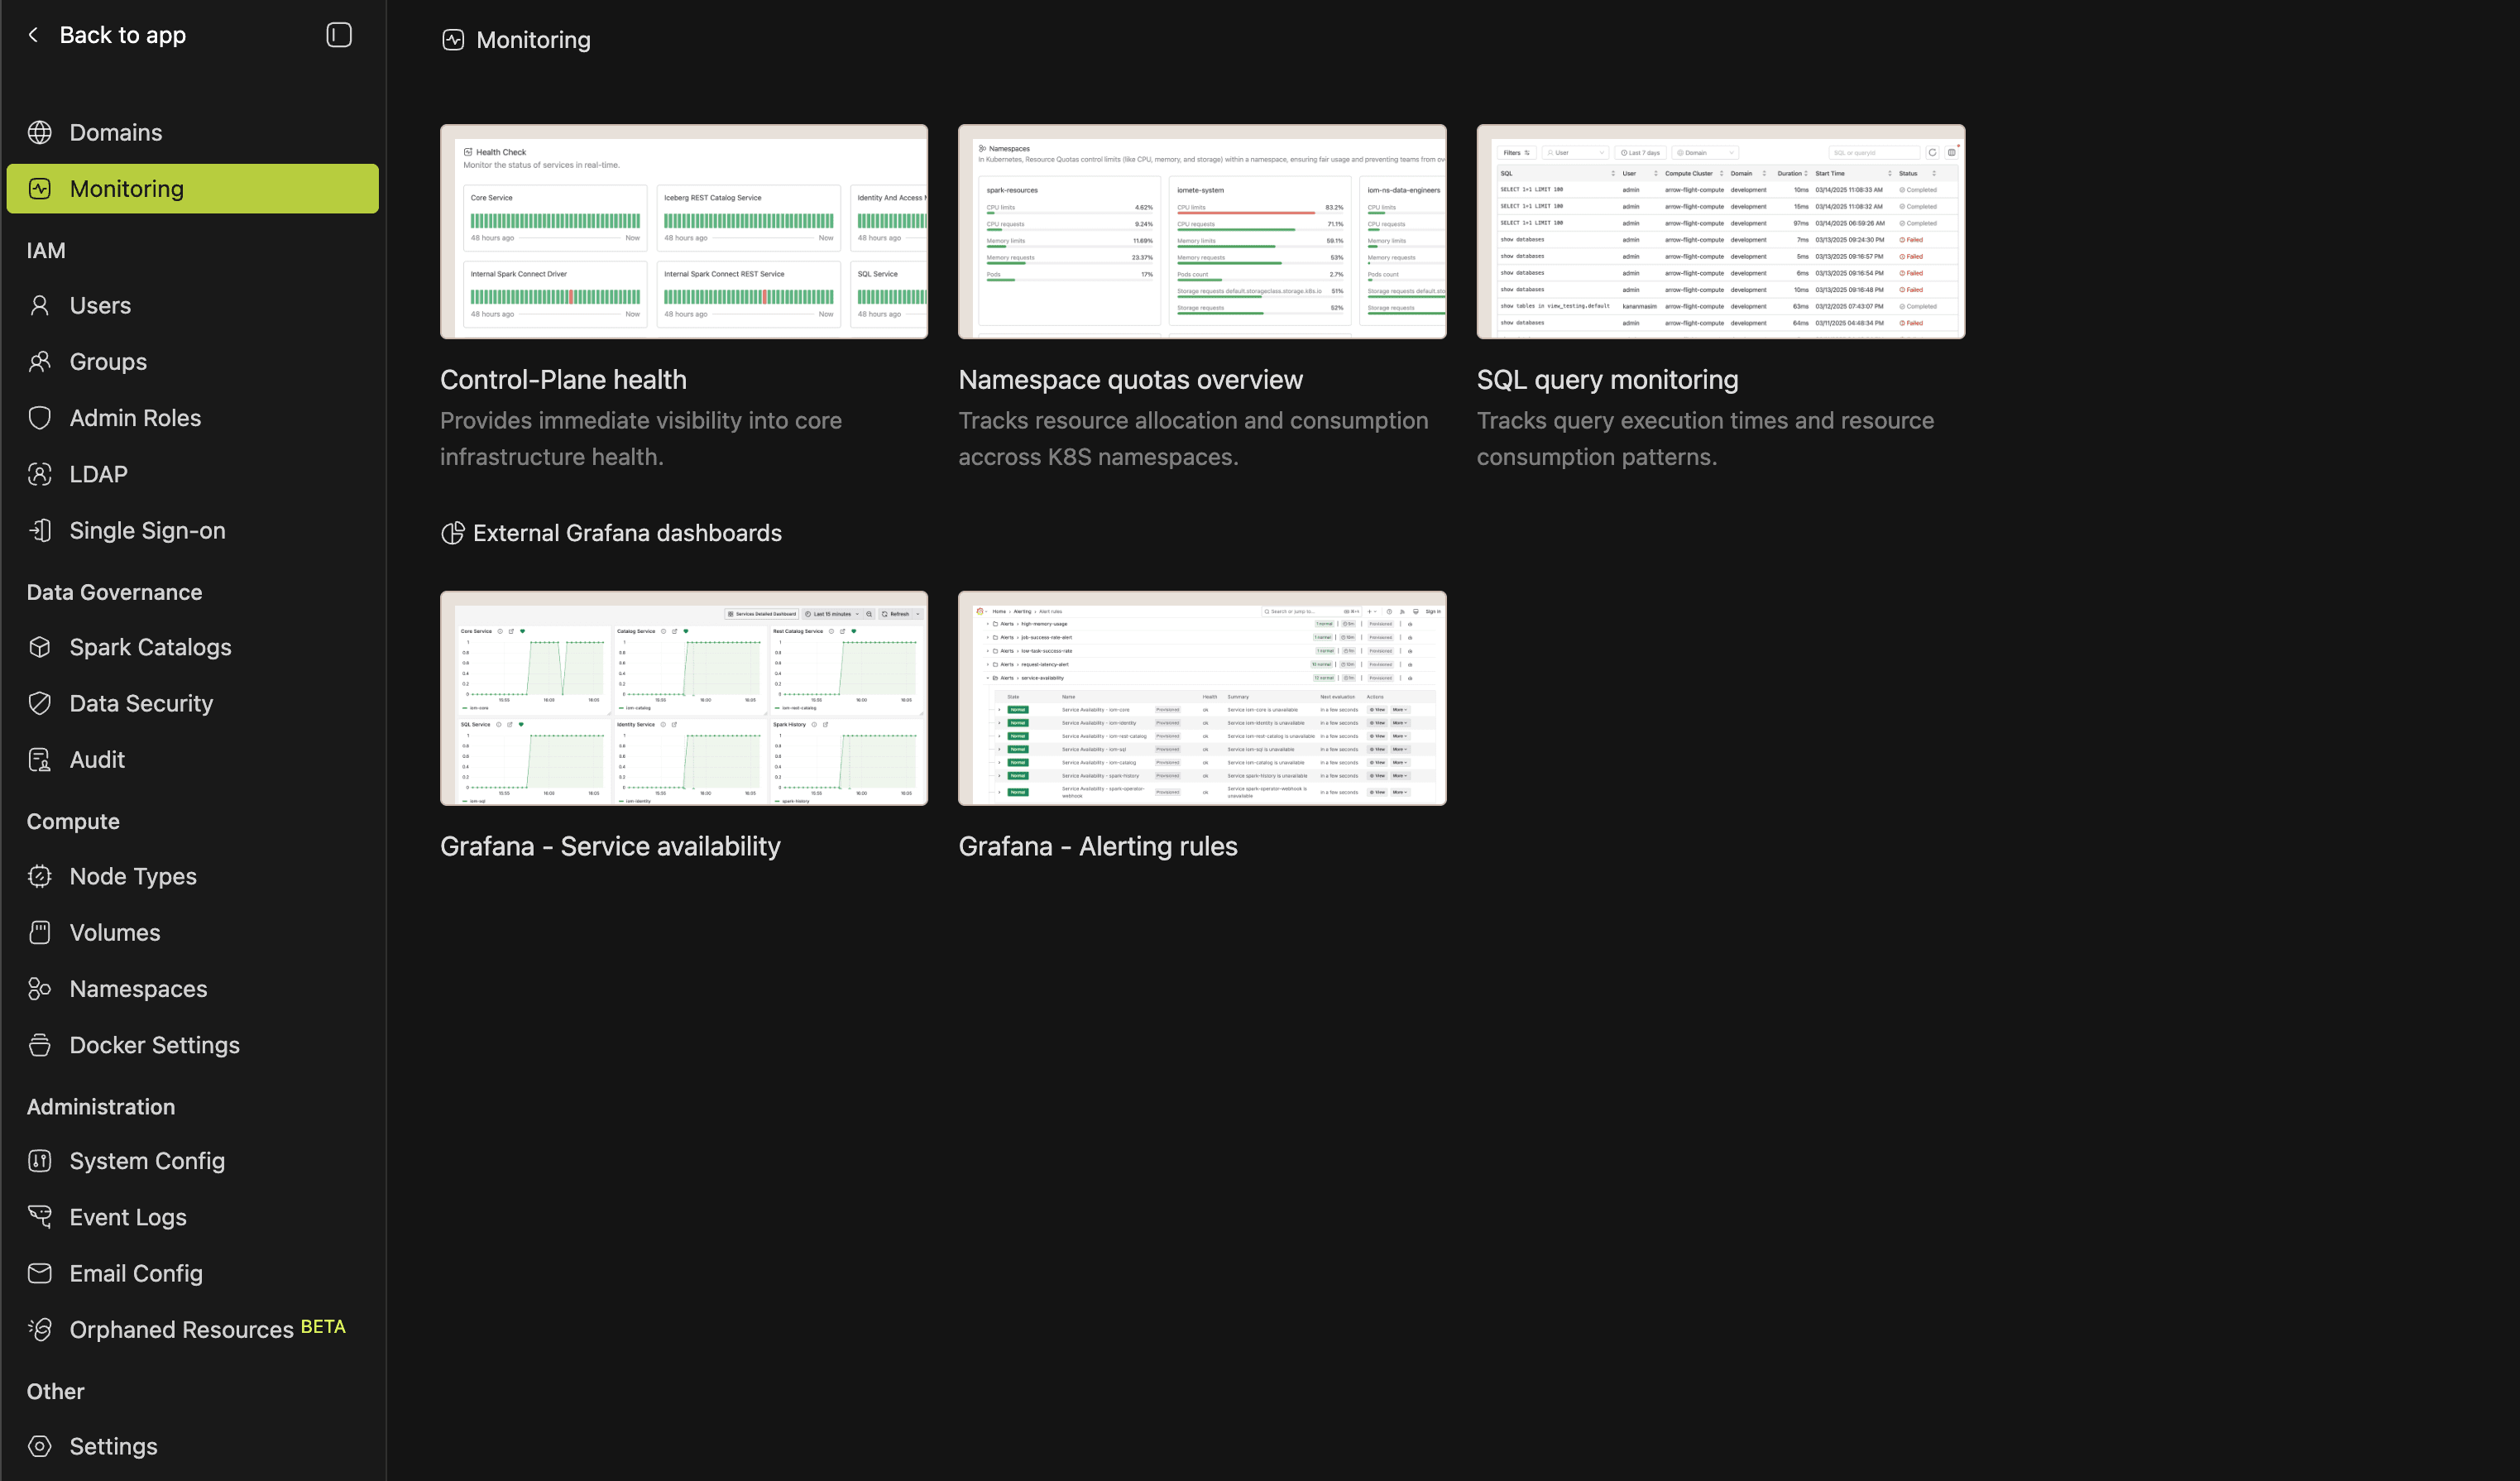
Admin Portal
Platform administrators manage users, security, and infrastructure from the Admin Portal. Access it through the user menu.
- IAM: Users, Groups, Admin Roles, LDAP, and Single Sign-On (SSO).
- Data Governance: Spark Catalogs, Data Security policies, and Audit logs.
- Compute: Node Types, Volumes, Namespaces, and Docker Settings.
- Administration: System Config, Event Logs, Email Config, and Orphaned Resources.
Some features (Jupyter Containers, Event Streams, Query Monitoring, and Schedules) may not be visible depending on your deployment configuration.