Running Iceberg Maintenance in Production: A Practical Guide for Data Teams



This is Part 5 of our Apache Iceberg Table Maintenance series. Explore the full series:
- Part 1: The Hidden Debt in Your Lakehouse Tables
- Part 2: What Iceberg Gives You for Table Maintenance
- Part 3: The Iceberg Table Maintenance Landscape
- Part 4: How We Built Automated Table Maintenance
- Part 5: Running Iceberg Maintenance in Production
- Part 6: Why We Rebuilt Orphan File Cleanup from Scratch
In Part 4, we walked through how we designed and built our automated maintenance system. This post picks up where that left off — the problems we ran into once the system was operating against real production workloads, and how we solved each one.
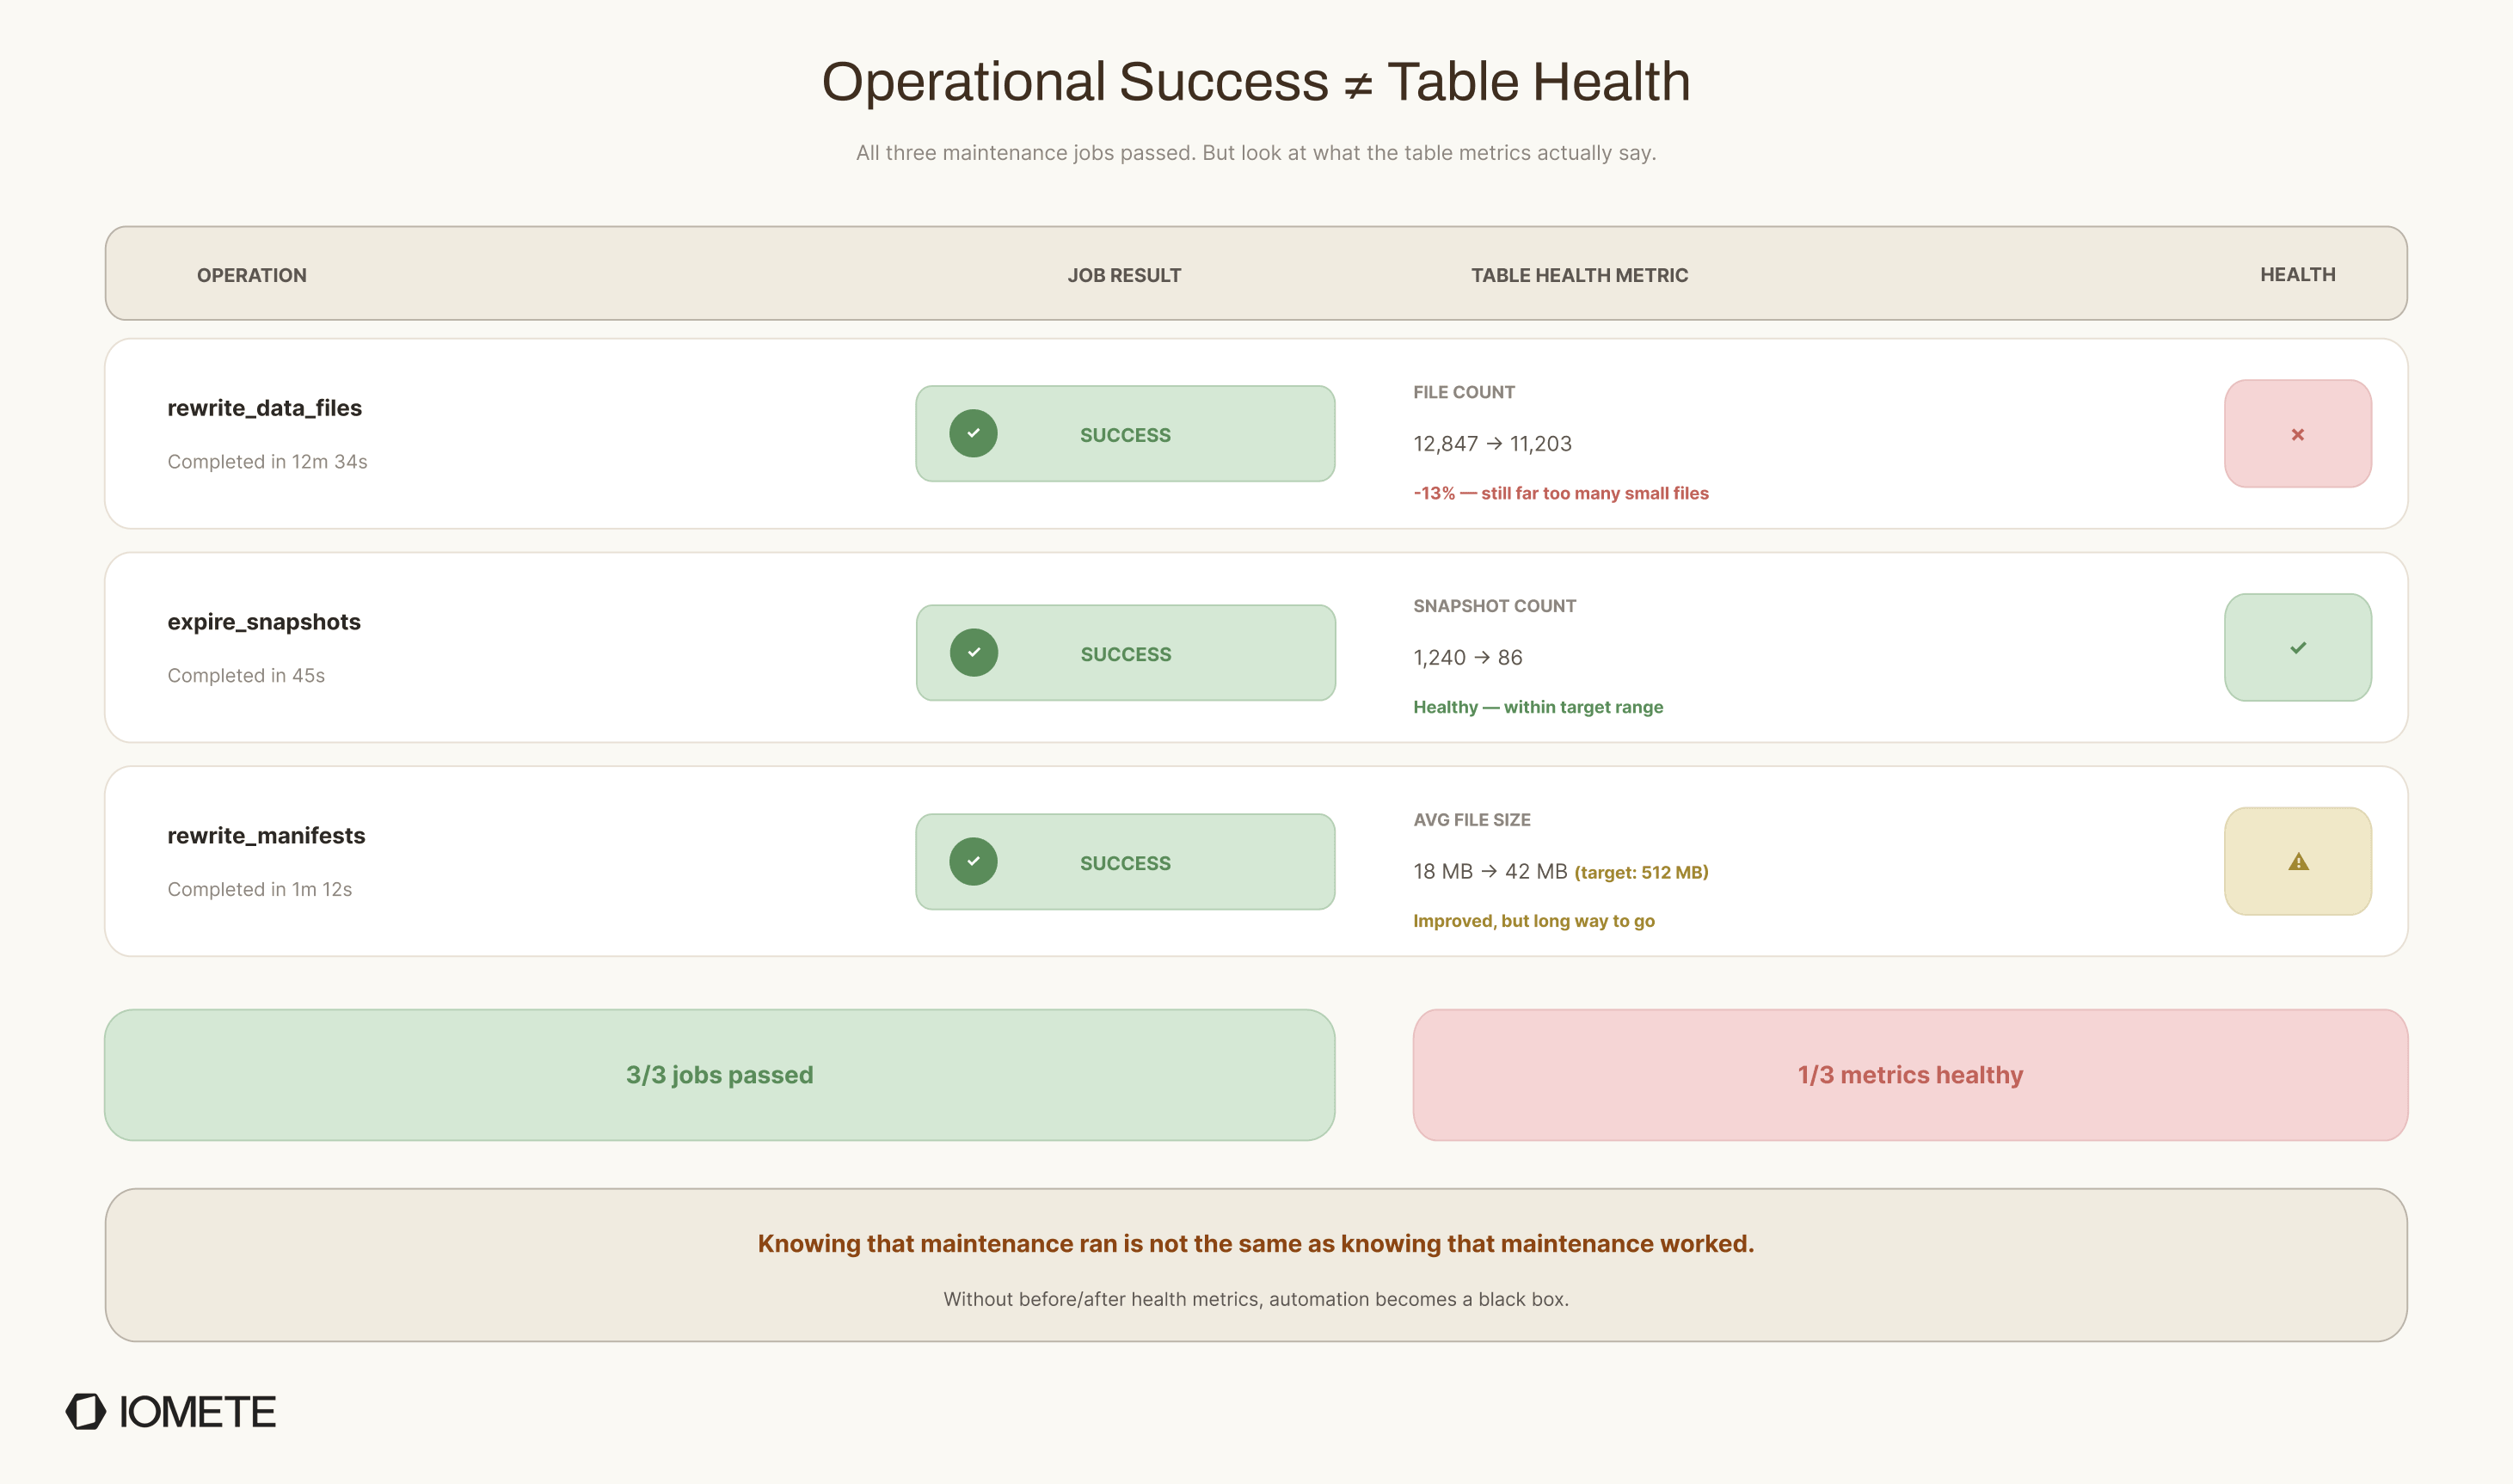
Consider a compaction job that completes successfully — no errors, green across the board. But the table still has hundreds of small files because the threshold was too conservative for a high-volume streaming table. The job did what it was told. The table just didn't get healthier. A successful run and a healthy table are not the same thing.
At scale, the maintenance operations don't change. The environment does. Shared compute, continuous ingestion, competing workloads, and the need for observability across the entire table fleet turn maintenance into a scheduling, resource management, and reliability problem.
The rest of this post walks through the specific challenges we encountered and how we addressed them.
The Challenges We Encountered
Not Every Table Needs the Same Maintenance
One of the first mistakes teams make when automating table maintenance is treating every table the same.
The logic is understandable. A single compaction threshold, a single snapshot retention policy, and a single schedule are easy to configure and easy to explain. Unfortunately, they rarely survive contact with a real production environment.
Tables within a lakehouse behave very differently depending on how they are written, queried, and consumed:
- Fact tables fed by streaming pipelines can generate thousands of small files every day. They often require frequent compaction and aggressive snapshot expiration.
- Dimension tables may receive fewer writes, but frequent updates and deletes (e.g., slowly changing dimensions) generate delete files that add read overhead through merge-on-read. Because these tables are joined into nearly every query, even modest overhead has outsized performance impact — making targeted compaction critical.
- Append-only log tables grow continuously but rarely receive updates or deletes. Snapshot cleanup is important, and compaction depends on how data arrives — streaming appends that produce undersized files need regular compaction, while rightly-sized batch appends may not.
- Historical or archived tables may remain untouched for months. In many cases, the best maintenance strategy is to leave them alone entirely.
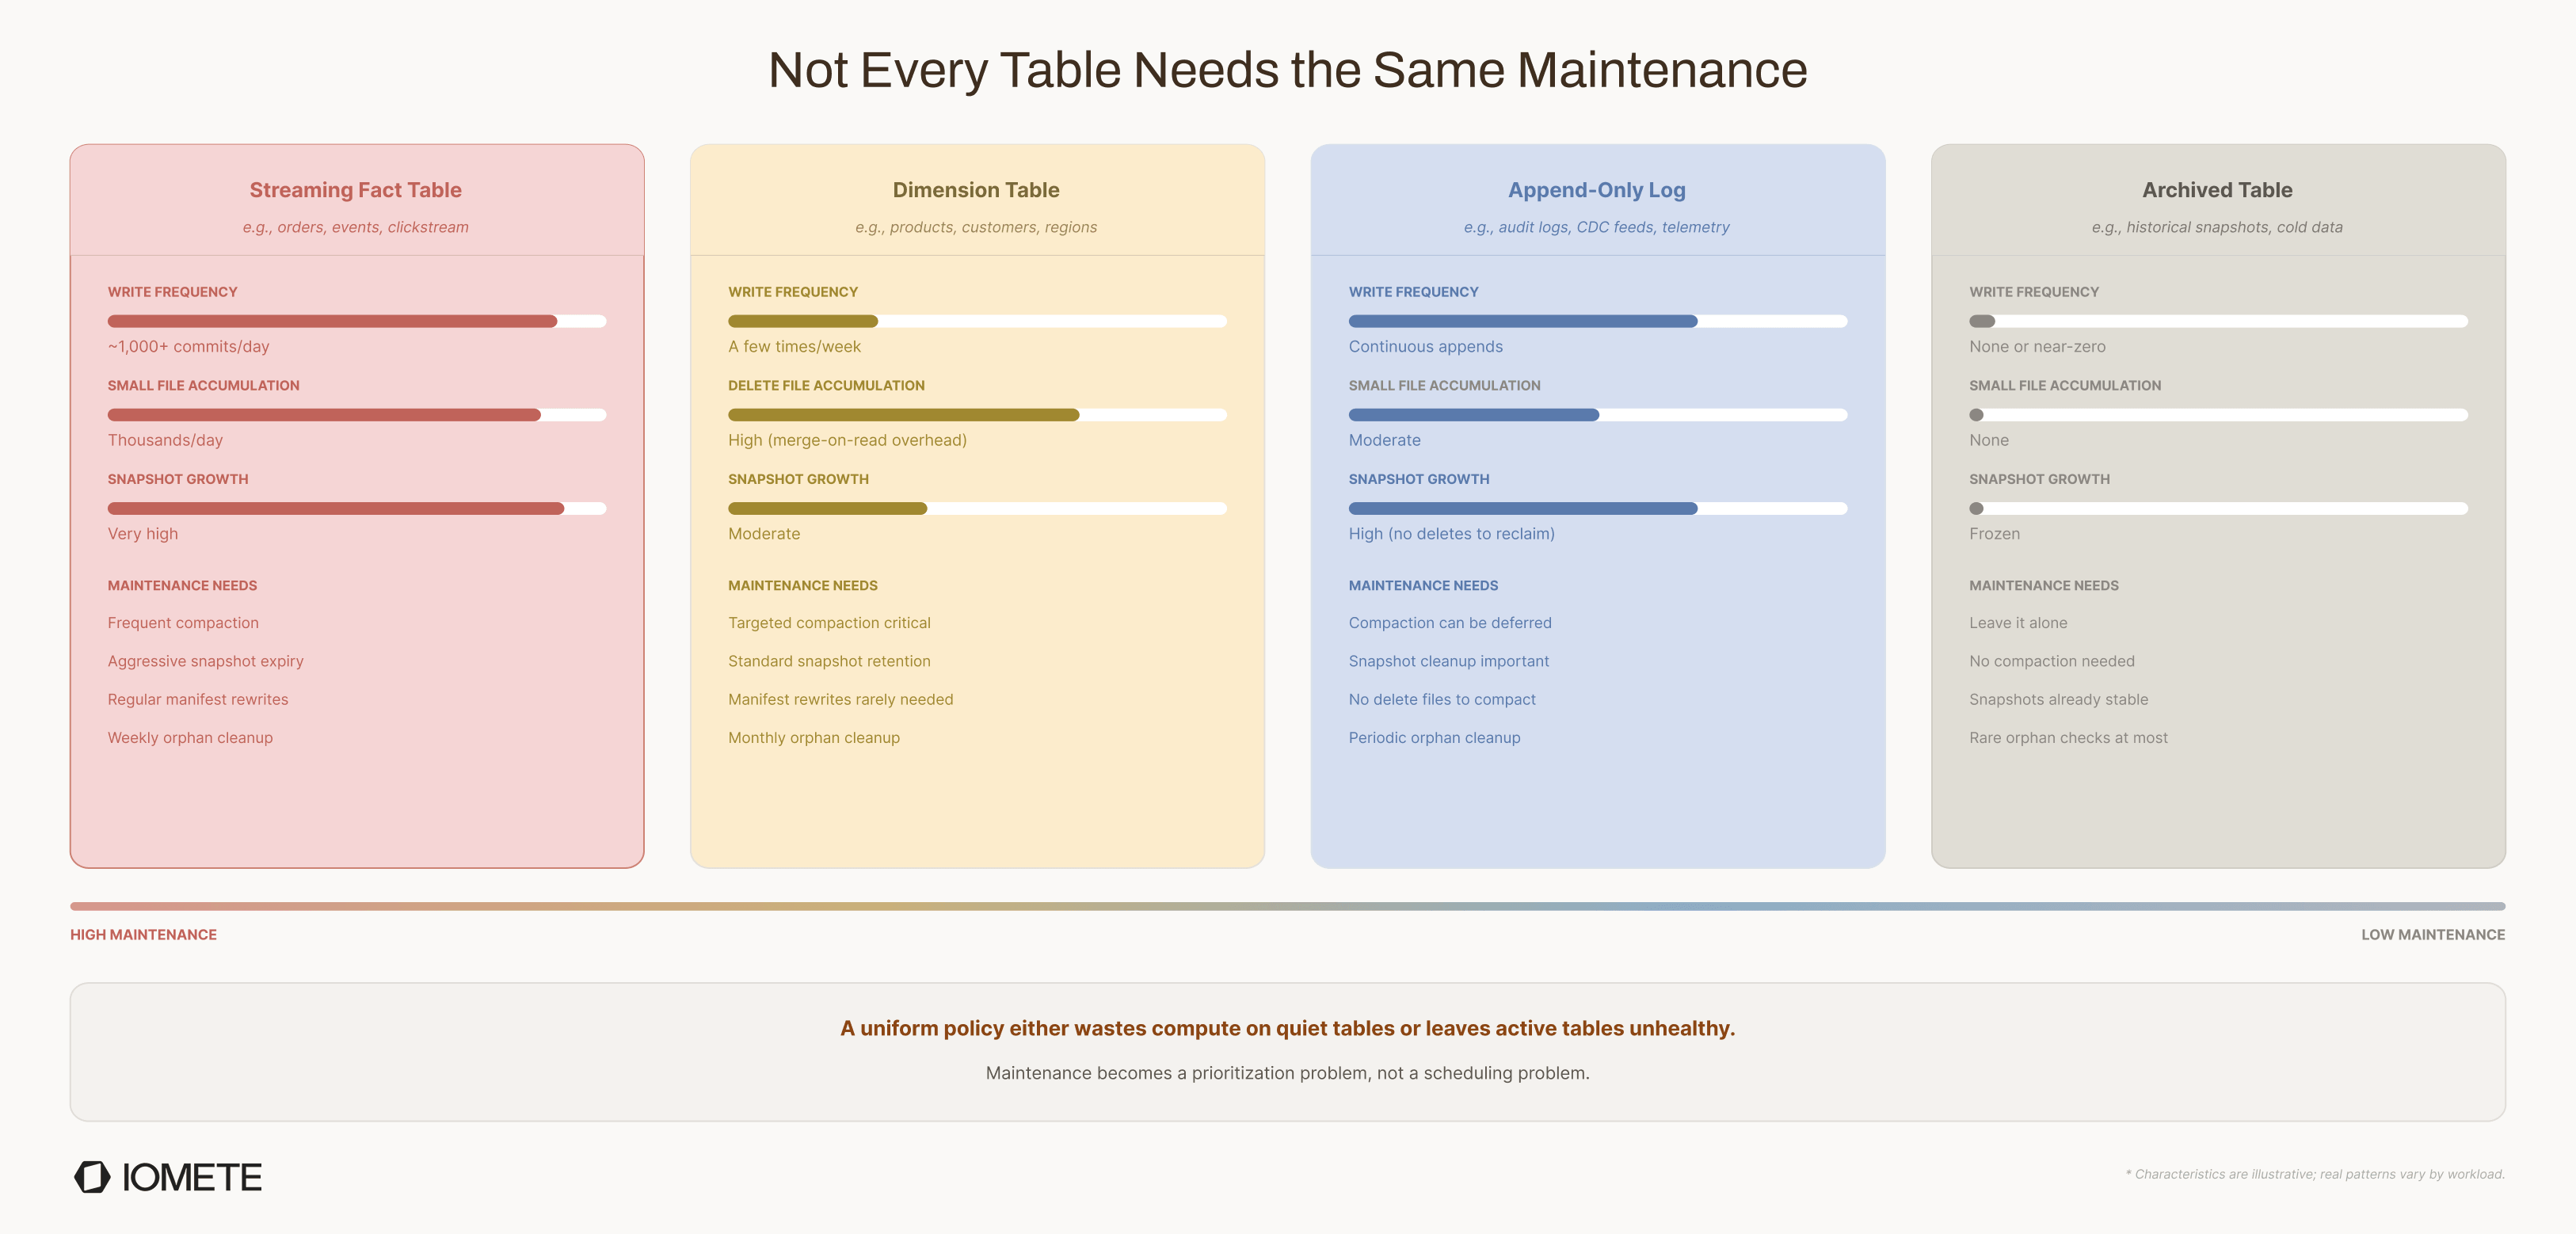
A uniform policy inevitably creates one of two outcomes:
- Active tables accumulate maintenance debt because thresholds are too conservative.
- Quiet tables consume unnecessary compute because thresholds are too aggressive.
Neither scales well.
As the number of tables grows, maintenance becomes a prioritization problem rather than a scheduling problem. The system must be able to distinguish between tables that need attention and tables that do not.
In previous post, we described how our evaluate phase uses table metrics and configurable thresholds to make these decisions dynamically. More broadly, any production-grade maintenance system needs a mechanism to adapt maintenance behavior based on table characteristics, whether through table tiers, per-table policies, or metric-driven triggers.
Monitoring Table Health
Maintenance is easy to automate. Knowing whether it is working is much harder.
Teams can usually tell you whether a maintenance job succeeded or failed. What they often cannot answer is:
Did the table actually become healthier?
A successful compaction job doesn't necessarily mean the small file problem is resolved. A completed snapshot expiration doesn't mean metadata growth is under control. Operational success and table health are related, but they are not the same thing.
The metrics that reveal actual table health are things like small file count, average file size, snapshot count, metadata file growth, and storage consumption. These move slowly. A problem building over days or weeks rarely announces itself until it surfaces as slower queries or unexpectedly rising storage costs.
Without visibility into these signals, maintenance becomes reactive. By the time something is obviously wrong, the debt has already accumulated.
Observability is not about dashboards. It's about answering one question: did the table actually get healthier?
Protecting Shared Catalog Infrastructure
Most maintenance discussions focus on individual tables. In production, the bigger concern is often the catalog itself.
Every maintenance operation ultimately interacts with the catalog. Compaction commits new snapshots. Snapshot expiration removes expired snapshots and their associated data files. Manifest optimization rewrites metadata structures. Even evaluating table health requires catalog reads.
On a single table, this activity is negligible. Across hundreds or thousands of tables running in parallel, it becomes a steady stream of metadata operations and that stream competes with everything else sharing the same catalog: ingestion pipelines, interactive queries, production commits.
Running maintenance across a large table fleet simultaneously can create bursts of catalog load that cause slower table loading, increased metadata latency, and longer commit durations for workloads that have nothing to do with maintenance.
At that point, the objective is no longer just keeping tables healthy. It is keeping the entire platform healthy. Maintenance should behave like a good background service — consuming spare capacity when the platform is quiet and stepping back when production workloads need it.
Managing Configuration Across Multiple Layers
Configuration seems straightforward when a maintenance system is first deployed. A few global settings, a handful of thresholds, and everything behaves predictably.
That simplicity rarely lasts.
As adoption grows, different teams begin to require different maintenance behaviors. Some tables need longer retention periods for compliance. Others need more aggressive compaction because they support latency-sensitive analytics. Over time, configuration spreads across platform defaults, catalog policies, namespace rules, and table-level overrides.
The challenge is not supporting these layers. The challenge is ensuring they remain understandable.
Conflicts inevitably emerge. A platform administrator may configure snapshot expiration after 30 days, while a specific table requires 90-day retention for regulatory reasons. A catalog may define compaction thresholds that don't fit the requirements of a high-volume streaming table. In production, predictability matters as much as flexibility, and a system that cannot explain its own behavior undermines both.
Users should always be able to answer one question:
Why did this maintenance action run?
If the answer requires digging through multiple layers, the system has transferred its complexity to its users. The effective configuration should always be visible, not inferred.
Keeping Defaults Simple
One of the easiest ways to make automated maintenance difficult to adopt is to expose every available tuning parameter.
From an engineering perspective, configurability is attractive. Iceberg exposes a rich set of maintenance controls, and it is tempting to surface all of them to users. In practice, most users don't want to become experts in compaction strategies, snapshot lifecycle management, or resource allocation. They simply want their tables to remain healthy.
Every additional setting introduces another decision, another potential misconfiguration, and another reason to delay adoption. What begins as flexibility quickly becomes complexity.
The goal is not to eliminate configurability. It is to make configuration optional.
Users should be able to turn on automated maintenance and trust that it is working without tuning anything upfront. The best maintenance system is the one nobody has to think about.
Building for Failure and Scale
Maintenance operations are long-running, resource-intensive, and inherently unpredictable.
A compaction job that normally completes in a few minutes may suddenly take hours because of increased data volume, infrastructure issues, or contention with other workloads. Snapshot expiration may encounter transient catalog failures. A worker process may restart halfway through a task.
In production, failures are not exceptional events. They are expected.
The question is not whether failures will occur, but how the system behaves when they do. Without protections like operation timeouts, automatic retries, and persistent task tracking, a single failure can leave maintenance in an unknown state. Work may be lost, duplicated, or simply abandoned.
Reliability, however, is only half of the challenge.
A maintenance service that performs well for 100 tables may struggle when responsible for thousands. As table counts grow, the platform itself needs to scale: workers that can be added independently, evaluation cycles that distribute load across instances, and behavior that stays predictable when maintenance demand spikes.
At scale, the maintenance platform becomes part of the critical infrastructure of the lakehouse. Ultimately, it should require less operational attention than the tables it maintains. If operators spend more time managing the maintenance platform than benefiting from it, the automation has failed its primary purpose.
The Common Thread
Each of these challenges points to the same gap: the difference between running maintenance operations and operating a maintenance system.
| Challenge | Core problem |
|---|---|
| Table-type differences | A single policy over-maintains quiet tables and under-maintains active ones |
| Health observability | Job success doesn't mean the table got healthier |
| Catalog load | Maintenance at fleet scale competes with ingestion and queries |
| Configuration layers | Multiple config sources make it hard to explain why a maintenance action ran |
| Defaults complexity | Surfacing every tuning parameter delays adoption and invites misconfiguration |
The rest of this post describes how we addressed each one.
What We Built Differently
The challenges above shaped many of the design decisions in our maintenance platform. Rather than treating maintenance as a collection of scheduled jobs, we approached it as a production service that needed to be observable, resource-aware, and predictable at scale.
Making Maintenance Observable
One of our primary goals was to make maintenance visible rather than something users simply trust is working.
For every maintenance operation, we capture metrics before and after execution so users can immediately understand its impact. Instead of reporting that a task succeeded, we show what actually changed:
- Rewrite Data Files tracks data file count and total data file size.
- Expire Snapshots tracks snapshot count.
- Rewrite Manifest Files tracks manifest file count and total manifest size.
- Cleanup Orphan Files tracks data and metadata file counts along with their storage footprint.
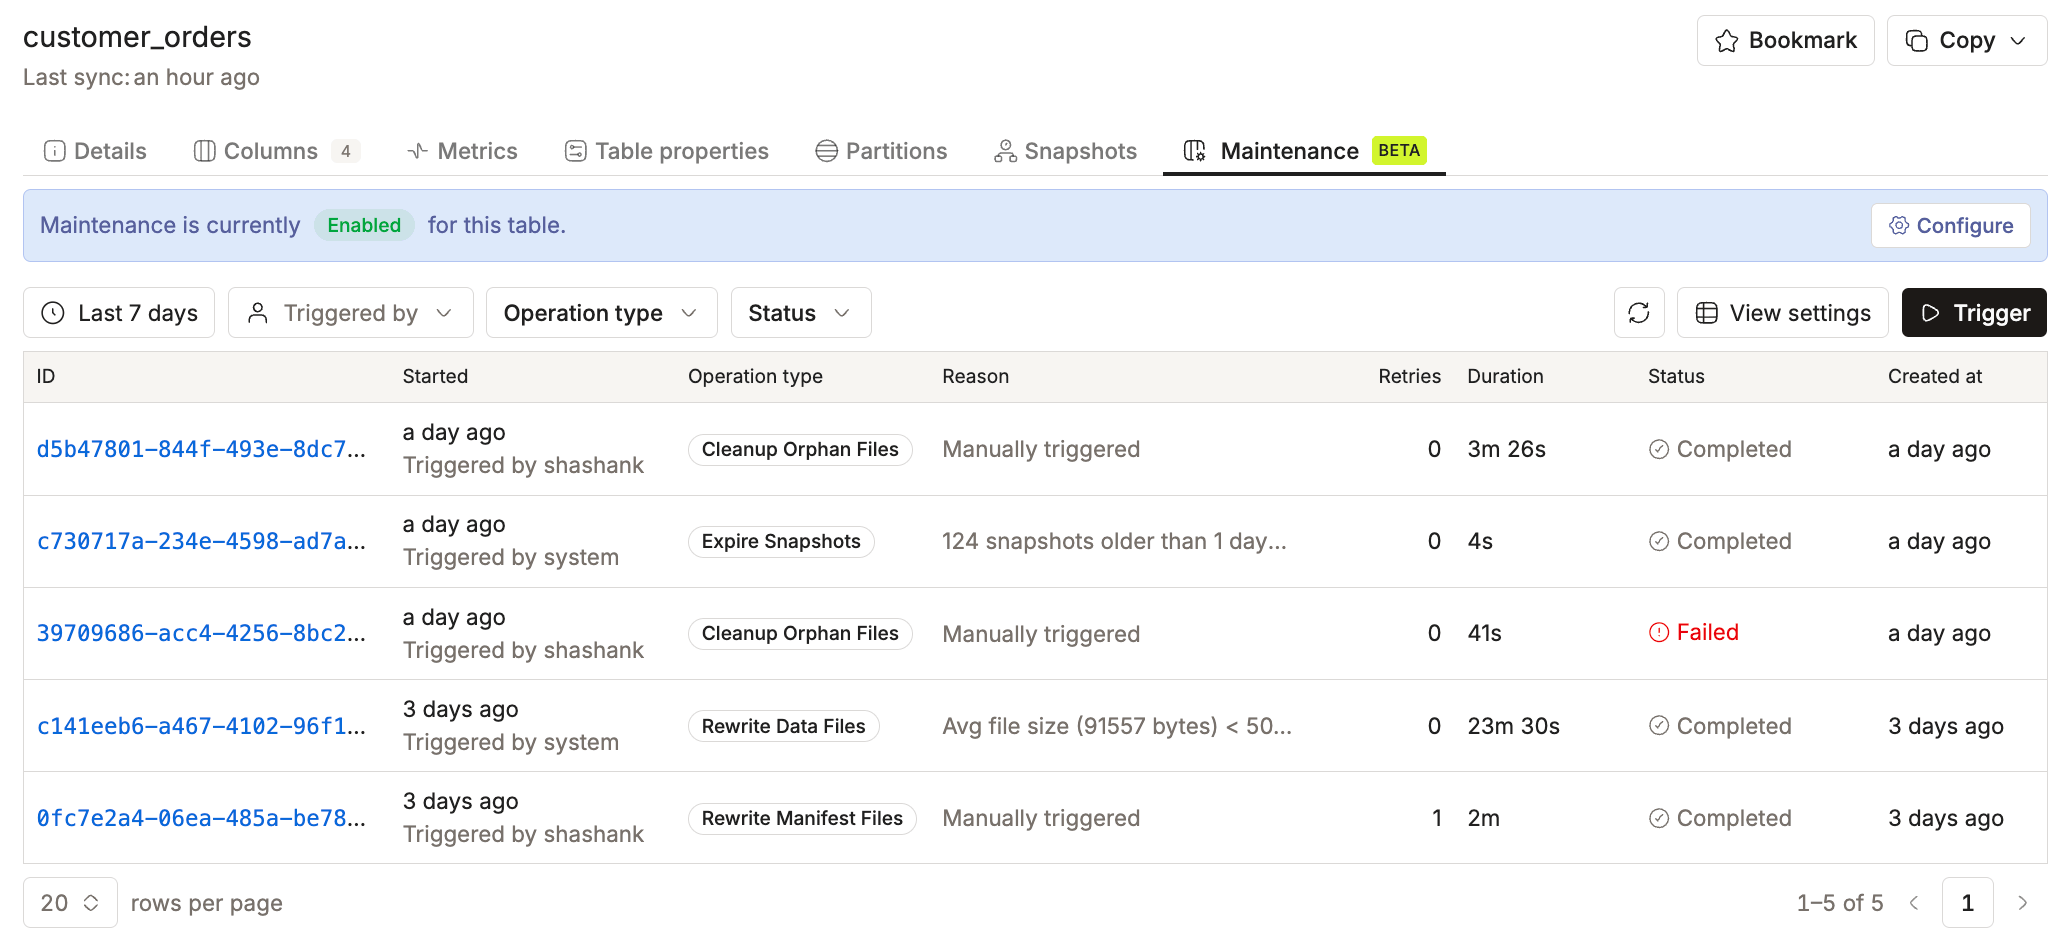
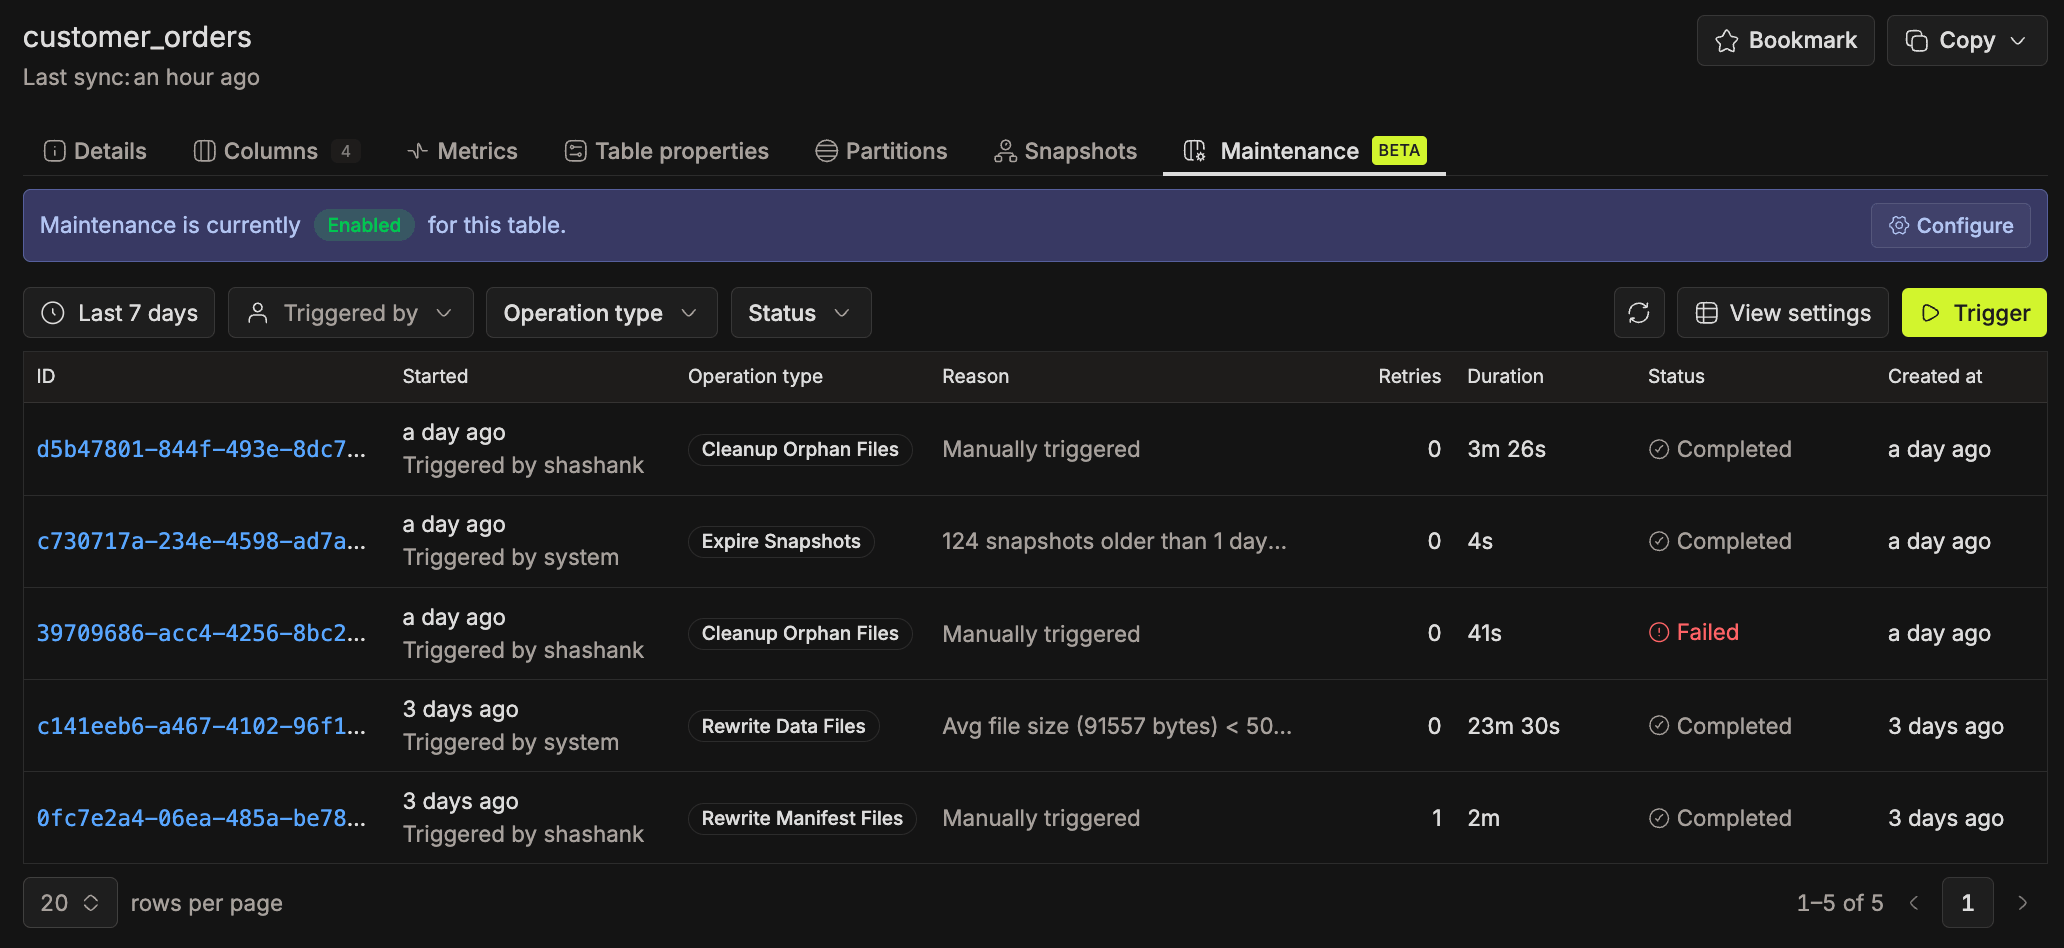
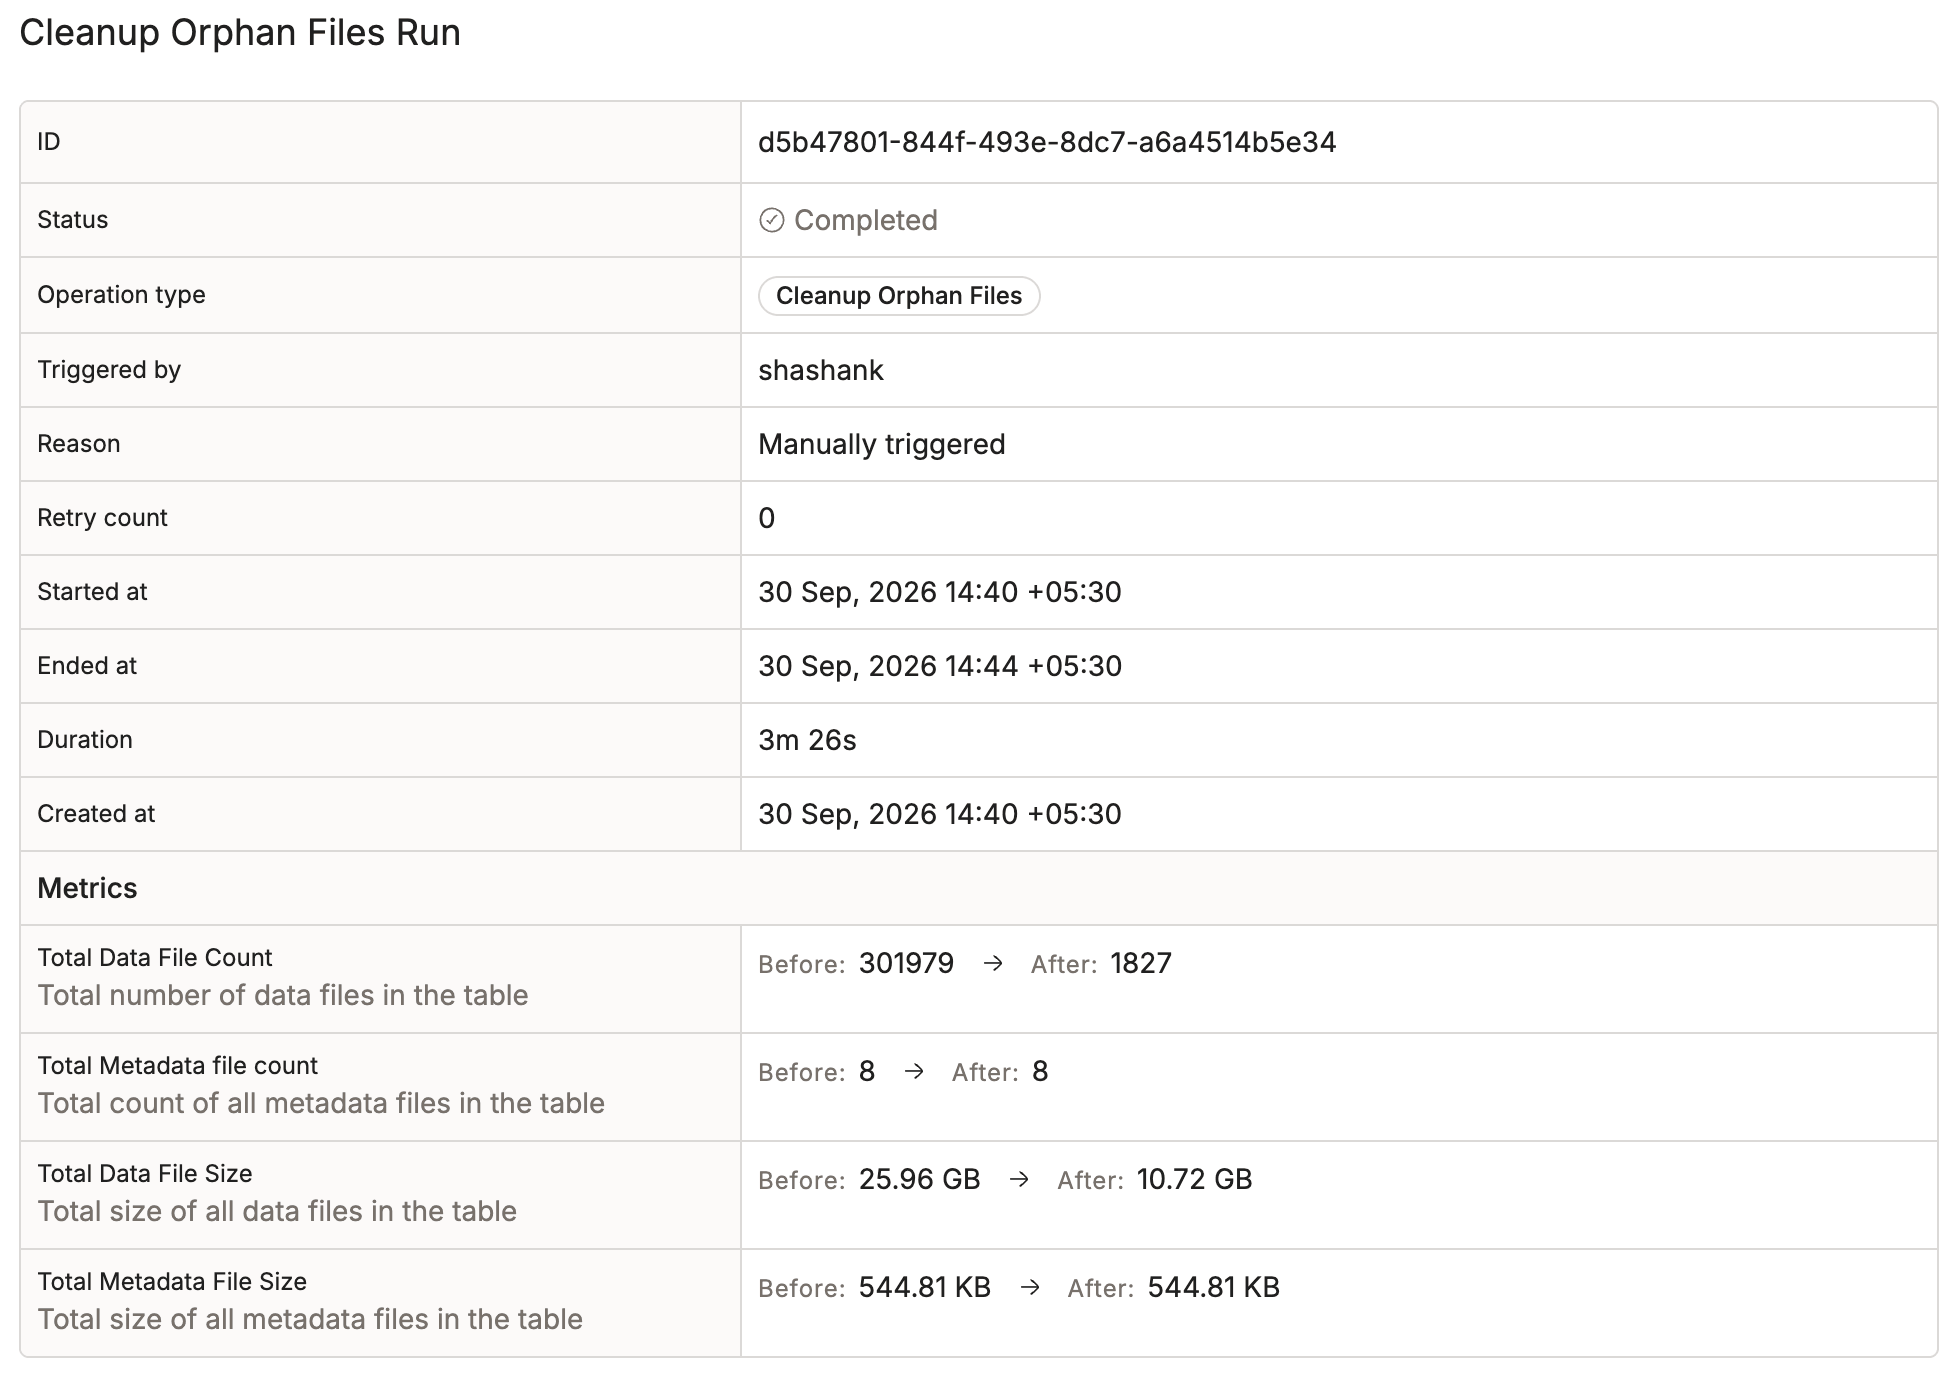
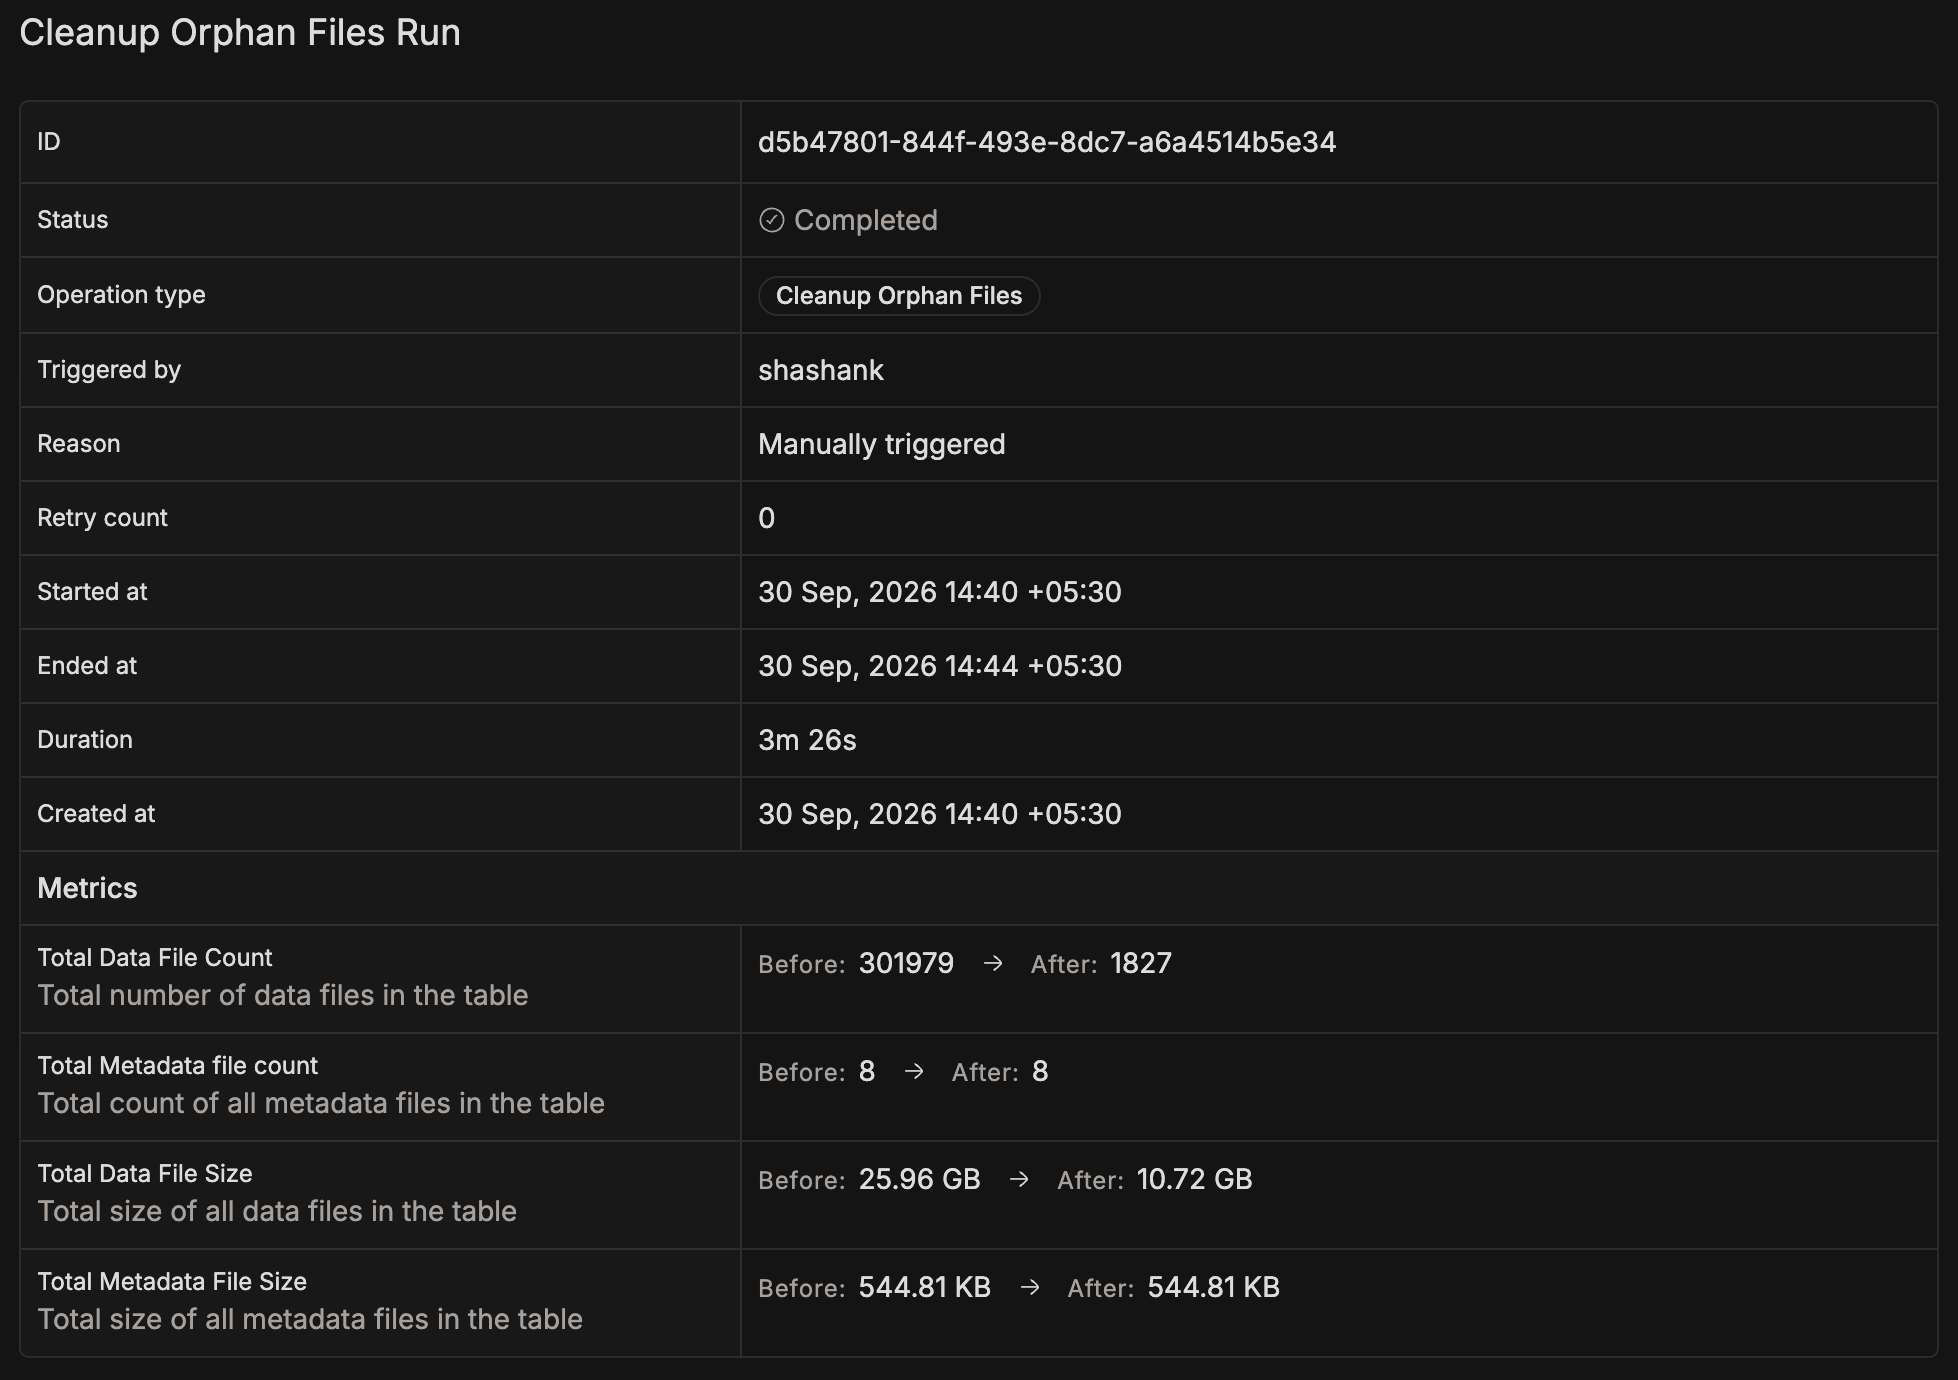
Observability matters even more when maintenance fails. Every operation records its execution status and surfaces error information directly to the user, without requiring a trip to service logs.
Failure:


Reason:
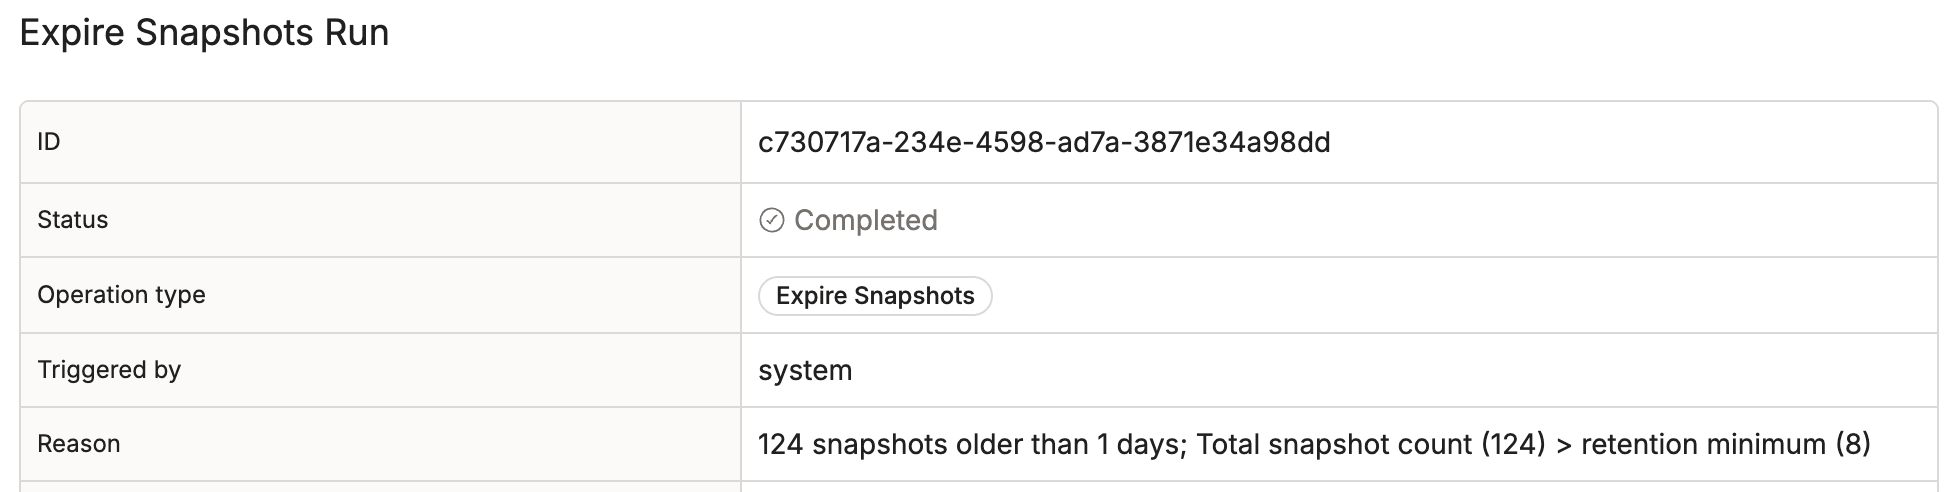
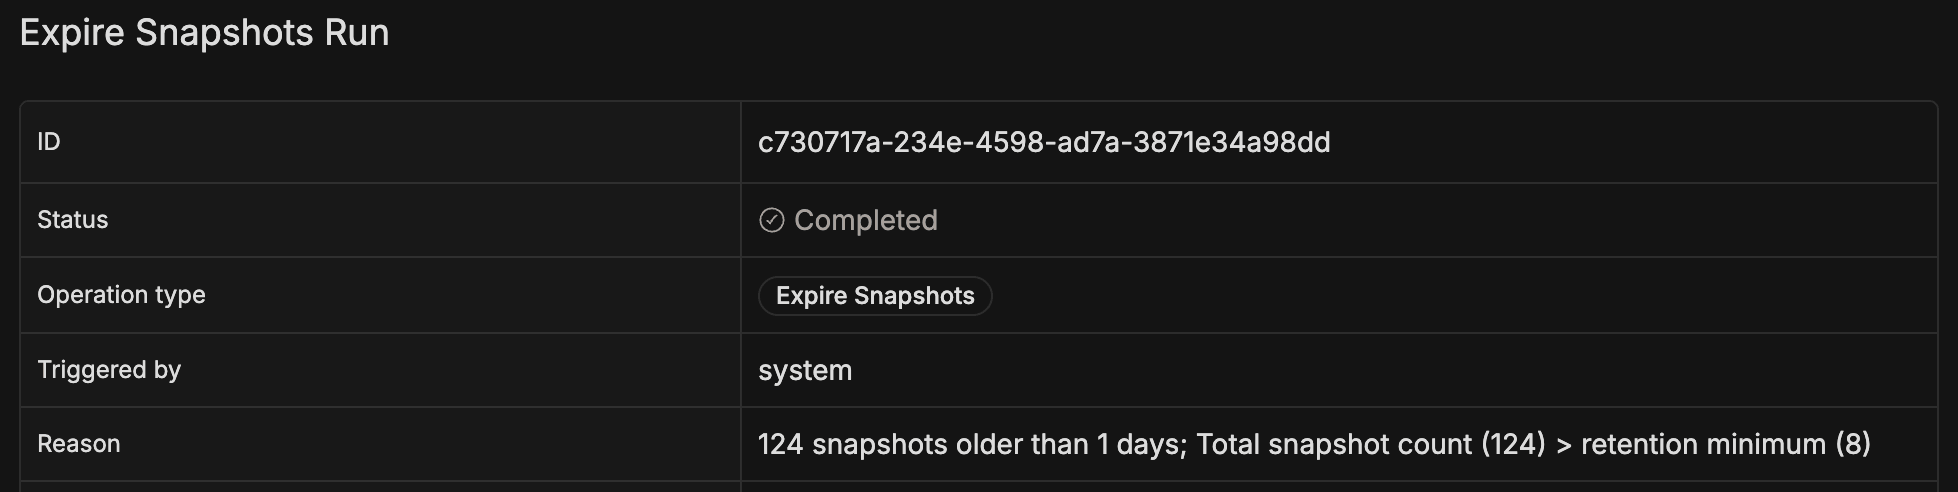
Users should always be able to understand what maintenance did, why it ran, and whether it worked.
Minimizing Catalog Load
Keeping catalog load under control was a core design requirement, not an afterthought. Without it, maintenance itself becomes the problem — slowing down ingestion, queries, and commits across the platform.
Rather than treating maintenance as a single workflow, we separated it into three independent stages: Detection, Evaluation, and Execution. Each stage can be throttled independently, so a burst of maintenance work in one stage doesn't overload the catalog for other workloads. (Part 4 covers this architecture in detail.)
On top of that separation, we introduced three concrete optimizations:
- Setting caching — frequently accessed settings are cached within the service rather than re-fetched on every cycle.
- Cooldown periods — recently evaluated tables aren't reconsidered before the effects of maintenance have had time to show.
- Smart scheduling — evaluation cycles avoid repeatedly scanning the same tables unnecessarily.
The objective is not to run maintenance as aggressively as possible. It is to improve table health while remaining a well-behaved citizen in a shared environment.
Keeping Configuration Predictable
As maintenance capabilities grow, configuration management can quickly become a source of complexity.
Many platforms accumulate layers over time: global defaults, environment-specific overrides, namespace policies, table-level settings, and operation-specific exceptions. The more layers, the harder it becomes to explain why any given maintenance action ran.
We deliberately chose a simpler model. Configuration exists at two levels: catalog and table.
IOMETE introduces its own maintenance properties (prefixed with iomete.maintenance.*) that control things like whether compaction is enabled, what strategy to use, or how many snapshots to retain. But teams often already have native Iceberg properties set on their tables — like write.target-file-size-bytes or history.expire.min-snapshots-to-keep. Rather than forcing users to migrate, the system recognizes both. IOMETE properties take precedence when both exist, and native Iceberg properties serve as fallback defaults. Everything is stored alongside catalog and table metadata, creating a single source of truth for maintenance behavior.
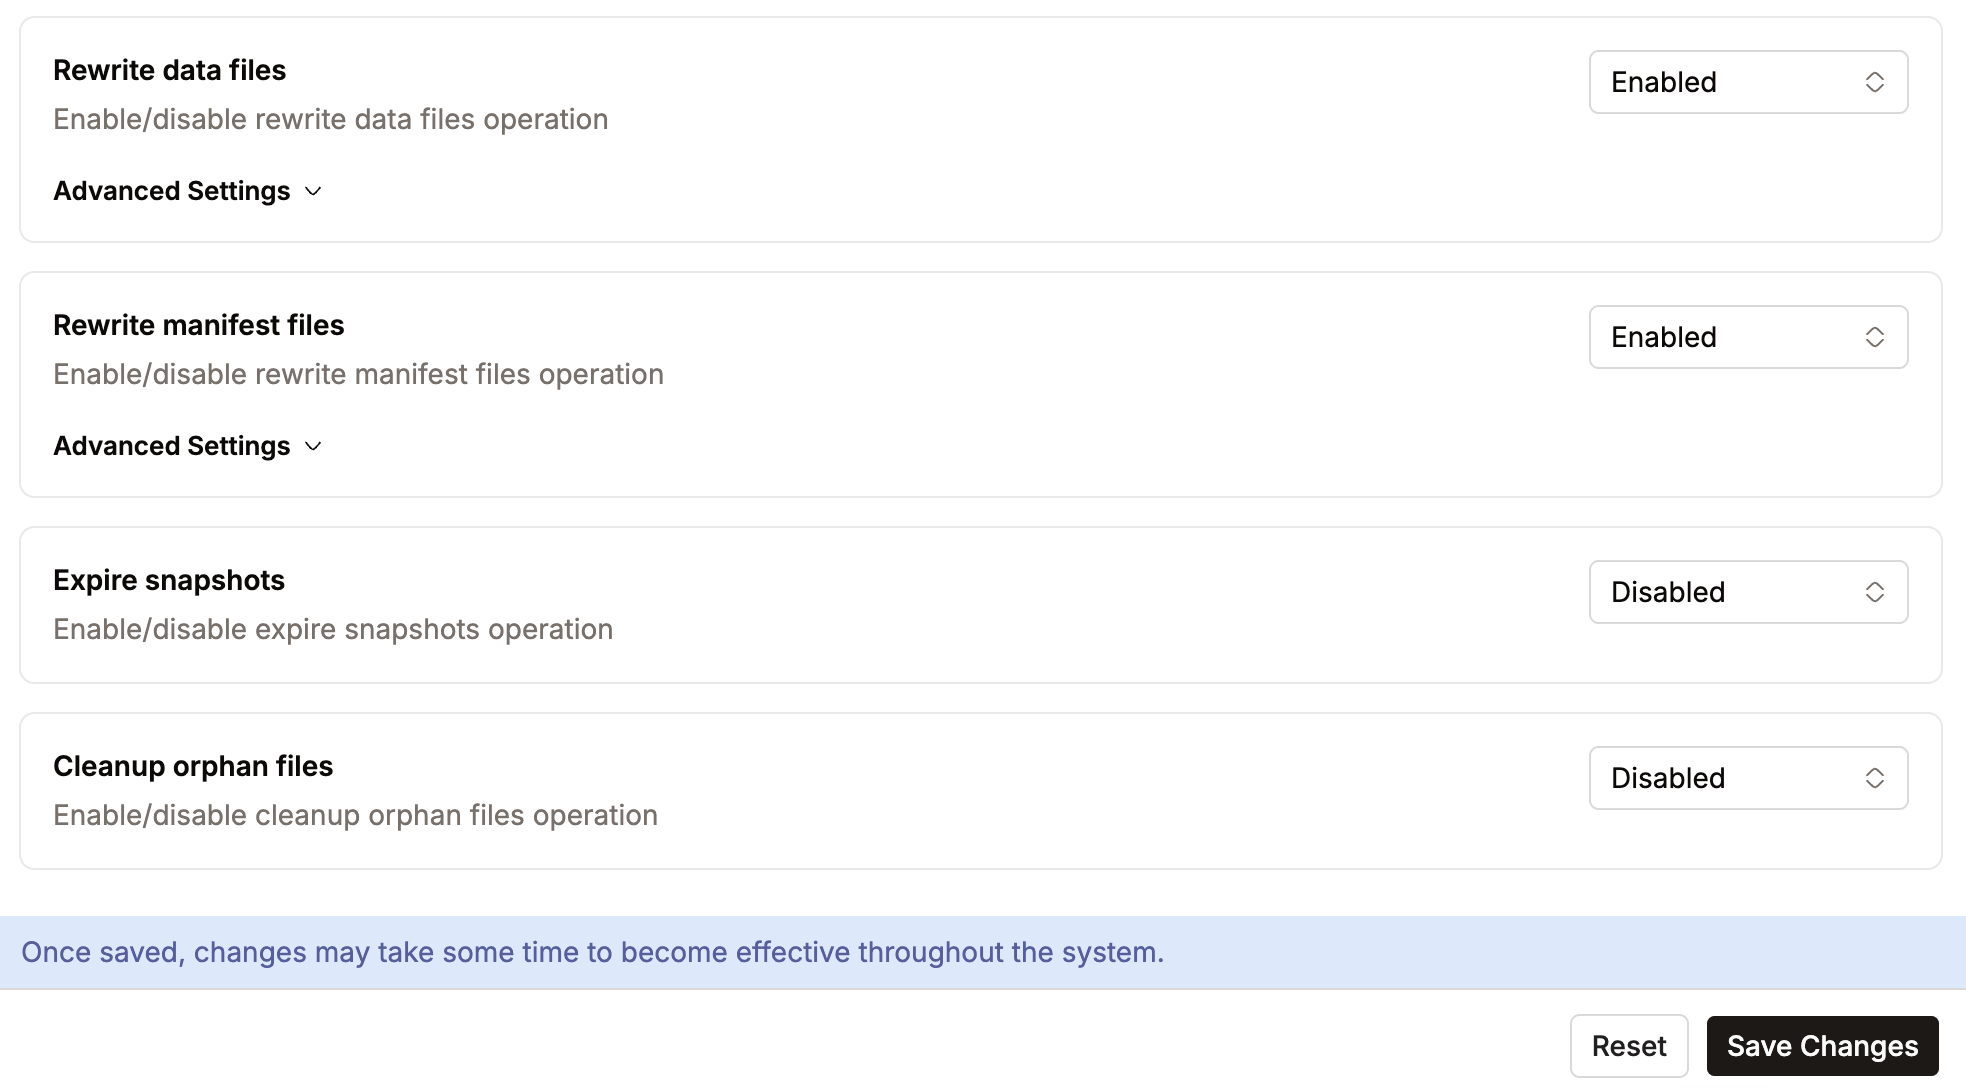
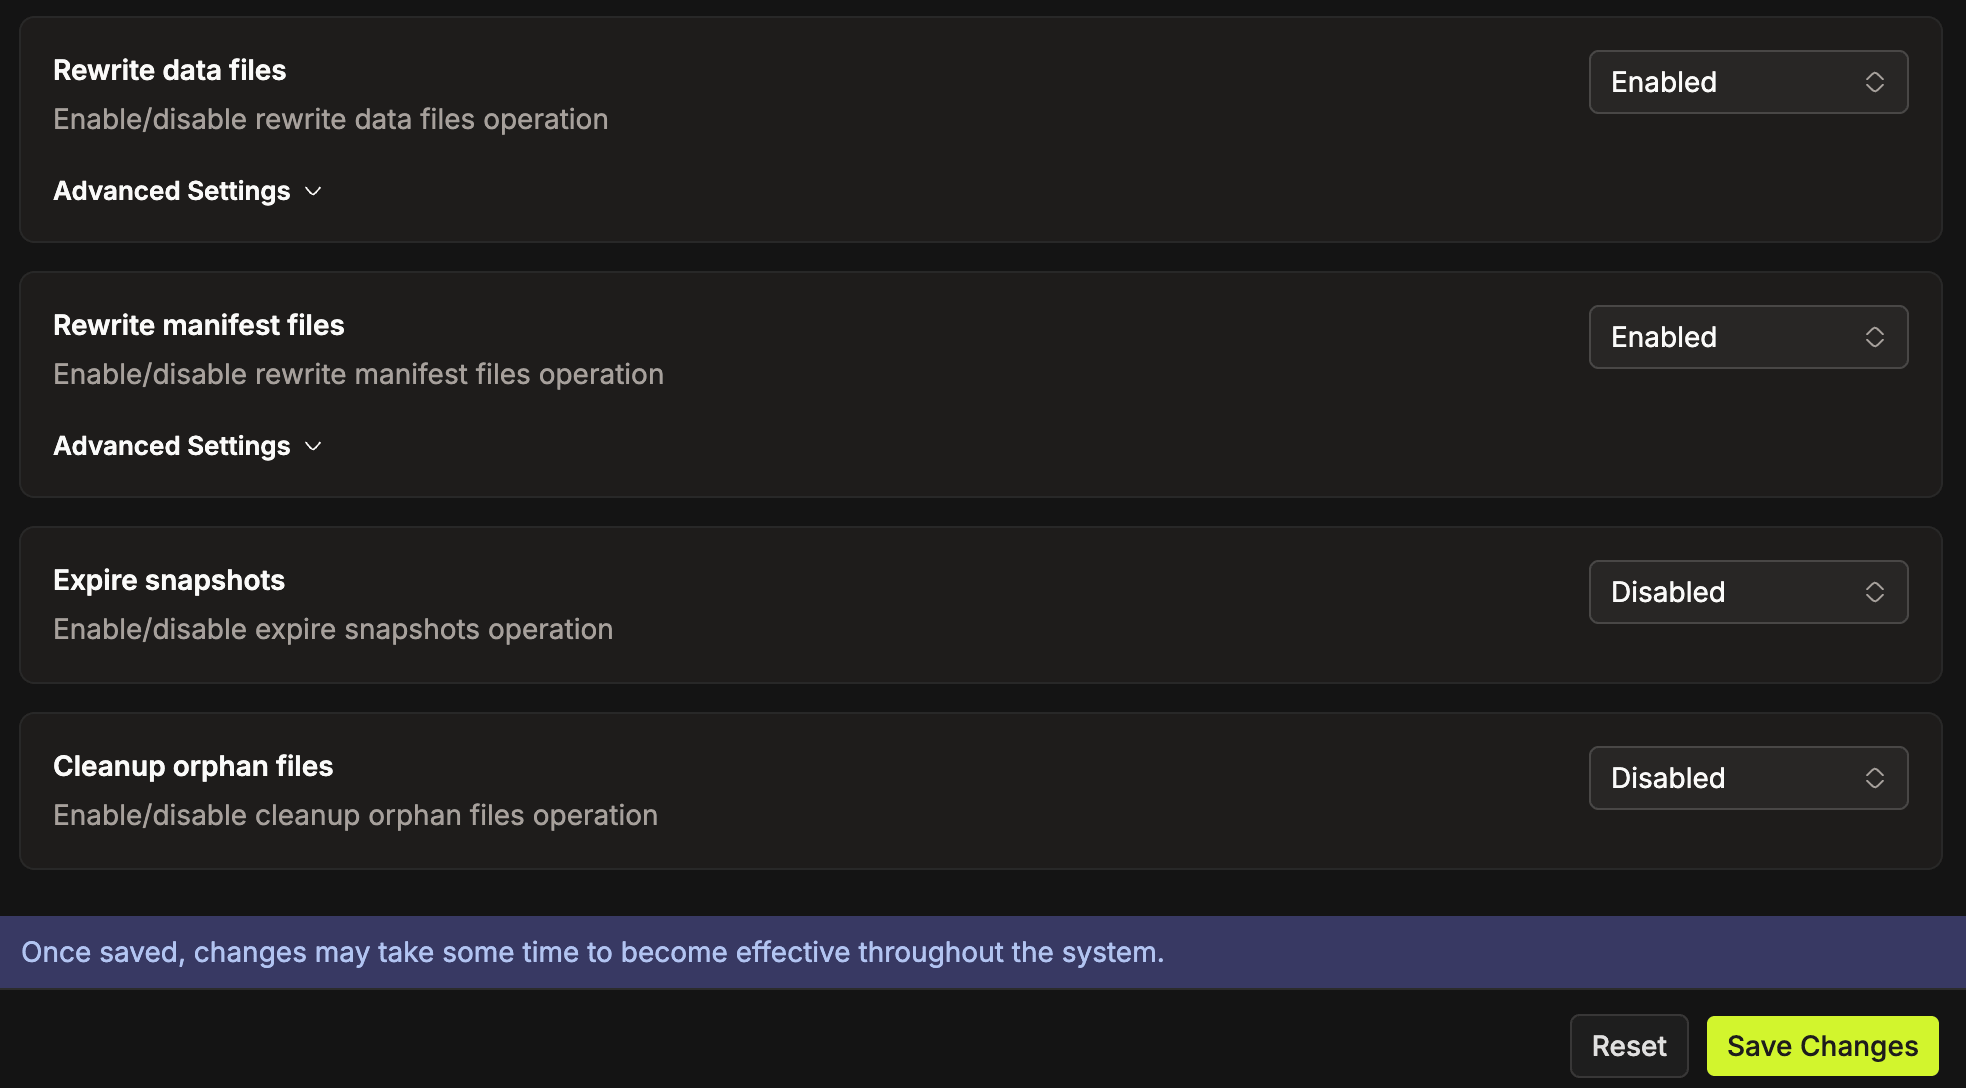
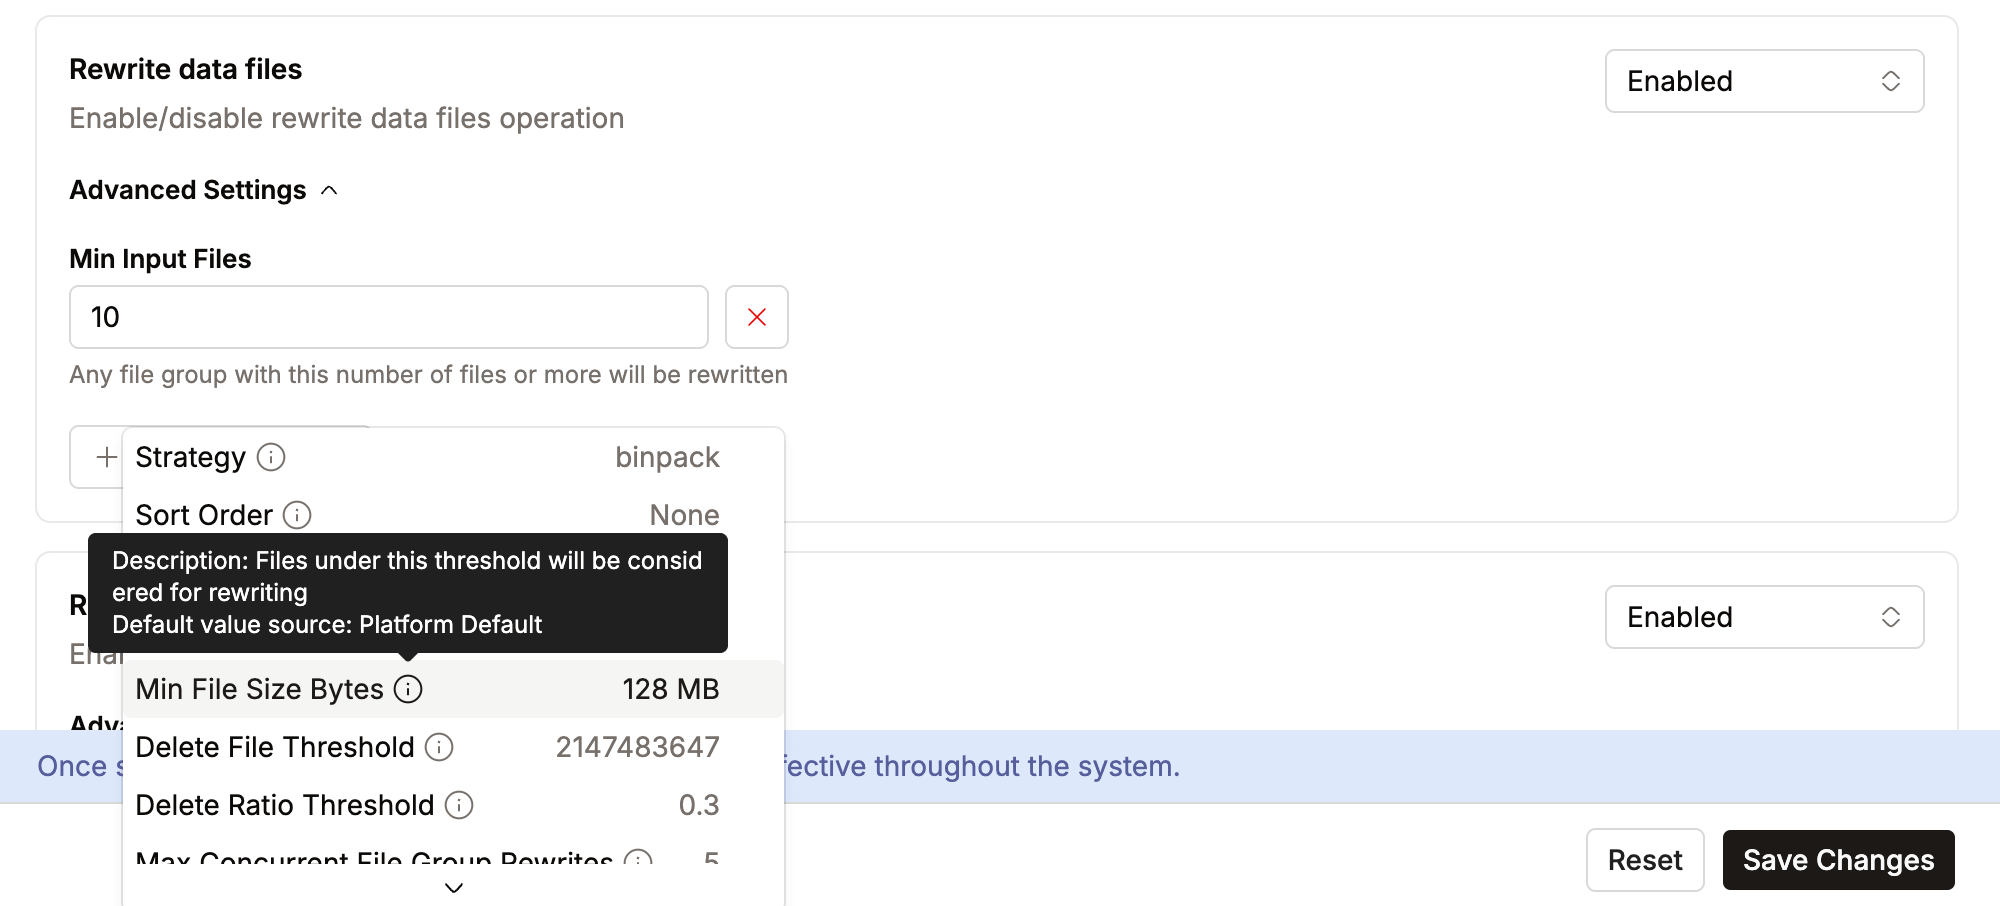
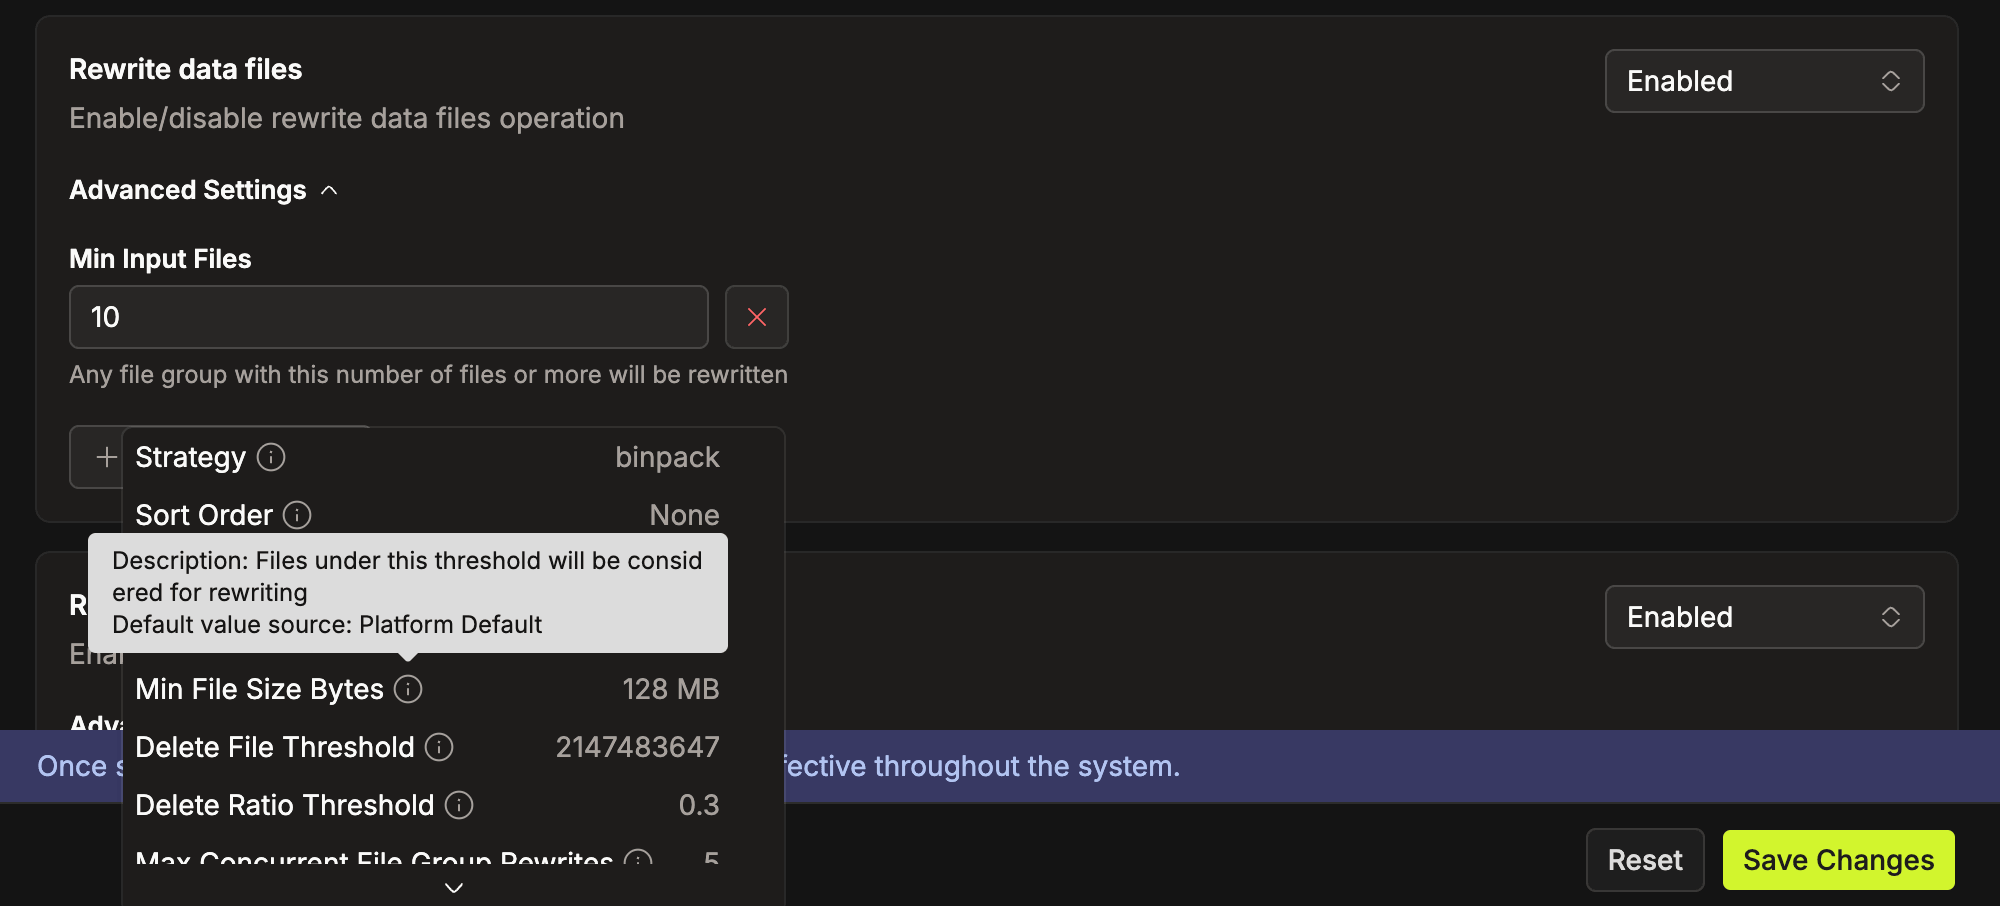
Equally important, we wanted maintenance decisions to be explainable. Every maintenance run records and displays the effective configuration. When multiple configurations are present, a clear precedence order is applied:
- IOMETE table properties — per-table overrides set through the IOMETE UI (highest priority)
- Iceberg table properties — native Iceberg properties on the table (e.g.,
write.target-file-size-bytes) - IOMETE catalog properties — catalog-wide defaults set through the IOMETE UI
- Iceberg catalog properties — native Iceberg properties on the catalog
- Platform defaults — built-in defaults applied when no other configuration is set (lowest priority)
Users should never have to guess. The effective configuration is always visible.
Keeping Defaults Sensible
The problem with configurability is that every exposed setting introduces a decision. Most teams enabling maintenance for the first time don't want to reason through compaction strategies, snapshot retention windows, or concurrency limits — they want their tables to stay healthy.
We ship sensible defaults for every maintenance operation out of the box. Compaction thresholds, snapshot expiration policies, and resource limits are pre-configured based on what works well for most workloads. Teams can enable maintenance and trust it is doing the right thing without touching a single setting.
Configuration becomes necessary only when a team's requirements diverge from the defaults — tighter retention for compliance, more aggressive compaction for a high-throughput streaming table, or a lower concurrency cap for a resource-constrained environment. Until then, the defaults handle it.
Building for Reliability and Scale
Maintenance operations are long-running and not immune to failures. Infrastructure interruptions, transient catalog issues, and workload spikes are realities of production.
To handle failures gracefully, we built in:
- Automatic retries — transient catalog errors are retried without operator intervention.
- Operation timeouts — stalled tasks are detected and terminated so they don't block the queue.
- Persistent task tracking — task state survives worker restarts, so in-progress work isn't lost or duplicated.
For scaling, workers can be added independently as table counts grow, and cooldown periods spread evaluation load over time to prevent catalog spikes.
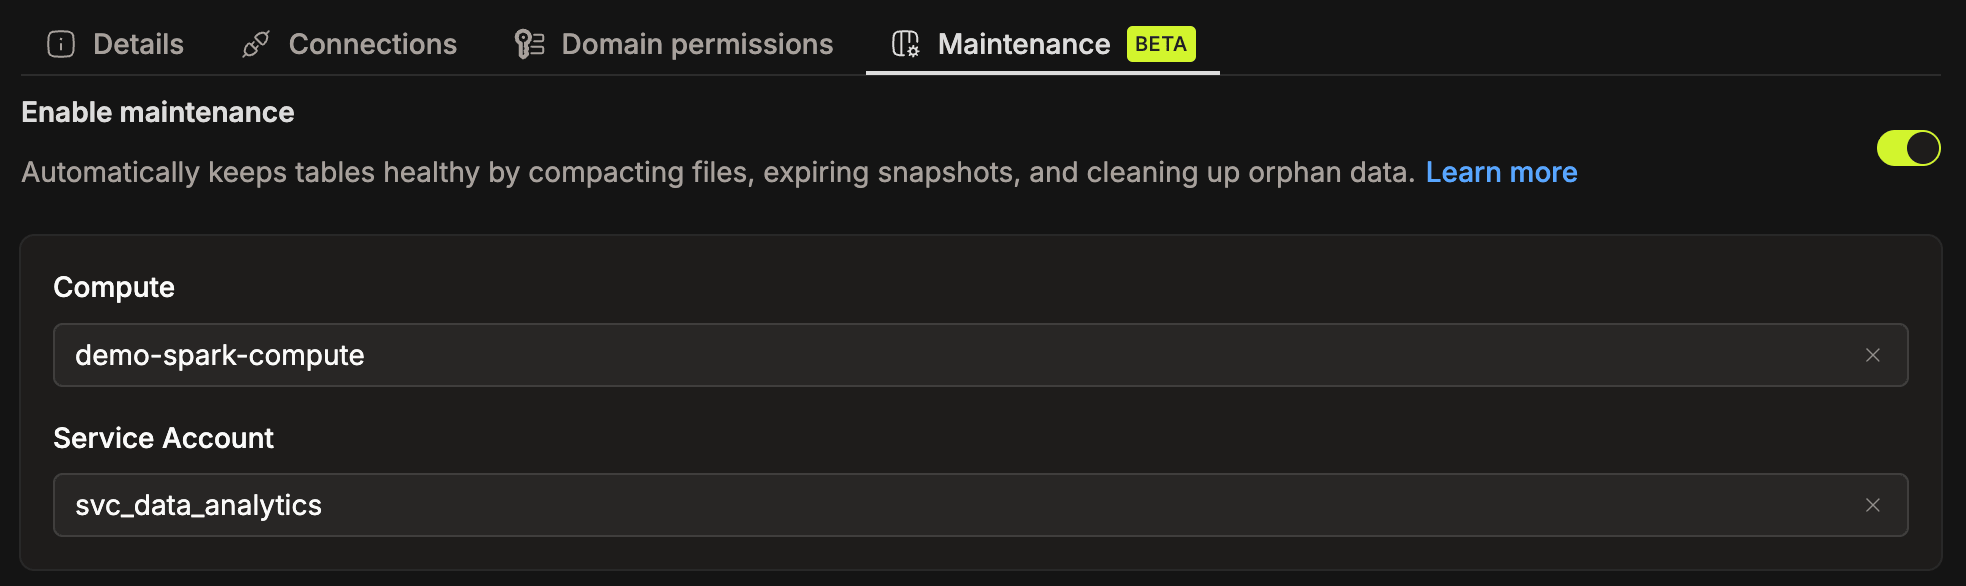
For catalogs with a large number of tables, the maintenance workload itself can be scaled by selecting a larger compute profile. This lets operators match the maintenance service's capacity to the size of the catalog it manages.
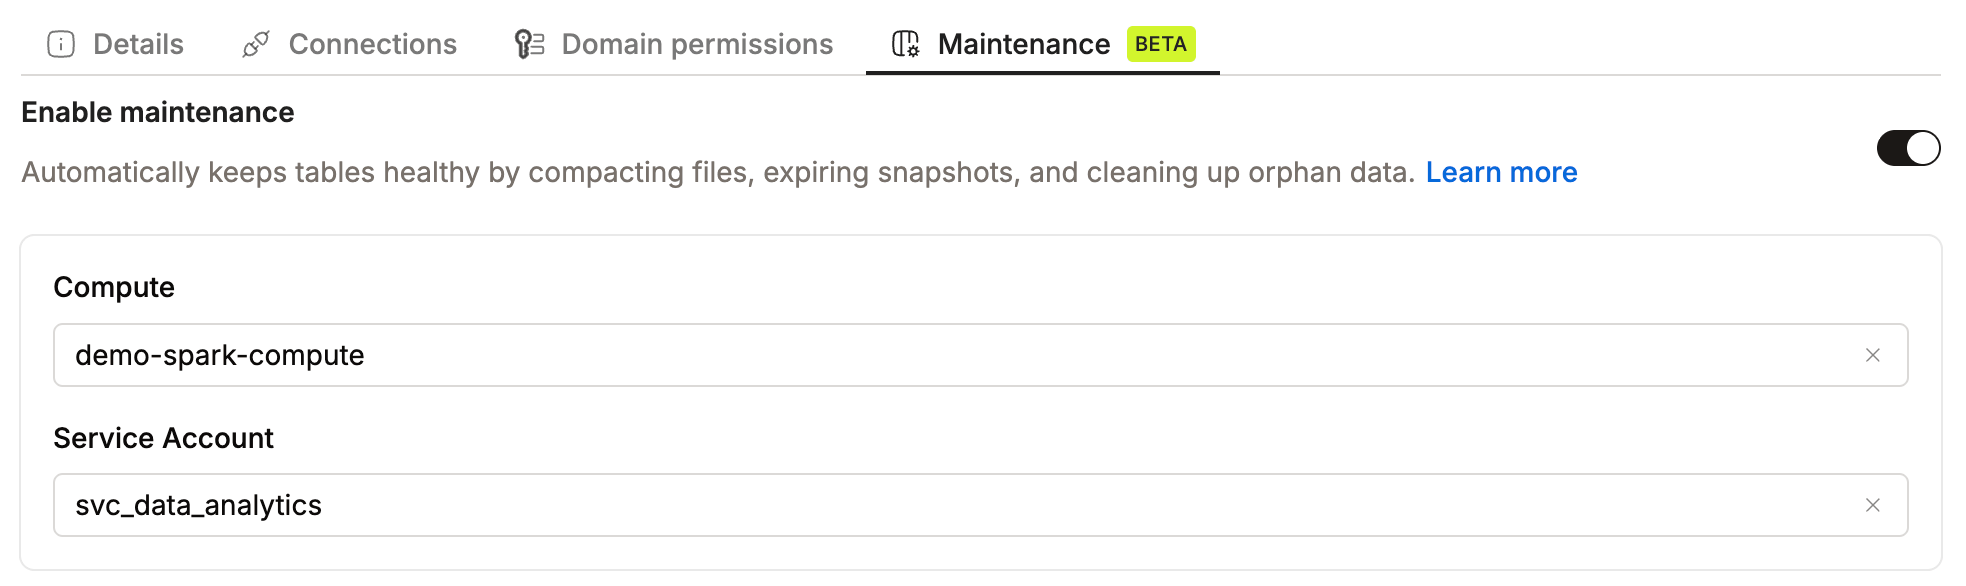
Together, these mechanisms help ensure that the maintenance platform remains resilient, scalable, and capable of operating continuously across large production environments. Failures should be the system's problem, not the operator's.


Lessons Learned
Table health metrics matter more than maintenance schedules. Cron-based schedules feel predictable and easy to reason about at first. But they treat every table the same regardless of whether maintenance is actually needed. Environments that shift to metric-driven evaluation trigger maintenance based on file counts, snapshot growth, and storage pressure. They consistently handle more tables with less wasted compute.
Automation without observability creates a different kind of risk. Automated maintenance that runs silently is hard to trust and harder to debug. Teams that cannot answer "did this table actually get healthier?" are flying blind. Observability is not a dashboard feature. It is what turns automation into something you can rely on rather than something you hope is working.
The goal is not perfect tables. It is predictable performance at acceptable cost. Chasing perfect compaction ratios or zero orphan files on every table is expensive and often unnecessary. The bar that actually matters is whether query performance is stable and storage costs are under control. Maintenance that achieves that consistently, at scale, is doing its job.
Conclusion
Most teams first encounter Iceberg maintenance as a set of operations to run: compact files, expire snapshots, clean up orphans. The tools are well-documented. The operations are straightforward.
What changes at scale is the context around those operations: who decides when to run them, how to prevent them from disrupting production workloads, how to know whether they actually worked, and how to manage all of that consistently across hundreds of tables without it becoming a full-time job.
That shift, from running maintenance operations to operating a maintenance system, is where most of the real complexity lives. The teams that navigate it well are not necessarily running better compaction algorithms. They are running better systems.
Resources & Further Reading
Research
- AutoComp: Automated Data Compaction for Log-Structured Tables in Data Lakes: LinkedIn's research on cost-aware, metric-driven compaction decisions — directly relevant to why schedule-based maintenance fails at scale
- Floe and Apache Polaris: Policy-Driven Table Maintenance: signal-based maintenance triggers over fixed schedules, the same principle behind this post's observability argument
IOMETE References
- Automated Table Maintenance on IOMETE: the feature this post describes, including setup and configuration.
- IOMETE Data Compaction Job: open-source Spark job for scheduled Iceberg compaction.