How We Built Automated Table Maintenance at IOMETE


The goal was simple: customers should not have to think about table maintenance. This is how we built that system, and the engineering decisions that shaped it.
This is Part 4 of our Apache Iceberg Table Maintenance series. Explore the full series:
- Part 1: The Hidden Debt in Your Lakehouse Tables
- Part 2: What Iceberg Gives You for Table Maintenance
- Part 3: The Iceberg Table Maintenance Landscape
- Part 4: How We Built Automated Table Maintenance
- Part 5: Running Iceberg Maintenance in Production
- Part 6: Why We Rebuilt Orphan File Cleanup from Scratch
We kept having the same conversation with customers. They would migrate from a platform like Snowflake, Databricks, Cloudera, or Dremio, create a few hundred Iceberg tables, and within weeks see queries slow down while storage costs creep up.
Most teams already had some maintenance in place, usually custom Spark jobs on a schedule. We had shipped a basic version too: a scheduled Data Compaction Job on our Spark scheduler. It helped, but it was not enough. Scheduled jobs were fragile, did not scale cleanly past a few dozen tables, and could not adapt to different write patterns. Iceberg gives you the maintenance primitives, but it leaves the operating model to you. A static cron job is a weak substitute for that operating model.
As we covered in Part 3, Snowflake, Databricks, AWS, Dremio, and Cloudera all run maintenance quietly in the background for their managed tables. Customers expected the same from IOMETE: tables that stay healthy without someone checking them every day.
So we built a system that can decide which tables need maintenance, when to run it, and how that work should be executed. This post walks through the decisions behind that system: what we tried, what we rejected, and the production tradeoffs that shaped the final design.
The Naive Approach and Why It Breaks
The simplest version of automated maintenance is a cron job around the four Spark procedures. Every few hours, it loops through your tables and runs rewrite_data_files, expire_snapshots, remove_orphan_files, and rewrite_manifests. For a small number of tables, that approach can work, but the trouble starts when the table count grows.
We started there ourselves, running the same kind of Spark jobs our customers had. It falls apart fast:
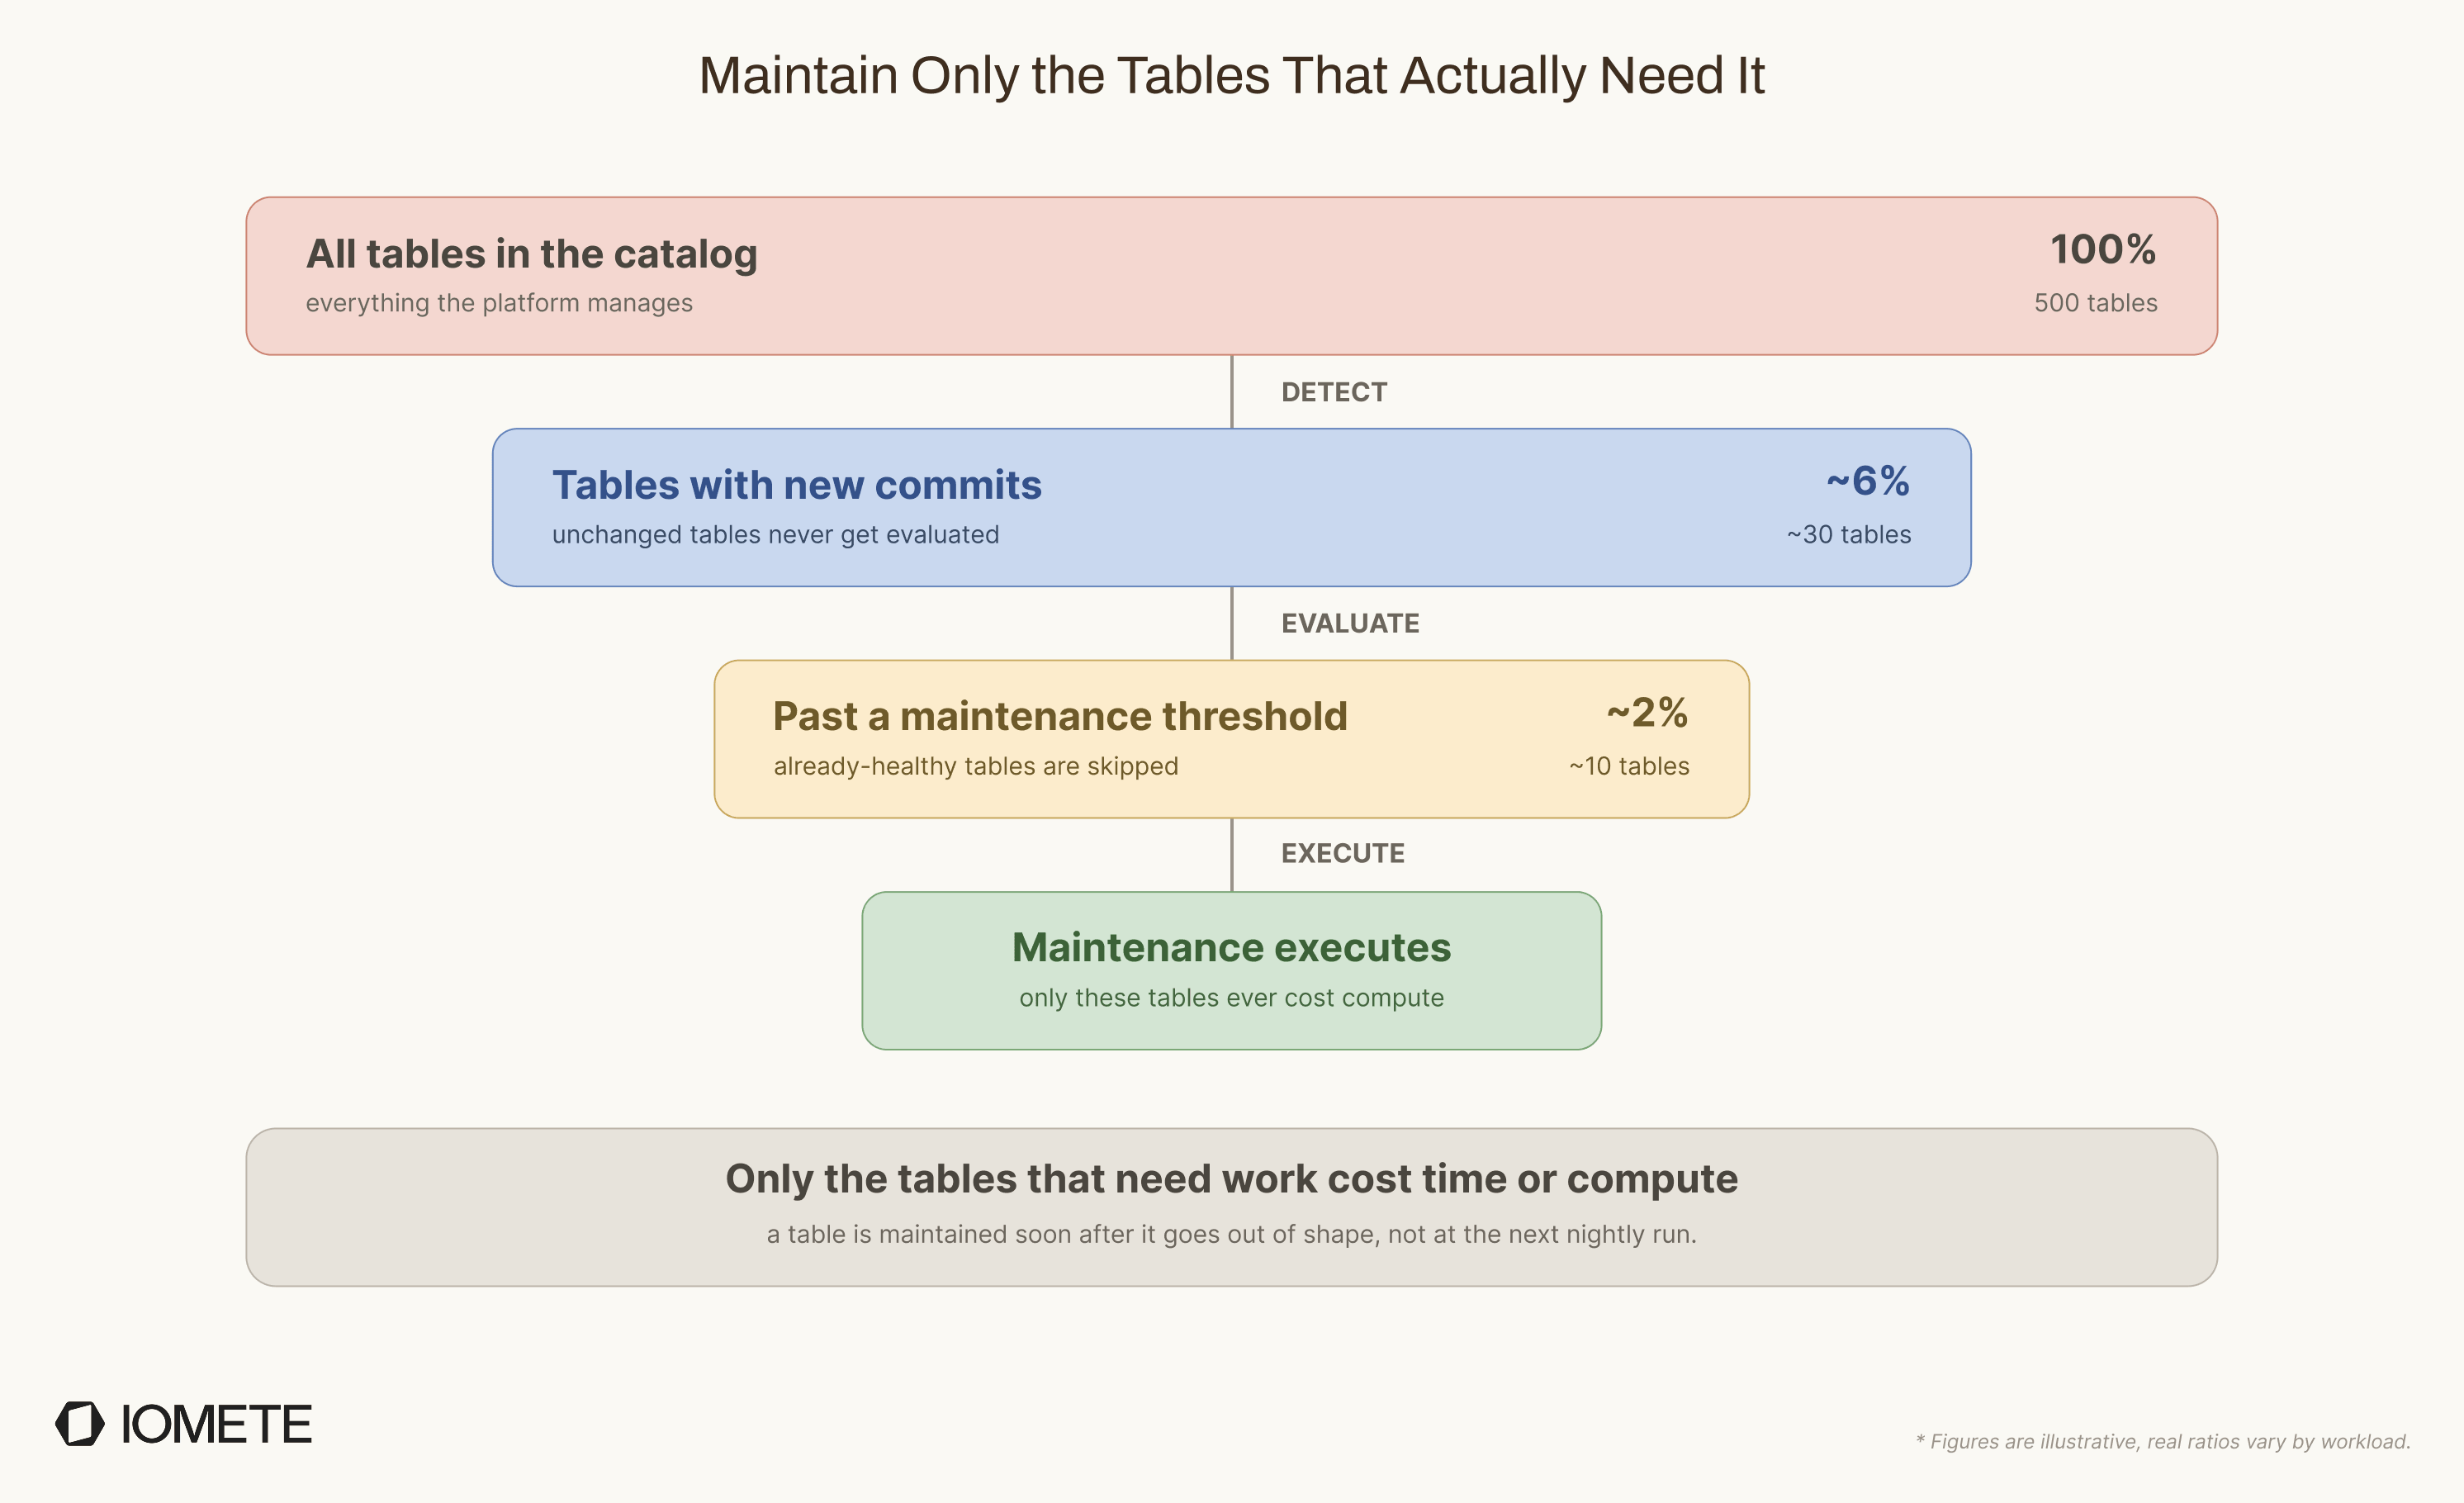
- A cron job doesn't know which tables changed: If only 30 out of 500 tables changed since the last cycle, it still checks all 500, causing hundreds of unnecessary metadata reads and manifest scans for tables that never moved.
- No schedule is right for streaming: A table with one commit per second creates 86,400 snapshots a day. By the time the nightly job runs, the table may already have too many small files.
- A cron job can overload the cluster: Compaction is expensive and if too many compaction jobs start together, they can take over Spark and slow down user queries. A cron job has no built-in way to reduce load.
- Not every operation needs a cluster: Snapshot expiration is lightweight metadata cleanup while compaction is heavy data rewriting. Running both the same way wastes compute.
- Maintenance always lags the writes: A table written heavily in the morning sits unoptimized until the nightly job runs. Queries stay slow all day, waiting on work that's scheduled hours away.
- Success is hard to measure: The job may complete, but that does not mean maintenance helped. Without run history and impact metrics, you only notice problems when queries slow down.
These problems compound. Once you move past 50 tables, the cron approach needs more and more orchestration logic: retries, throttling, locking, history, configuration, and alerts. At that point you have built a maintenance service anyway, just a bad one.
Build vs. Adopt: Evaluating Amoro
Once we knew a cron loop would not be enough, the next question was whether to build the service ourselves or adopt one. We covered Amoro's capabilities and positioning in the alternatives landscape post; this section focuses on our engineering evaluation.
Before building from scratch, we evaluated Apache Amoro. It already supports self-optimizing tables with automatic compaction, snapshot expiration, and orphan cleanup, and it is used at scale by companies like NetEase and ByteDance. On paper, it looked like a strong fit.
We spent several weeks testing Amoro in depth. Its self-optimization pipeline is well designed: detect, evaluate, plan, execute, and commit. It also supports tiered optimization, starting with lightweight small-file compaction and moving up to larger merges or full partition rewrites when needed. Amoro's custom compaction logic reportedly benchmarks at 10x the efficiency of Spark's native rewrite_data_files.
Where it fell short for us:
- Heavy metadata fetches: For every table with optimization enabled, Amoro calls
loadTable()on the REST catalog, downloads the metadata JSON, and reads manifest files on every planning cycle. By default, that happens every minute. At our scale, this would put significant pressure on the REST catalog and object storage. We tested ways to reduce the load, including longer cache TTLs and bulk catalog calls, but each option came with tradeoffs. - Limited configuration: Amoro supports configuration at the catalog and table level, but not at the database level, which we needed. Dynamic SQL filters such as
CURRENT_DATEandINTERVALalso do not work in optimization filters. Amoro also focuses solely on data file compaction and does not support manifest rewriting. - Weak observability: Snapshot expiration, orphan cleanup, and dangling delete file cleanup can run, but they do not produce run-level history. Important metrics are computed internally and mostly show up in logs. For a customer-facing feature, we needed clear history and metrics for every operation.
- Tight coupling and security debt: Amoro's architecture is tied to mixed-Iceberg logic, a format specific to its origin at NetEase. Removing that logic would mean forking and maintaining a large part of the codebase. The Docker image also had security issues we would need to fix before production use.
We concluded that Amoro was a strong foundation, but not a drop-in fit for us. Adapting it would take roughly the same effort as building a focused system ourselves, while also leaving us with the long-term cost of maintaining a fork.
So we chose to build in-house, while keeping the door open to reuse specific parts of Amoro's logic where they made sense.
The Architecture at a Glance
Before we designed anything, we agreed on the core idea: do only the work that is needed, and do it as cheaply as possible. That gave us three rules:
- Skip tables that have not changed.
- Skip tables that are already healthy.
- Never let maintenance overload the cluster or drive up costs.
The architecture follows directly from those rules.
The result is a single pipeline with three phases: detect, evaluate, and execute. Each phase filters out unnecessary work before passing the rest to the next phase, and all three share the same state store.
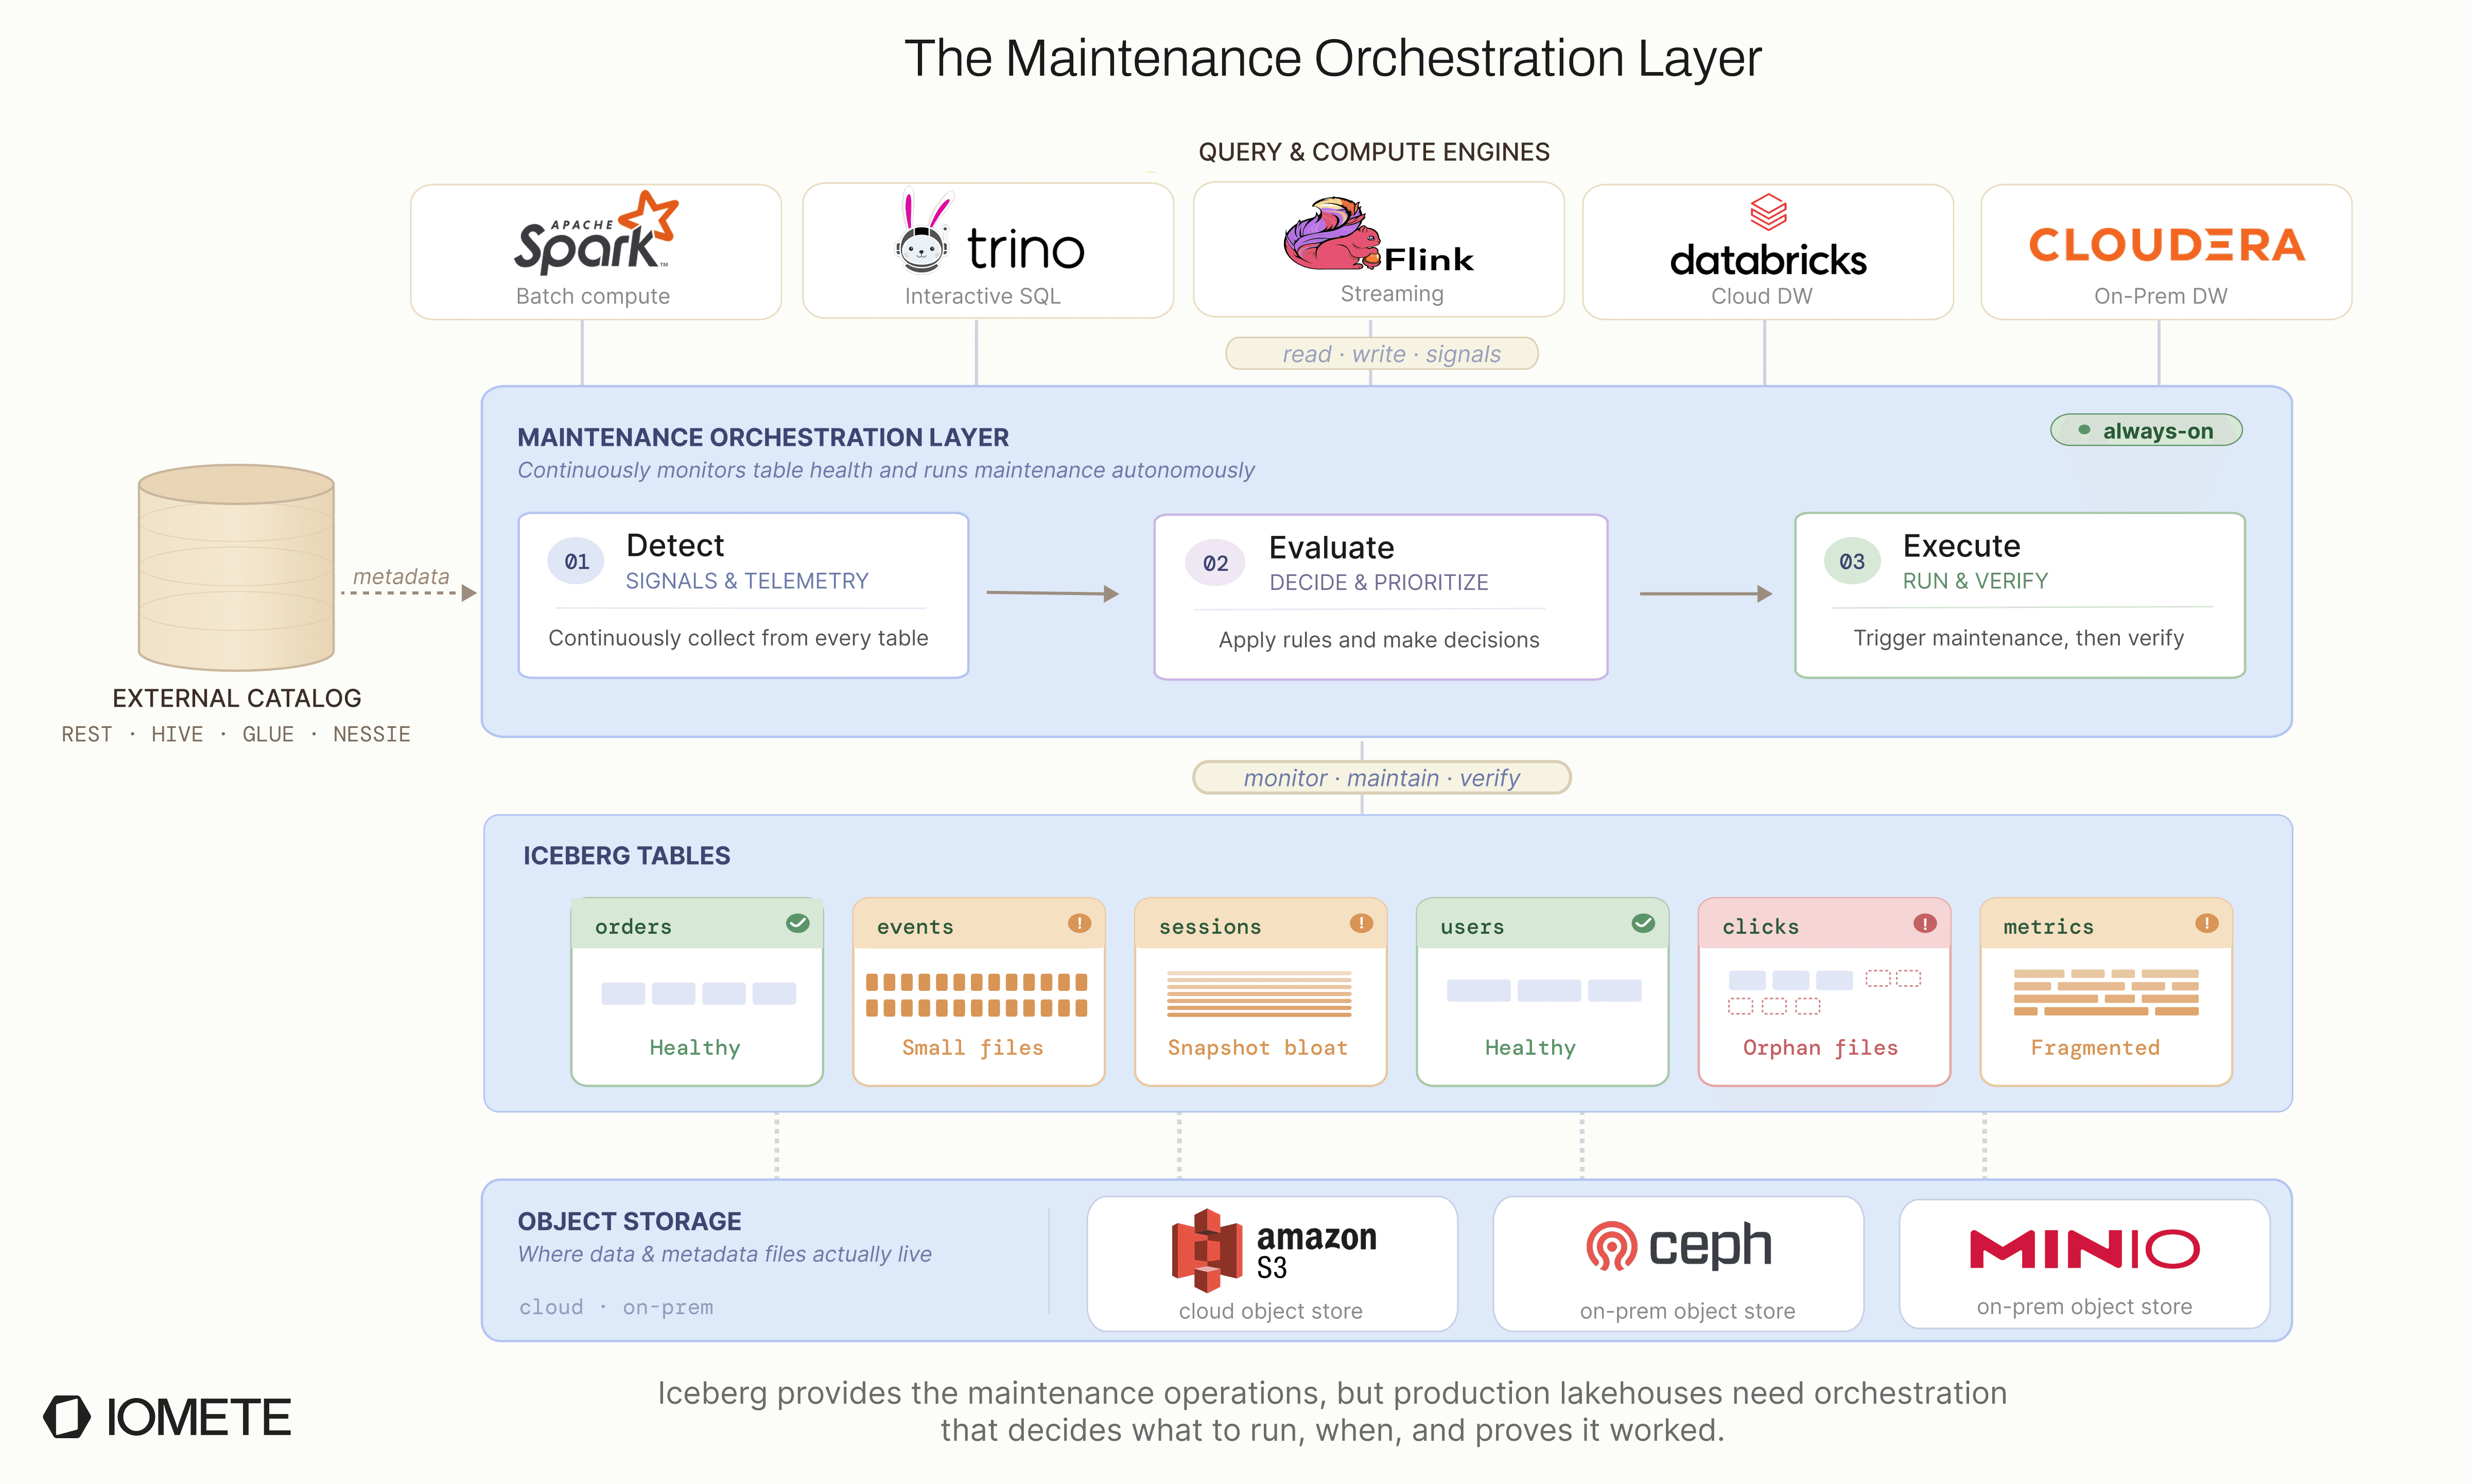
The service runs on Kubernetes and uses PostgreSQL to track operational state. Older run history is periodically archived to Iceberg tables, keeping the operational database lean while maintaining a complete long-term audit trail.
The Automated Maintenance Pipeline
The core of the system is a three-phase pipeline. Instead of running every operation on a fixed schedule, each phase answers one question and passes only the necessary work forward:
- Detect: has anything changed?
- Evaluate: does this table need work?
- Execute: run the operation on the right execution path.
Detect
Detection answers the first question: has anything changed? Every few minutes, the service asks the catalog for tables whose metadata changed since the last detection cycle. If a table has not changed, we skip it entirely. No manifest parsing, no table-level evaluation, and no maintenance decision.
We considered two ways to detect changed tables:
| Approach | How it works | Verdict |
|---|---|---|
| Iceberg Commit Report | Spark writes commit events into a partitioned Iceberg event table; the service scans it for tables changed since the last check. | Works, but requires a table scan against the event log every cycle. |
| Catalog-based | The REST catalog already tracks each table's last metadata update, so one paginated API call can return tables modified after a timestamp. | Lightweight. No table scan or event parsing, just a metadata timestamp check. |
We started with the Iceberg commit report approach, then moved to catalog-based detection as the default. It is lighter, avoids coupling detection to a separate event table, and scales better with pagination.
Evaluate
A fixed schedule does not understand table state. A table written once a day does not need hourly checks. A streaming table with 10,000 commits per hour may need attention much sooner.
The evaluate phase answers the next question: does this table actually need maintenance? Instead of relying on time, it checks table metrics against configurable thresholds.
Each operation has its own trigger:
| Operation | Sample Triggers |
|---|---|
| Compaction | Average file size is well below the target, or the delete-file ratio exceeds a configurable threshold. |
| Manifest rewriting | Manifest count is disproportionately high relative to data file count, or manifest overhead is large relative to table size. |
| Snapshot expiration | Old snapshots exist beyond the retention period, for example 5 days, and the table still keeps the minimum required snapshots. |
| Orphan cleanup | No metadata signal to check (finding orphans needs a full storage scan), so it skips evaluation and runs on a fixed schedule instead, weekly and configurable. |
Compaction is the most expensive to evaluate. To decide whether it is needed, we compute average file size per partition by reading manifest files. That costs more IO than reading commit events, but it gives us exact per-file metrics instead of rough estimates.
The result is simple: quiet tables are left alone, active tables are checked more often, and healthy tables do not trigger unnecessary work. The broader rule is that if you can cheaply check whether work is needed, you should. Fixed schedules are useful only when the check itself is expensive, as with orphan cleanup.
Execute
The execute phase runs the maintenance operation. The key point is that not every operation needs the same execution path.
At first, we considered running all four operations as Spark SQL jobs. That would have been simpler: one path for everything. But it would also waste compute, because the operations have very different resource needs.
Running snapshot expiration through Spark would mean starting a cluster, or keeping one warm, for work that is mostly metadata and storage calls. That did not make sense. So we chose a split model: heavy data rewrite operations run on Spark, while lightweight metadata operations run inside the maintenance service.
The tradeoff is more code to maintain, but the benefits are worth it. Metadata operations do not wait for Spark capacity, and we do not spend compute on work that does not need it.
| Operation | How it runs | Why |
|---|---|---|
| Compaction & Manifest rewriting | Spark SQL job through our internal SQL service | These operations scan and rewrite data files, so they benefit from distributed Spark. |
| Snapshot expiration | Inside the maintenance service, using the Iceberg Java API | This is metadata work. It does not rewrite data, shuffle rows, or need a Spark cluster. |
| Orphan cleanup | Inside the maintenance service, using a custom routine | This is mostly storage and metadata work. The stock procedure requires Spark and did not have the safety checks we wanted. |
Orphan cleanup needed extra care because it deletes files. That makes it the easiest operation to get wrong. Iceberg's built-in procedure runs on Spark and did not include the safety checks we wanted, so we rebuilt it from scratch. How we did that, without Spark and with all the guardrails, is Part 6 of this series.
Each phase runs as its own scheduler on a short loop. Work moves from detect to evaluate to execute through the shared state store. End to end, the decision path looks like this:
Runtime Controls
The pipeline decides what should run. Runtime controls decide how aggressively it runs, so maintenance does not overwhelm the cluster or the tables it is maintaining.
Concurrency Limits
Many tables can enter the pipeline in the same cycle. For example, after a nightly load, half the tables in a catalog may be flagged at once. Most of them may need compaction, which is the heaviest operation we run.
If all of those jobs started together, Spark could run out of capacity or spend too much of it on maintenance while user queries wait. To prevent that, we limit how many operations can run at the same time.
Each operation type has its own configurable concurrency limit:
- Compaction gets the lowest limit because it uses the most compute.
- Orphan cleanup is also limited because it scans storage, and too many scans can overload the object storage API layer.
- SQL queries per cluster are capped overall, so maintenance never monopolizes Spark at the expense of user queries.
- Non-Spark operations (snapshot expiration, orphan cleanup) have their own separate limits, since they run on the maintenance service and don't compete for Spark resources.
In V1, these limits are static. Operators set them based on cluster capacity. Later, we want the system to adjust concurrency automatically based on table count, table size, cluster load, and the operations waiting to run.
Cooldowns
After an operation runs successfully on a table, the same table and operation cannot run again until its cooldown period ends.
Cooldowns are important for frequently written tables. A table with constant writes always has new commits. Without a cooldown, the detect-evaluate-execute loop could pick it up again as soon as the previous run finishes, causing compaction to run back-to-back. That wastes compute because the newest files usually do not add up to enough work yet. It also increases the chance of conflicts with active writes.
We use cooldowns in two places:
- The evaluation cooldown stops us from scanning the same table metadata too often.
- The execution cooldown ensures heavy operations run only at safe intervals.
The tradeoff is that a table may sometimes need maintenance again before the cooldown ends, for example after a large batch load. In those cases, operators can use a manual trigger.
Configuration Hierarchy
Maintenance settings need to work at different levels. Some teams want one default policy for a whole catalog. Others need different thresholds or retention rules for specific tables.
To support both, configuration resolves from the most specific level to the least specific:
- Table-level config: per-table settings, highest priority
- Catalog-level config: defaults for all tables in that catalog
- Platform defaults: built-in IOMETE defaults, used as the final fallback
Each level inherits from the one below it. For example, if you set snapshot retention at the catalog level, every table in that catalog uses it unless the table has its own override.
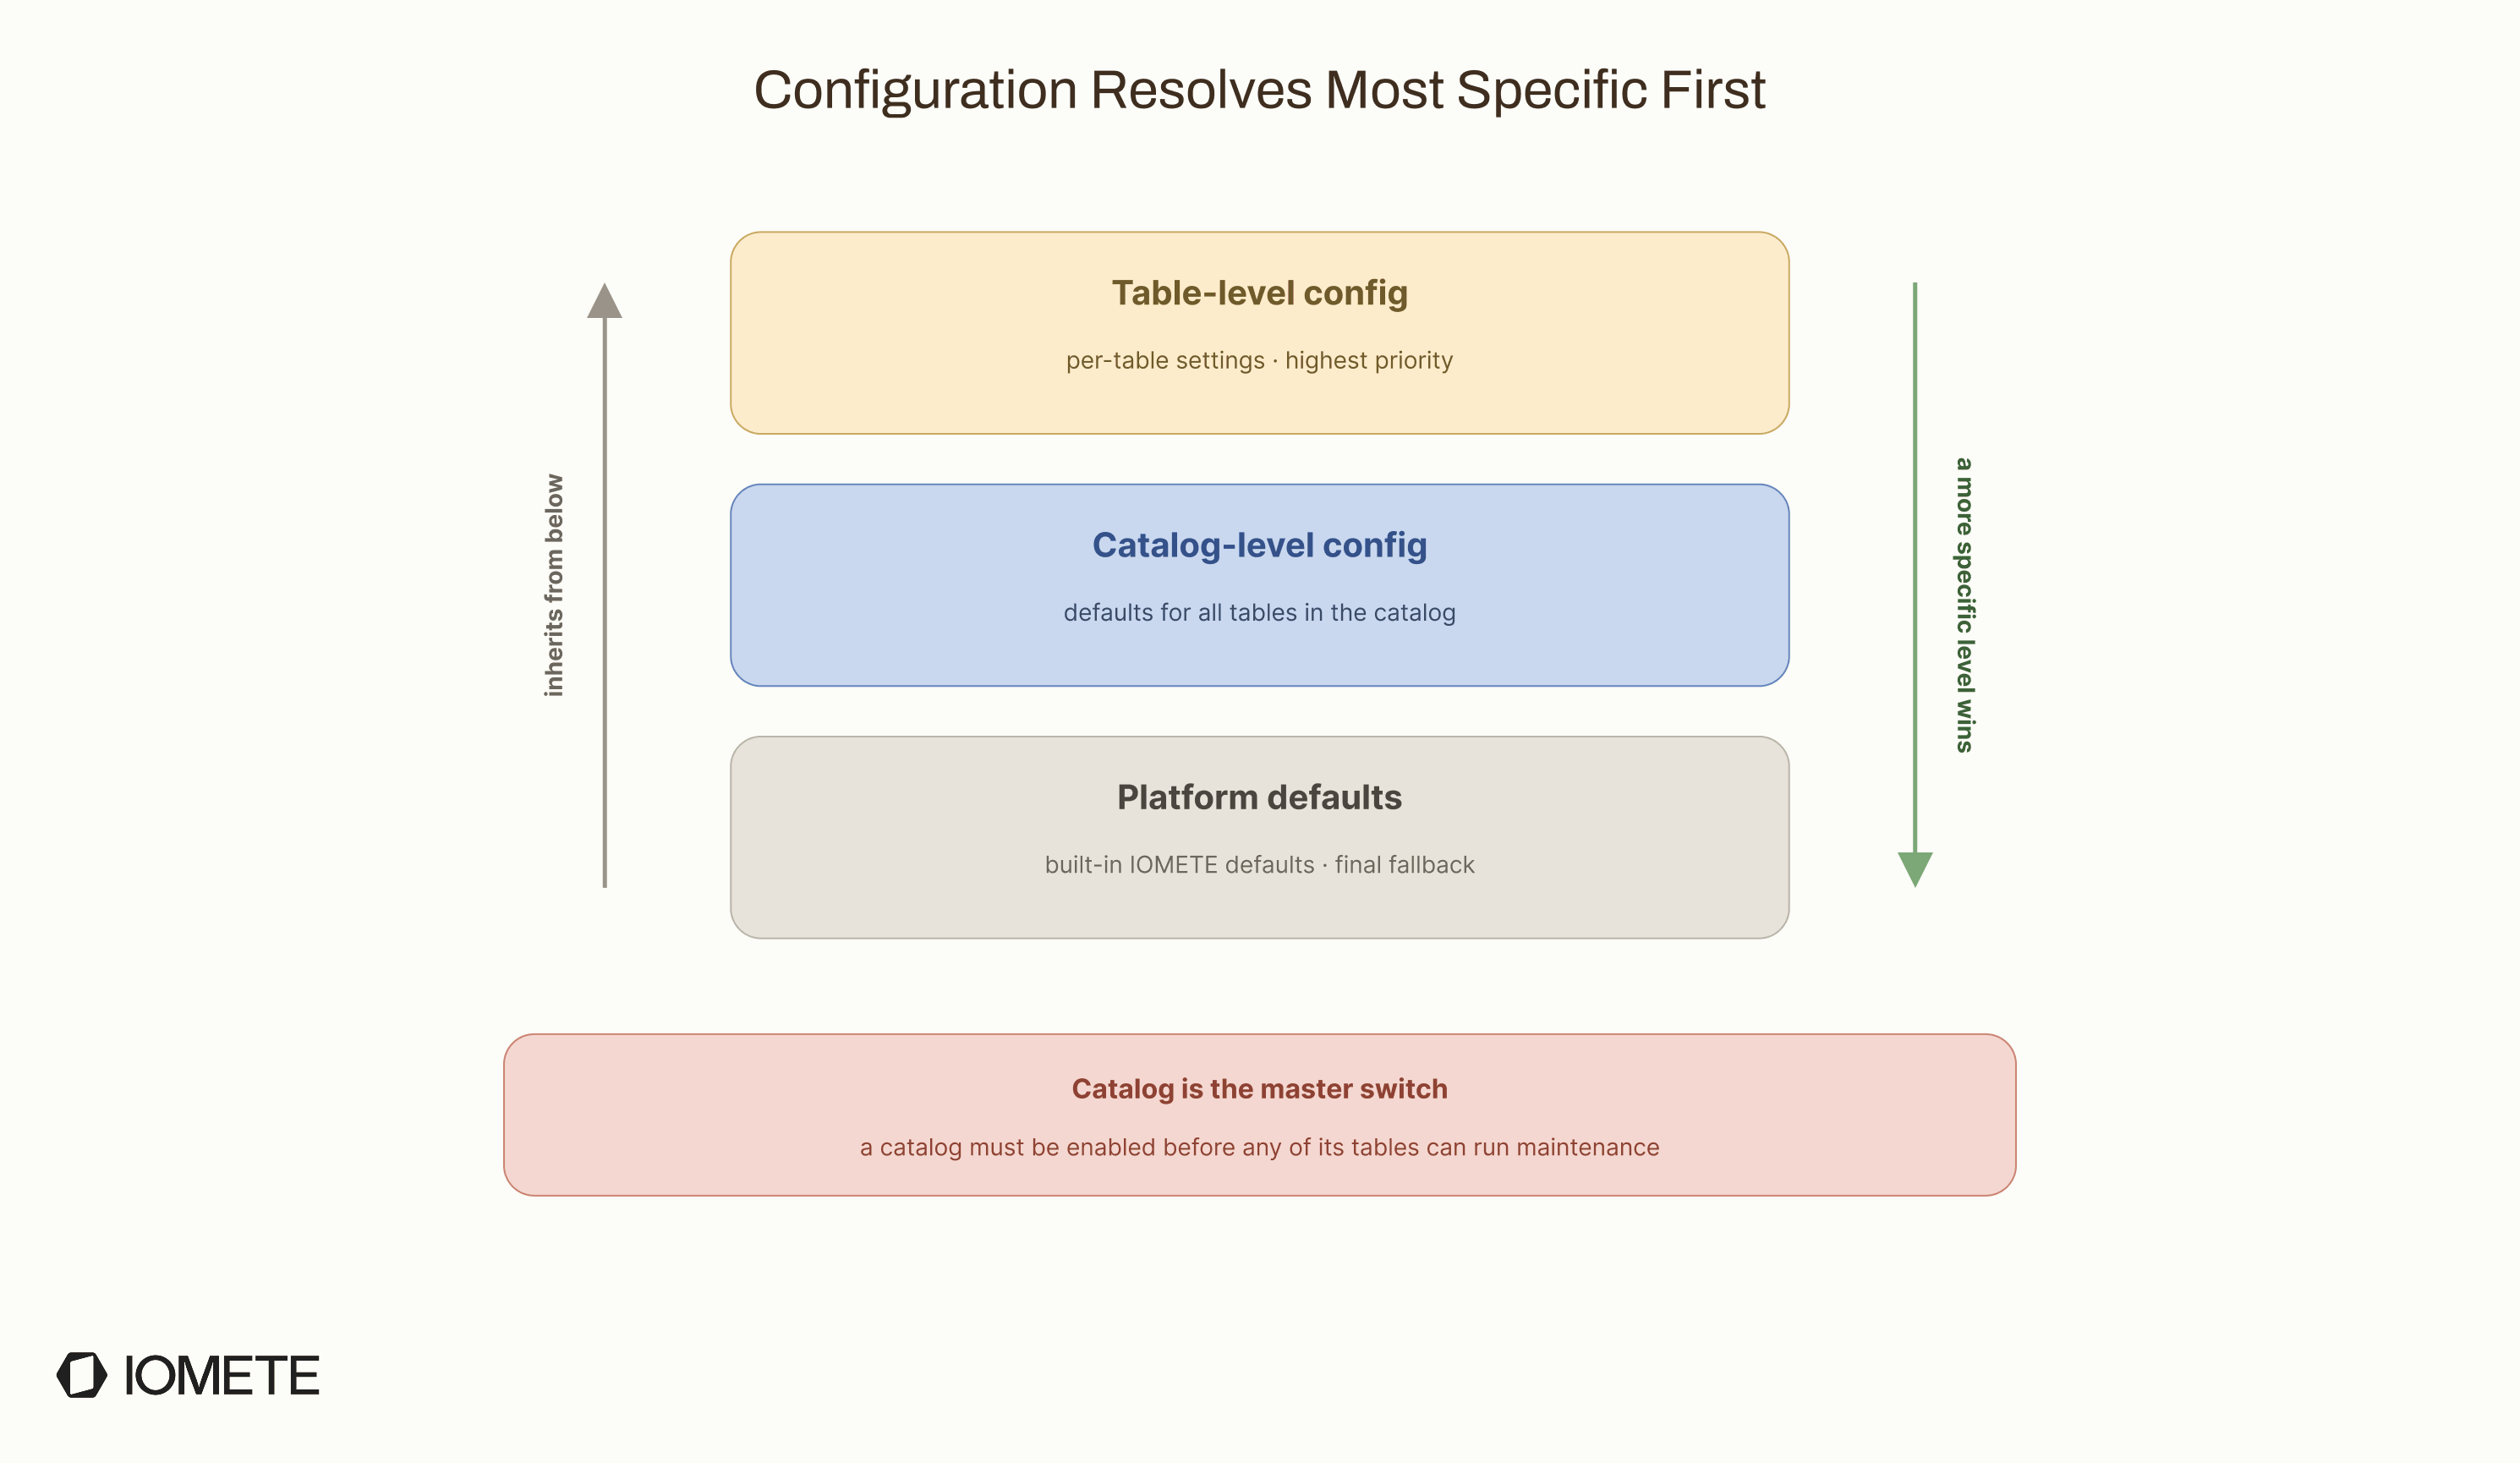
One gap remains: there is no database-level configuration yet. If you have 200 tables across 10 databases and want different retention policies per database, you currently need to configure those tables individually. Database-level inheritance is on the roadmap for a later version.
The Road Ahead
V1 is intentionally focused. It solves the core automation problem, but there are several areas we want to improve next:
- Priority-based scheduling: Today, all tables are treated equally. Under heavy load, a critical customer-facing table gets the same priority as an internal staging table. We want scheduling to account for query frequency, table importance, and usage patterns.
- Automatic partition awareness: Compacting a partition that is still receiving writes can cause commit conflicts. For now, users avoid this with WHERE filters that exclude hot partitions, for example
event_date < '2026-01-01'. We want the system to detect active partitions itself, skip them, and compact only the partitions that are safe to rewrite. - Beyond polling: Detection currently runs on a fixed polling loop. We want maintenance to react faster, for example when a large batch job finishes or when a streaming table crosses a threshold.
- Query-performance metrics: We track file counts, storage savings, and operation duration, but not the direct impact on query performance yet. Showing that compaction reduced average query time by 40% is more useful than only showing fewer files.
The main lesson is that table maintenance is not one job. It is a control system. The hard part is not calling rewrite_data_files; it is deciding when the call is worth making, how much pressure it will put on the platform, and whether the table is healthier afterward.
That is the difference between scheduled maintenance and automated maintenance. Scheduled maintenance runs because the clock says so. Automated maintenance runs because the table state says it should.
Resources & Further Reading
- AutoComp: Automated Data Compaction for Log-Structured Tables in Data Lakes: LinkedIn's research on cost-aware, automated compaction for Iceberg, Delta Lake, and Hudi.
- Floe and Apache Polaris: Policy-Driven Table Maintenance: signal-based maintenance policies for Apache Iceberg.
- Compaction in Apache Iceberg: Fine-Tuning Your Data Files: a deeper look at bin-pack and sort compaction strategies.
- Maintaining Tables by Using Compaction: AWS guidance on compaction scheduling and file sizing.
- Partition-Aware Compaction: A Fail-Safe Strategy for Streaming Data Lakes: using partition filters to reduce conflicts with streaming writes.
- Manage Concurrent Write Conflicts in Iceberg on AWS Glue: handling commit conflicts between maintenance and write workloads.
- Apache Amoro: self-optimizing Iceberg tables with continuous monitoring. See also the Apache Amoro GitHub repository.
IOMETE References
- Automated Table Maintenance on IOMETE: the feature this post describes, including setup and configuration.
- IOMETE Data Compaction Job: open-source Spark job for scheduled Iceberg compaction.