Get Started with IOMETE Spark Connect

Deep dive into the world of data analytics using IOMETE Spark Connect with PySpark in PyCharm! This concise guide will walk you through the process of setting up a Python project, installing the necessary dependencies, connecting to a Spark Connect cluster, and conducting exploratory data analysis (EDA) on social media data. With practical examples and step-by-step instructions, you'll be well-equipped to unlock valuable insights using PySpark and Spark Connect.
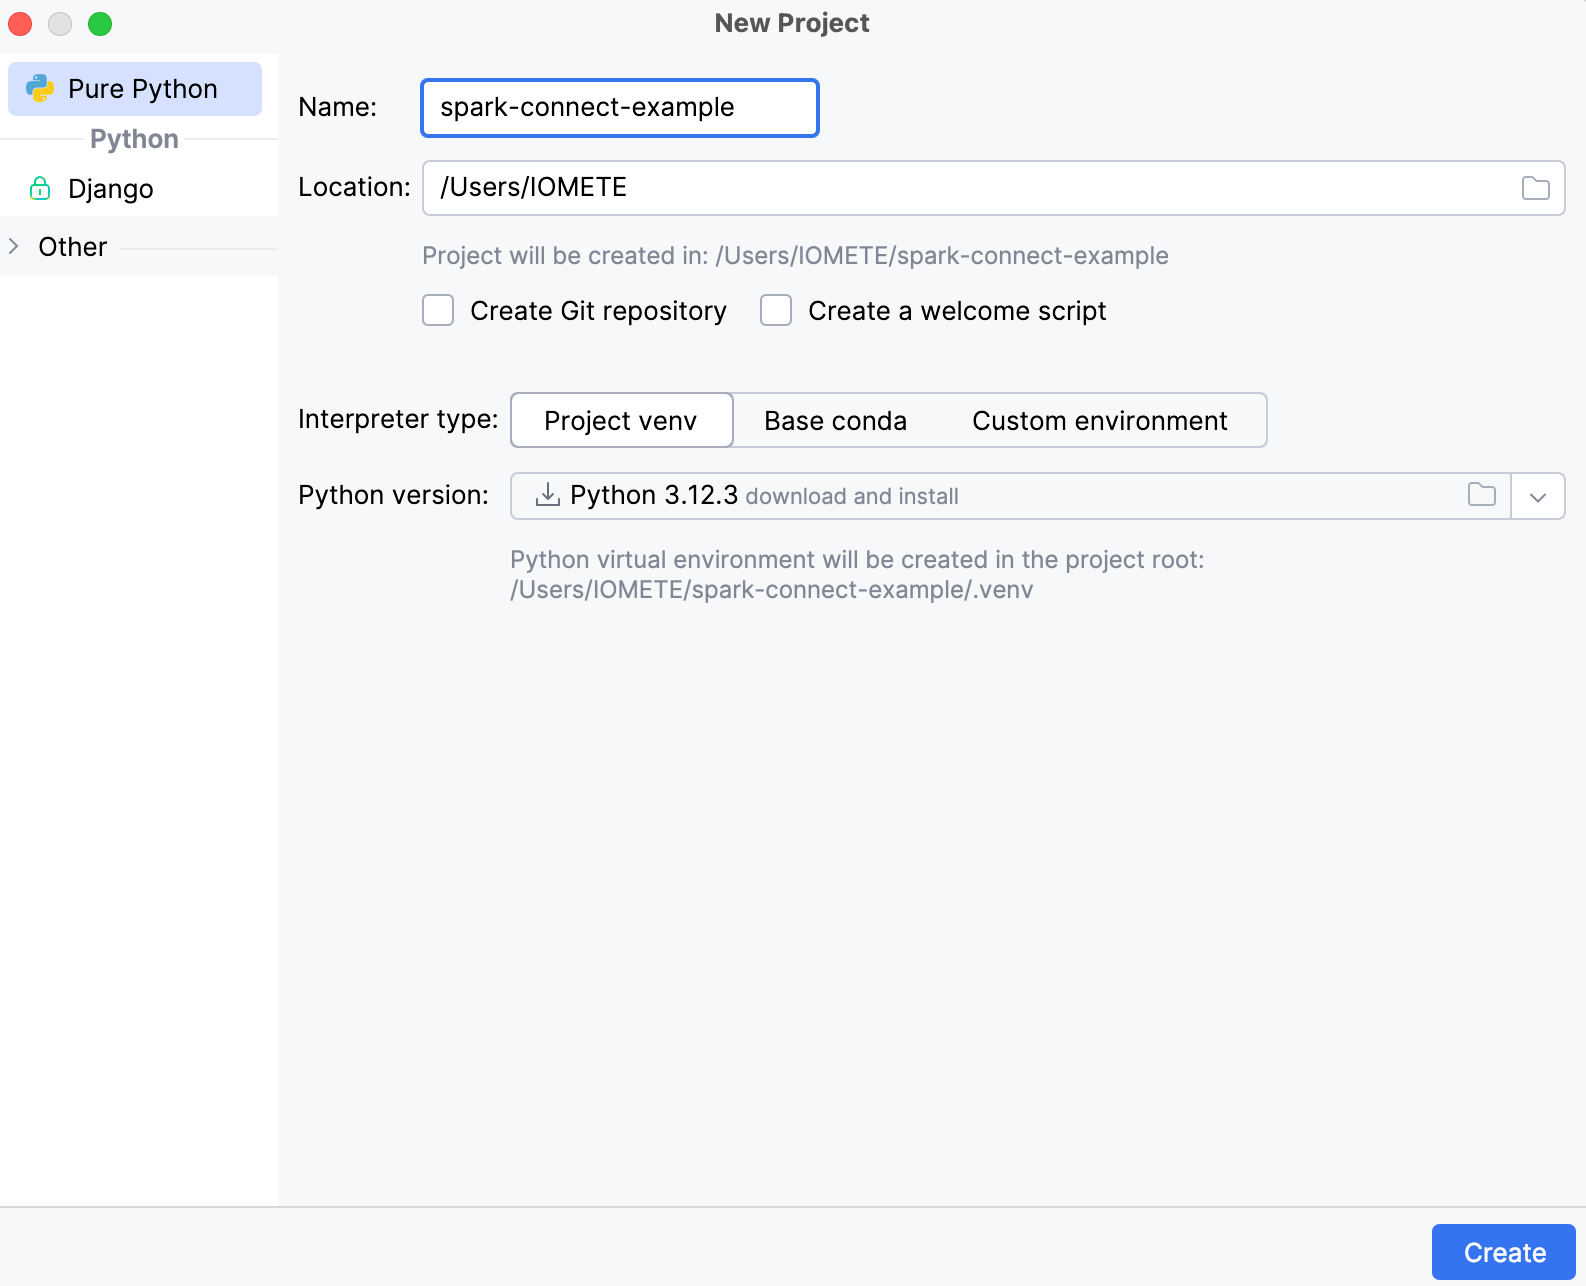
Create a Python project
- File → New Project
- Use the latest version of Python.
- Create
example.pyPython file - Right-click on project name → New → Python File
Install dependencies
-
Create
requirements.txtfile - Right-click on project name → New → File -
Add these dependencies to the file.
# PySpark dependenciespyspark==3.5.3pandas==2.2.3pyarrow==18.0.0# Spark Connect dependenciesgrpcio==1.67.1googleapis-common-protos==1.65.0grpcio-status==1.67.1# Only required for python version >= 3.12setuptools==75.3.0 -
Install dependencies by running
pip install -r requirements.txt
Connect to Spark Connect cluster
-
Create a Spark Connect cluster by following the steps mentioned here.
-
Open
example.pyand paste this code.from pyspark.sql import SparkSessionaccess_token = '<access-token>'try:spark = SparkSession.builder.remote(f"<spark-connect-endpoint>").getOrCreate()print("Spark is running. Version:", spark.version)except Exception as e:print("Spark is not running:", e) -
Update the file
- Get the access token by following the steps mentioned here and replace <access-token> with it.
- Copy the Spark Connect endpoint from the Connections section and replace <spark-connect-endpoint> with it.
-
Validate PySpark installation
- Run from the command line with python
example.py - Or run from the IDE by clicking on the play button.
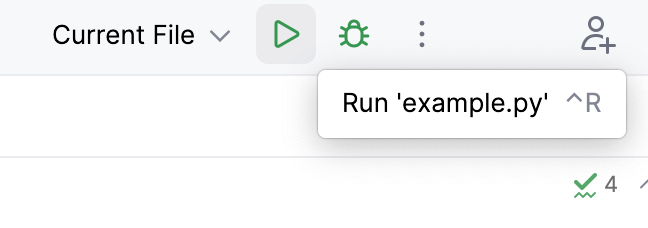
- Run from the command line with python
-
You should see a similar output on the console →
Spark is running. Version: 3.5.3-IOMETE
Perform EDA
This example walks through a common data analysis workflow for social media data. By creating a sample Twitter dataset and performing hashtag analysis, sentiment analysis, and user activity analysis, users will learn how to extract valuable insights from real-world social media data using Apache Spark. You can checkout the complete code here.
-
Open
example.pyand import the required dependencies.from pyspark.sql import Rowfrom pyspark.sql.functions import when, col, explode, split -
Define dataset.
data = [Row(tweet_id="t001", user_id="user1", tweet_text="I love Spark!", hashtags="spark"),Row(tweet_id="t002", user_id="user2", tweet_text="PySpark is amazing!", hashtags="pyspark"),Row(tweet_id="t003", user_id="user3", tweet_text="Bad day with Spark errors.", hashtags="spark"),Row(tweet_id="t004", user_id="user1", tweet_text="Happy to learn Spark!", hashtags="spark,learning"),Row(tweet_id="t005", user_id="user4", tweet_text="I hate bugs in code!", hashtags="code,bugs"),]Output:
Initial Data:+--------+-------+--------------------+--------------+|tweet_id|user_id| tweet_text| hashtags|+--------+-------+--------------------+--------------+| t001| user1| I love Spark!| spark|| t002| user2| PySpark is amazing!| pyspark|| t003| user3|Bad day with Spar...| spark|| t004| user1|Happy to learn Sp...|spark,learning|| t005| user4|I hate bugs in code!| code,bugs|+--------+-------+--------------------+--------------+ -
Convert to Spark DataFrame and show the dataset.
df = spark.createDataFrame(data)df.show() -
Perform hashtag analysis by counting occurrences of each hashtag.
# Split hashtags by comma, then explode into individual rowshashtags_df = df.withColumn("hashtag", explode(split(col("hashtags"), ",")))# Group by hashtags and count occurrenceshashtag_counts = hashtags_df.groupBy("hashtag").count().orderBy("count", ascending=False)print("Hashtag Counts:")hashtag_counts.show()Output:
Hashtag Counts:+--------+-----+| hashtag|count|+--------+-----+| spark| 3|| pyspark| 1|| code| 1||learning| 1|| bugs| 1|+--------+-----+ -
Perform sentiment analysis based on keywords. We'll label tweets with positive or negative sentiment based on certain keywords.
positive_keywords = ["love", "amazing", "happy"]negative_keywords = ["bad", "hate", "errors"]# Add a sentiment column based on the presence of keywordsdf = df.withColumn("sentiment",when(col("tweet_text").rlike("|".join(positive_keywords)), "positive").when(col("tweet_text").rlike("|".join(negative_keywords)), "negative").otherwise("neutral"))print("Data with Sentiment Analysis:")df.select("tweet_id", "tweet_text", "sentiment").show()Output:
Data with Sentiment Analysis:+--------+--------------------+---------+|tweet_id| tweet_text|sentiment|+--------+--------------------+---------+| t001| I love Spark!| positive|| t002| PySpark is amazing!| positive|| t003|Bad day with Spar...| negative|| t004|Happy to learn Sp...| neutral|| t005|I hate bugs in code!| negative|+--------+--------------------+---------+ -
Perform user activity analysis by counting tweets per user.
user_activity = df.groupBy("user_id").count().withColumnRenamed("count", "tweet_count").orderBy("tweet_count", ascending=False)print("User Activity (Tweet Count by User):")user_activity.show()Output:
User Activity (Tweet Count by User):+-------+-----------+|user_id|tweet_count|+-------+-----------+| user1| 2|| user2| 1|| user4| 1|| user3| 1|+-------+-----------+
Conclusion
Congratulations! You’ve just taken a big step into the world of data analytics using IOMETE Spark Connect and PySpark in PyCharm. From setting up your project and connecting to a Spark cluster to diving into social media data, you’ve seen how easy and powerful it can be to uncover valuable patterns in data. Whether you're analyzing tweets or tackling bigger datasets, you’re now equipped to explore, experiment, and make the most out of Spark’s capabilities. Keep pushing boundaries, have fun with your data adventures, and happy coding!