ROADMAP
Native BI Dashboards
Status
Completed
Release Version
3.15.0
Last Updated
July 1, 2026
Overview
Empower users to transform SQL query results directly into rich, interactive visualizations — all within the IOMETE Lakehouse Platform.
This initiative eliminates the need to export data to external BI tools, enabling a unified workflow from data exploration to insight delivery. By tightly integrating with the SQL Editor and Worksheet Management system, users can compose, visualize, and share dashboards that are governed, secure, and live — powered by the same compute and data mesh architecture as the rest of IOMETE.
Planned Features
- Query-to-Dashboard Workflow: Build dashboards directly from saved SQL worksheets or query snippets.
- Visualization Library: Support for essential chart types — tables, line, bar, pie, and combo charts.
- Parameterization: Define and apply query parameters (date ranges, filters, etc.) directly in the dashboard.
- Auto-Refresh & Scheduling: Enable live or scheduled data refresh from underlying queries.
- Access Control: Dashboard visibility and sharing controls aligned with new domain-level security policies and Resource Bundles.
- Caching & Performance Optimization: Introduce result caching for faster dashboard loading.
- Versioning & Change History: Track edits, revisions, and previous dashboard states.
- Interactive Drill-Downs: Click-through navigation into underlying queries or datasets for deeper analysis.
- AI-Assisted Visualization Suggestions: Automatically suggest the best visual representation based on query results.
- Alerting & Thresholds: Define rules and receive alerts when metrics cross defined thresholds.
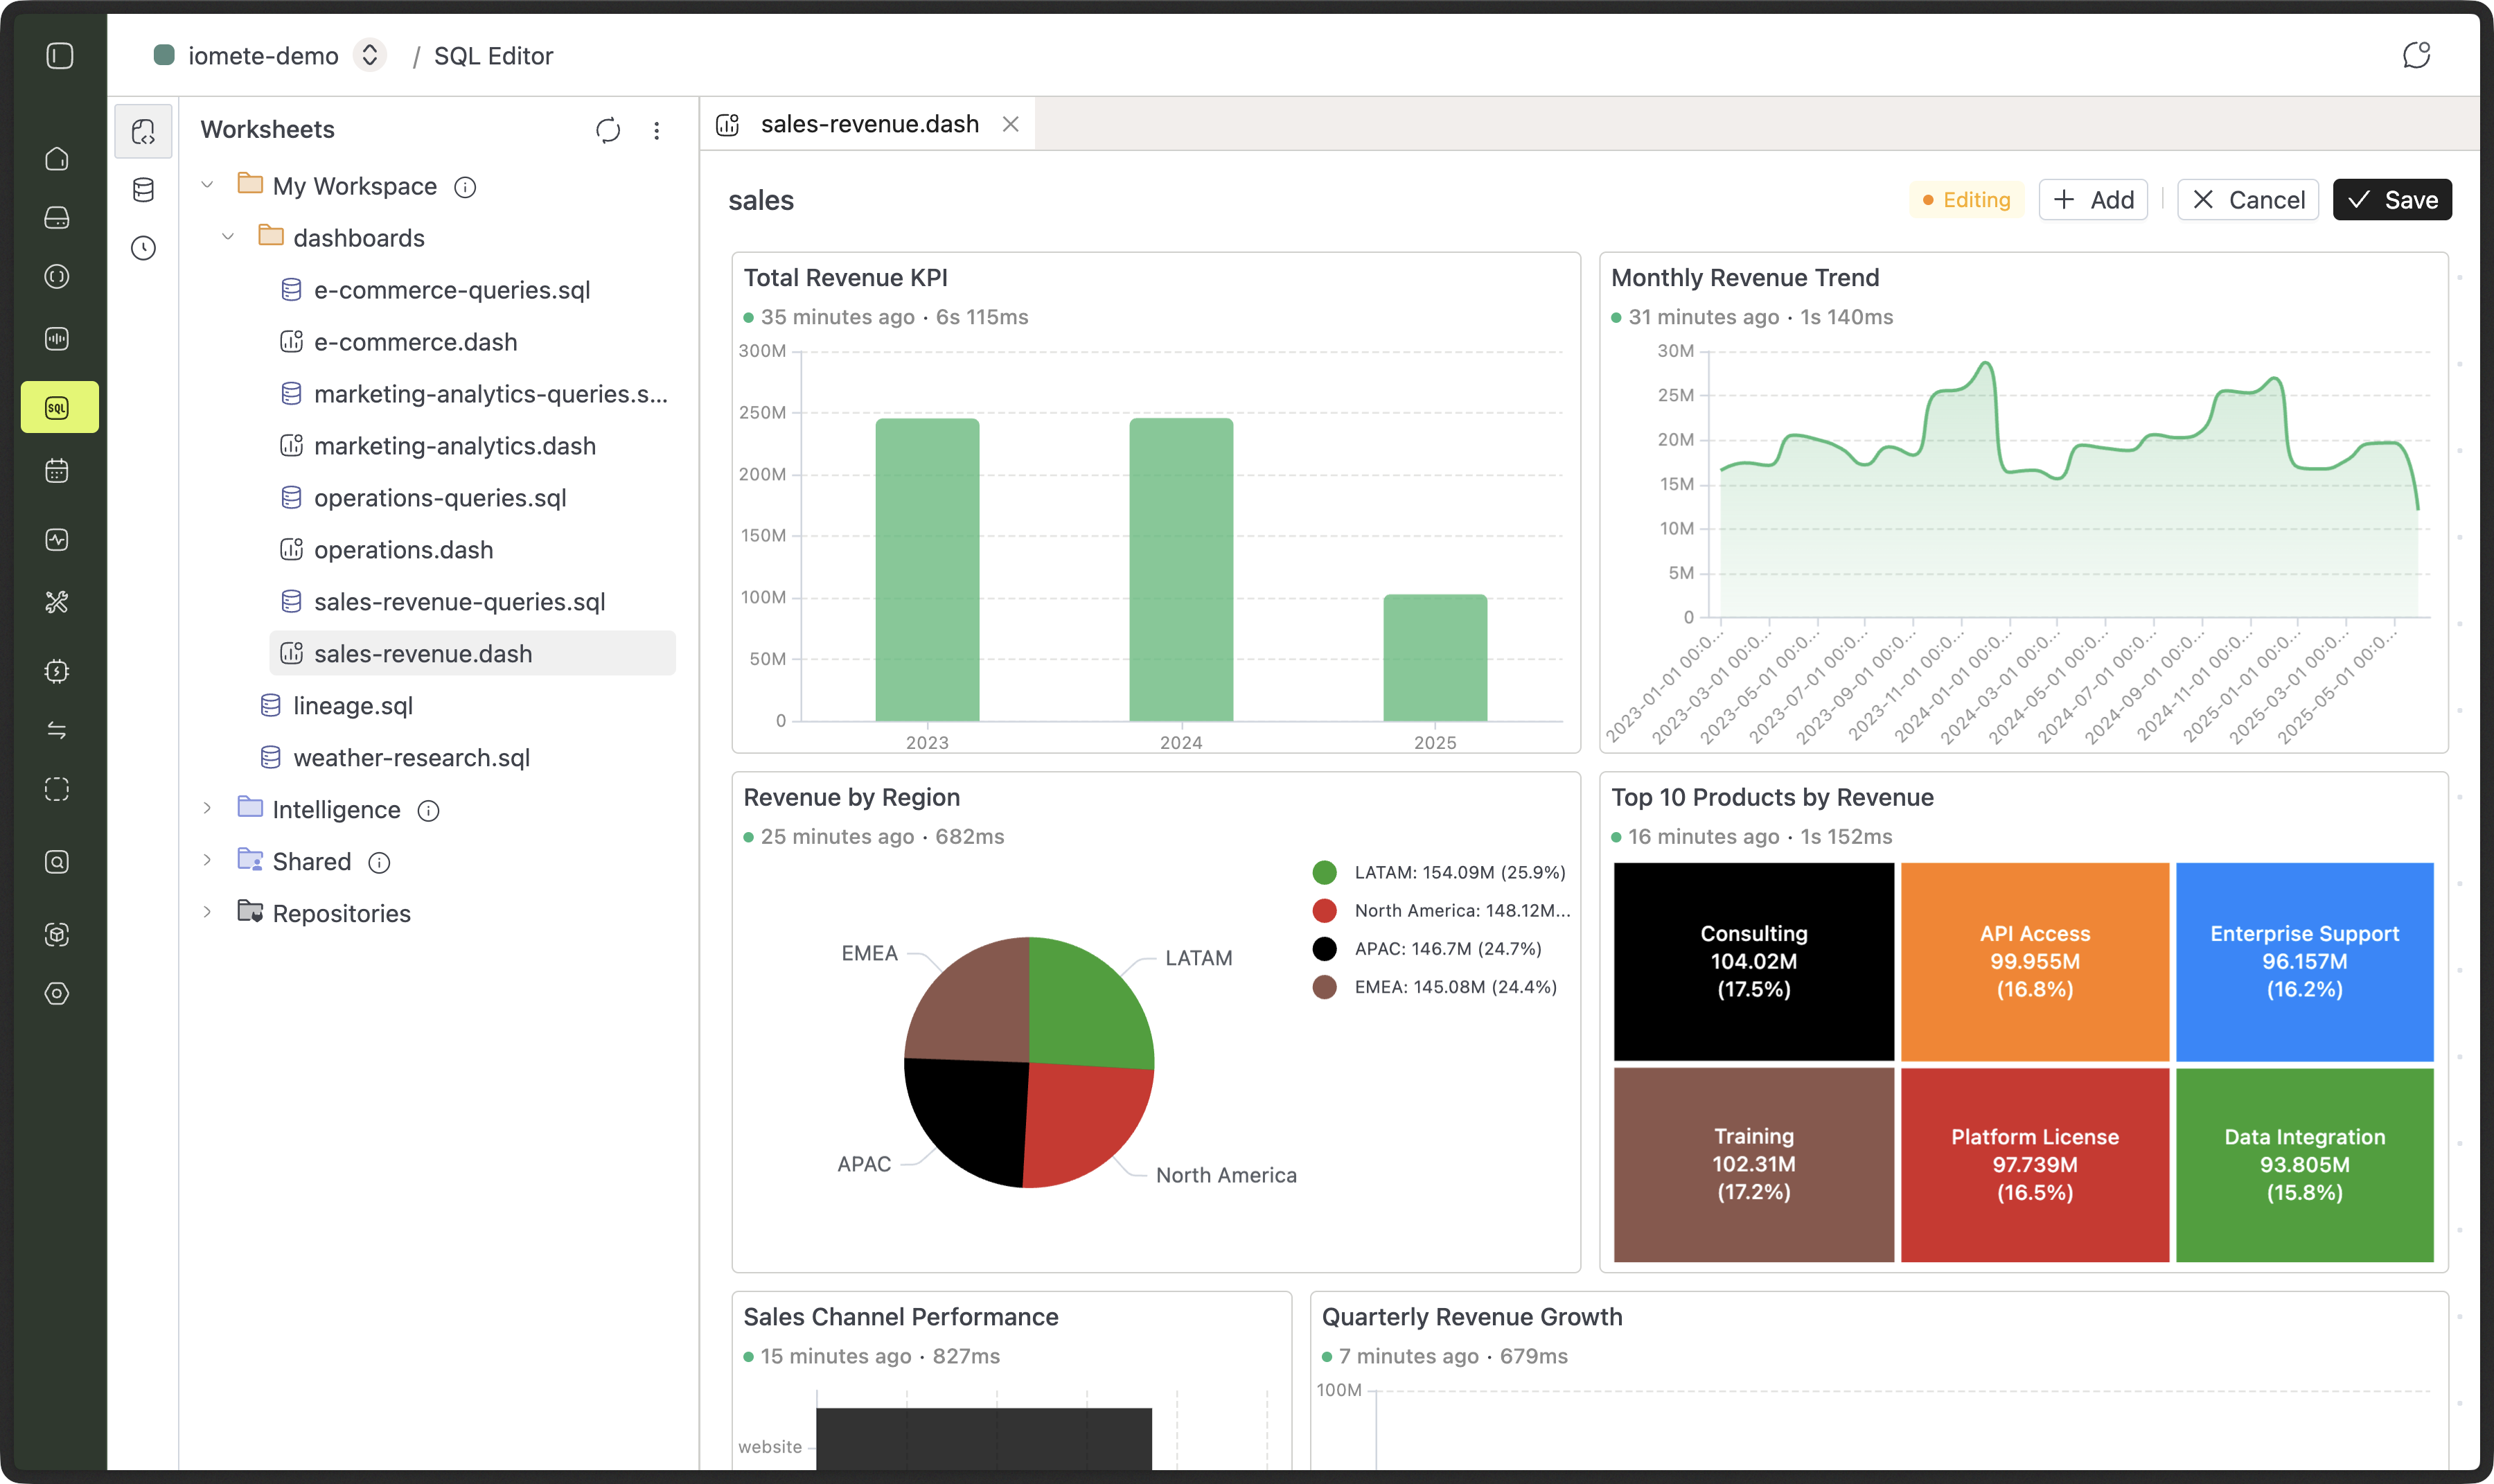
Screenshots
BOOK A DEMO
Starting with IOMETE is simple. Book a demo with us today.
The IOMETE data platform helps you achieve more. Book a personalized demo and experience the impact firsthand.
Get in touch